Saudian Market - TASI - weekly chartTASI - Saudian Market - weekly chart
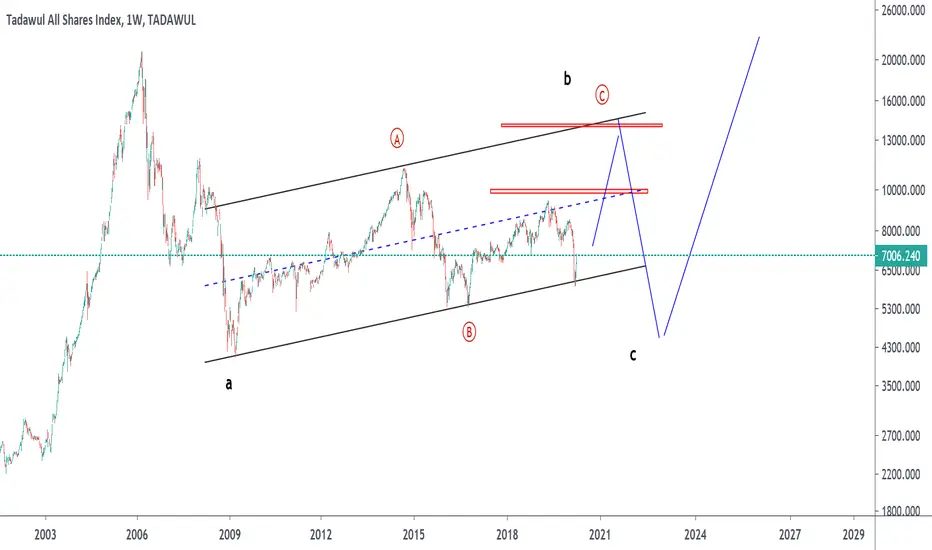
# The current trend is downtrend
# Under the important resistance 7000 may go to 5500 then 4775 to achieve targets of the head and shoulders pattern and the expected shark pattern
# The positive scenario will be above 7000
TASI trade ideas


buy
TADAWUL:TASI
According to the Fib Retracemment Index, the chart is rising to the level
0.236 after that it will decrease


Tasi Tasi Expected movement for this in the short medium term
Please be careful these times against keeping Saudi stocks
Also, oil prices must be monitored
Also follow-up to the Corona virus

TASI TASI is having hidden bearish Divergence. Therefore, the TASI's next target is at 6350.
Have a good day.


tasi relifethis idea built on 144 candels , which complated 3 cycle in time and 3 cycle in price in 240m chart


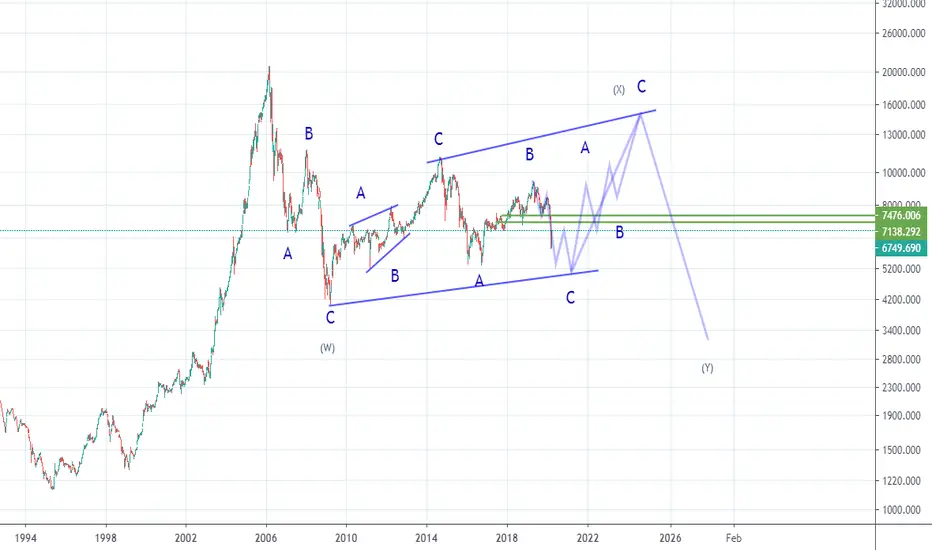
HEAD and SHOULDER CONFIRMED !!The Saudi Arabia Index formed a Head and Sholder pattern and broke the neck line, technically we should go to 5490 soon
So the OIL will also get down ??

tasiSaudi Market
Negative The negative is confirmed by breaking 8036 this week
If that happens then the first negative target is the 7,400 area, so let's be careful


