TASI daily follow up just an idea about TASI future points of interest where i put my knowledge to test hope very one find it helpful and plz if there any thing i missed or i am wrong about
Trade ideas

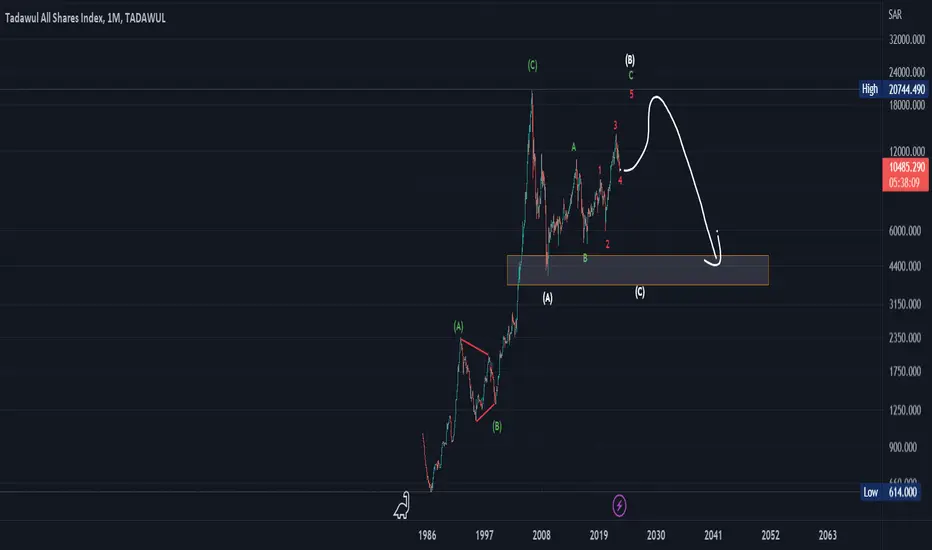
TASI follow up wave 4 correction hi there this is follow for yester day video and extra explanation of Wyckoff theory in markets hope every one find helpful and looking forward to your comments and information so we learn form each other ....

Technical and digital analysisWe notice that we are in an upward correction, there is an increase in the buying momentum, and that the price is in a strong correction, and we have a divergence

just an idea about TASI future points of interest just an idea about TASI future points of interest where i put my knowledge to test hope very one find it helpful and plz if there any thing i missed or i am wrong about

Get ReadyTasi is been falling non stop, but for now its at a very crucial support zone, most likely we should see a bounce from here and resume its uptrend.
Hit like & follow guys;)

the Saudi market index, TASIA possible rebound area for the Saudi market index, TASI, as the current area is a support area, as it is noted that the index respects Fibo levels, and the index is expected to rise again in the coming days.

#TASIHello my friends, this is TASI analysis, and this is what I learned from technical analysis. My opinion is that it is bouncing up from the green balloon area, and the targets are clear.

Task......4h= Analysis of the Saudi general index, the Tasi
= The analysis is based on technical analysis of the trend and price channels.
= The price crossed an ascending channel
= It is expected to reach the level of 11398.667, and when it reaches this level, it will make a correction or a horizontal path, and when it breaks it, it will go down to touch the level of 11032.137

TASI BUYthere is wonderful investment opportunity on tasi stock ; there is a strong breach of the downtrend a restest of the area and a bounce from it with a correction on the same area fiboacci 50 YOU CAN SEE MY ANALYSIS MY PAGE

TASI SHORT TERM LOOKS GOODLast week, TASI hold important level at 9950 which have been a solid support for it.
As I mentioned before TASI in a minor correction (ABC) after a great rally after corona bottom. Now, almost finished the first leg (A) which formed as (W-X-Y-XX-Z)
I think that TASI will pullback up as (B) will be a quick (ABC) targeting at least 11400 to 11800.
31May is an important date for TASI
(this is not a financial advice)

TASI to make slight correction and then uptrendTASI
Saudi Tadawul Index
On the daily chart, having a resistance level as technical indicator RSI is being overbought, and applying Fibonacci retracement, the index is likely to correct either 23% (11550) or 38% (11460), then rebound.
The next up wave will be begin after crossing up 11750, to target 12100
Note: The weekly and monthly charts are showing positive up potential.

TASITASI is struggling to beat the 11600 Mark in weekly chart.If it doesn't break within a week, a profit booking is likely anticipated.

TASIEVERY CANDLE HAS LIQUIDITY.
PRICE ALWAYS NEED LIQUIDITY.
Nobody Knows Where is Price Going.
Hey traders, here is the analysi.
If you guys like my analysis please hit like?? and follow.
Thanks.
DISCLAIMER- This is not financial advice.
SMART MONEY CONCEPT.
identify Liquidity Or Become Liquidity

TASINobody Knows Where is Price Going.
Hey traders, here is the analysi.
If you guys like my analysis please hit like?? and follow.
Thanks.
DISCLAIMER- This is not financial advice.
SMART MONEY CONCEPT.
identify Liquidity Or Become Liquidity

TASI WEEKLY ANALYSIS after the creation of engulfing candle we will see a continuation of uptrend towards supply zone

TASINobody Knows Where is Price Going.
Hey traders, here is the analysi.
If you guys like my analysis please hit like?? and follow.
Thanks.
DISCLAIMER- This is not financial advice.
SMART MONEY CONCEPT.
identify Liquidity Or Become Liquidity

Tadawul All Shares IndexTADAWUL:TASI
Tadawul All Shares Index
The general index of the Saudi market has come down and we have already identified the areas of demand and we said on Twitter that it will go up when it trades in and so on

full analysis TASIThe last wave to close is expected to rise, including a decline again to test the bottom of wave A
TASI (Weekly Bearish)Weekly H&S
Currently re-testin the neck-line
doubtful it will break through to the upside.
I wouldn't short tho.. just my observation

view on TASITASI is bearish for the short term ,
that is not signal , it is just my view
what is your view for tasi ?
share your view .

TASINobody Knows Where is Price Going.
Hey traders, here is the analysi.
If you guys like my analysis please hit like?? and follow.
Thanks.
DISCLAIMER- This is not financial advice.
SMART MONEY CONCEPT.
identify Liquidity Or Become Liquidity

tasi, approaching a strong resistance levelWill he penetrate or turn back? ... I await your opinions
((Everything I write is a point of view that accepts right and wrong and is not considered buying or selling advice...just for discussion)).

TasiTADAWUL:TASI
Draw a prediction chart for the Saudi stock market index until May 29th, and predict the market movement on an hourly time frame."
