Weekly Analysis of the S&P 500 (ES) - Sep 22 - 26 - Fundamental Bias
So, here's the deal: we're still on an upward trend, but price is pushing against a "ceiling cluster" just above us. Expect a slow climb for now until something changes.
As long as we stay above 6,700–6,705, dip buyers will probably step in and try to push things back up to the 6,73x/6,75x r
Related futures

Day 35 — Trading Only S&P Futures | SPX Hits RecordDay 35 of Trading Only S&P Futures is complete!
Today was one of the smoother days. We opened with a bullish structure signal and a clean backtest near the MOB. From there, the market ripped higher. I didn’t catch the full move but I did nail the initial push, which gave me space to step away for m

ES (E-mini S&P 500) — Plan for Wed Sep 24Fundamentals (tomorrow, ET)
04:00 Germany IFO Business Climate (often moves European risk tone during London).
10:00 U.S. New Home Sales (Aug) — official Census schedule lists New Residential Sales at 10:00 a.m..
10:30 EIA Weekly Petroleum Status Report (standard time each Wed).
13:00 U.S. 5-Year No

What is Gamma?🔎 What is Gamma?
Gamma Exposure (GEX) measures how much and how fast an option’s Delta changes as the underlying moves.
Why does this matter? Because when options shift, market makers must hedge, and their hedging can move markets.
Gamma = the “acceleration” of Delta.
Large gamma zones = areas wher

Day 36 — Trading Only S&P Futures | -$1175 LossDay 36 of Trading Only S&P Futures is in the books — and it wasn’t pretty.
I started the session well, up about +$100, but got greedy and overleveraged at 6728 thinking Powell’s comments would flip the market bullish. I was wrong. That single forced trade cost me the day, dropping -$1175.
To make

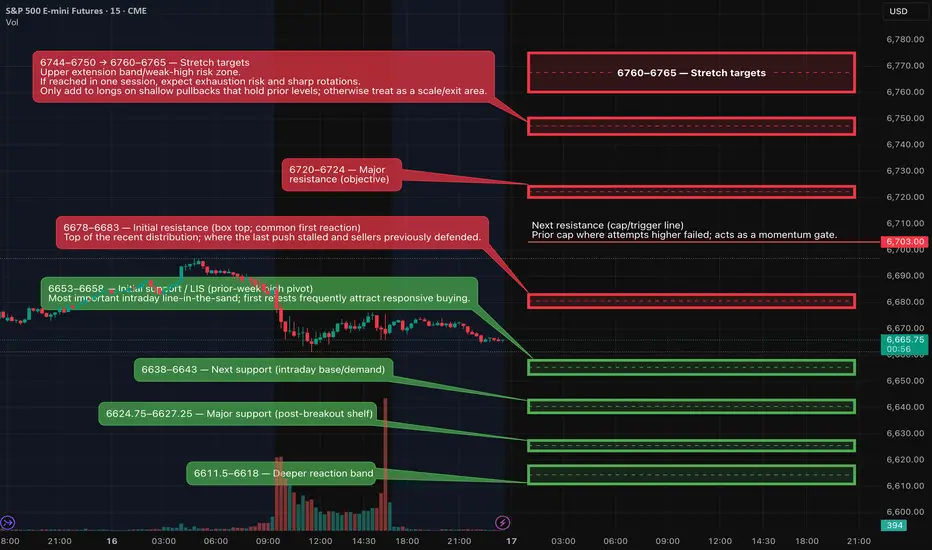
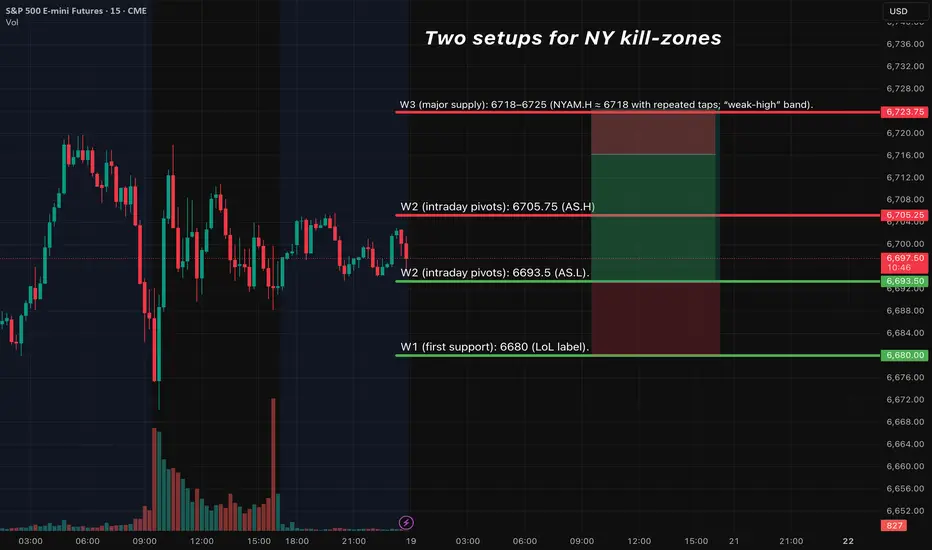
ES (SPX) Analyses for Wed, Sep 17 - FOMC - Key ZonesBias:
The weekly and daily trends are staying positive, with higher highs and higher lows. We're in an uptrend, but right now, we're hitting some resistance instead of pushing into new territory.
Price-wise, we’re stuck in a range between two key levels: there’s some overhead resistance at 6678–66
ES - September 18th - Daily Trade PlanSeptember 18th - 5:30am
Before reading this trade plan, IF, you did not read yesterday's take the time to read it first!
(You can see my post in the related publication section)
I wrote yesterday ...
"My main levels I will be watching for a pull back to are 6659, 6653, 6648-50, 6643. The white tr

S&P 500 (ES1!): Bullish! Buy The Dip! Keep It Simple!Welcome back to the Weekly Forex Forecast for the week of Sept 22 - 26th.
In this video, we will analyze the following FX market: S&P 500 (ES1!)
The S&P500 is still bullish, and there is no reason to short it.
Wait for price to pullback to a +FVG, and then look for valid buy setups on your ent

ES (SPX) Analyses - Key Levels - Setups - Fri, Sep 19Bias:
After the recent FOMC meeting, where they cut rates by 25 basis points on September 18, the E-mini S&P 500 futures are looking a bit bullish. There’s decent support holding up, but expect some bumpy trading around those all-time highs. We might see the market bouncing between the usual value
ES - September 19th - Daily Trade PlanSeptember 19th - 6am
Before reading this trade plan, IF, you did not read yesterday's take the time to read it first!
(You can see my post in the related publication section)
I wrote yesterday ... "We need a pull back with some structure to one of the levels, ideally at either 6696-6700, 6692, 6682

See all ideas
Summarizing what the indicators are suggesting.
Neutral
SellBuy
Strong sellStrong buy
Strong sellSellNeutralBuyStrong buy
Neutral
SellBuy
Strong sellStrong buy
Strong sellSellNeutralBuyStrong buy
Neutral
SellBuy
Strong sellStrong buy
Strong sellSellNeutralBuyStrong buy
A representation of what an asset is worth today and what the market thinks it will be worth in the future.
Frequently Asked Questions
The current price of S&P 500 FUTURES (Dec 2025) is 6,709.50 TWD — it has fallen −0.20% in the past 24 hours. Watch S&P 500 FUTURES (Dec 2025) price in more detail on the chart.
The volume of S&P 500 FUTURES (Dec 2025) is 25.00. Track more important stats on the S&P 500 FUTURES (Dec 2025) chart.
The nearest expiration date for S&P 500 FUTURES (Dec 2025) is Dec 19, 2025.
Traders prefer to sell futures contracts when they've already made money on the investment, but still have plenty of time left before the expiration date. Thus, many consider it a good option to sell S&P 500 FUTURES (Dec 2025) before Dec 19, 2025.
Open interest is the number of contracts held by traders in active positions — they're not closed or expired. For S&P 500 FUTURES (Dec 2025) this number is 135.00. You can use it to track a prevailing market trend and adjust your own strategy: declining open interest for S&P 500 FUTURES (Dec 2025) shows that traders are closing their positions, which means a weakening trend.
Buying or selling futures contracts depends on many factors: season, underlying commodity, your own trading strategy. So mostly it's up to you, but if you look for some certain calculations to take into account, you can study technical analysis for S&P 500 FUTURES (Dec 2025). Today its technical rating is buy, but remember that market conditions change all the time, so it's always crucial to do your own research. See more of S&P 500 FUTURES (Dec 2025) technicals for a more comprehensive analysis.