"Get Up Offa That Thing"James Brown 1976 Funk
Get up offa the shutdown.
Get up offa the dance floor.
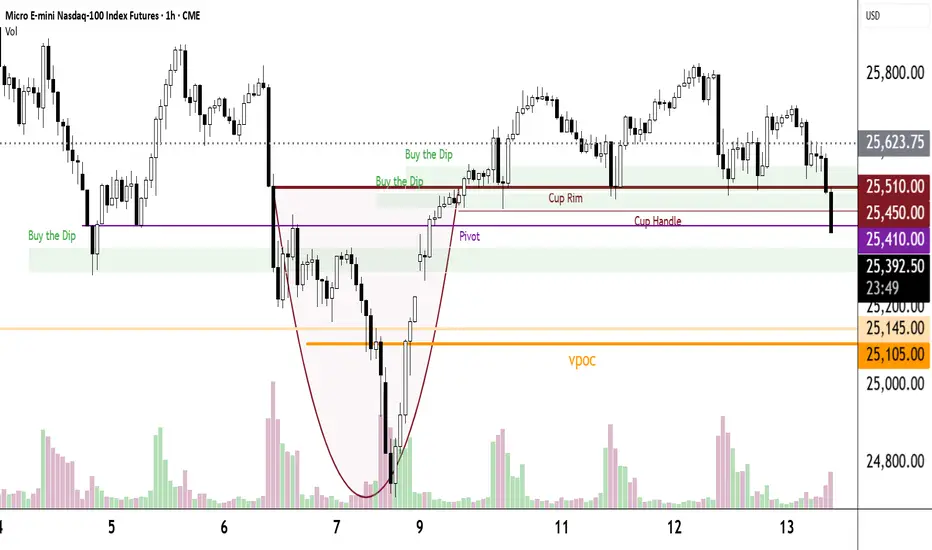
Today's Dance Floor is 25510.
Hmmm...What's happening? He thought we would have seen a much bigger bounce last night when the shutdown ended.
Today's key landmarks are clearly seen.
Buy the Dips
***Wait for a bounce
***He simply waits for a Bullish white candle.
***Then he looks for a bit of support, your choice, whatever you are comfortable with.
***In 5-point increments from there to the low of the bounce he buys 1 MNQ
***Each entry has a 21-point target.
If you are more conservative, tailor it to your trading style. He especially likes a White Bull preceded by an Exhaustion Candle @ a Prior Day Close.
No stops allowed.
Sometimes the Px falls through the floor. Keep some dry powder for that event.
Repeat the process for the next BTD area.
This plan is a $$$ maker.
Don't forget Breakouts, A Pawn for a King, Pivots & Jokers.
Trade ideas
NQ Short (forced trade)Well, this is a forced trade opp. It means that iam not very sure but i would take this opp anyways.
Here are my two cents. ES looks bullish to me, while NQ is bearish. Which is something odd.
Anyways, here is the trade. Be careful taking it with size, because iam very well could be wrong.
Good luck everyone!!

NQ1 - Bullish Whipsaw = Dip Buys In Choice StocksNasdaq just printed a big bullish whipsaw on the 4 hour chart to tap liquidity below support and rebound back up.
This is quite a significant bullish signal.
It is lower time frame so we will need to see it hold and it may chop around...
But in this area is where we're likely to see bullish recoveries and breakouts in choice stocks and even crypto 🧐.

NQ to Retest low before going back up I have been watching trading NQ alot lately and here is my prediction for the next moves.

possible bounce NQ from trendlineNQ is testing a 4h symmetrical traingle line sfp frome here might deliver a bounce or otherwise we go lower.
NAS100 - Head and ShouldersWithout a doubt, a Head and Shoulders according to the bullish channel, RSI in oversold territory, looking ahead to the Year-End rally...


Ascending triangle gaps end of earnings (just about) correction?All the earnings releases and positive impact of business investment in AI gave the market anther move higher, but what now everything is so stretched gaps appearing and a negative pattern suggest a correction, the question how far ?

Market Maker Buy ModelMarket Maker Buy Model in the making for NQ:
- Weekly low triggered;
- Inversion FVG creation;
- Swing high broken;
- Targeting 0.705 of the Dealing Range;
- Entry at the highest FVG with Swing low for stop placement;
- Leap trade;

TREND LINE 5M30 SECOND MODELPrice swept the prior session’s Asia low, tapping into a 4H demand zone aligned with a 1H bullish order block. On the 1-minute chart, liquidity was taken and a clean BISI formed. Entered long on the first retracement into the FVG with stops below the swing low. Targeted the opposing 15M liquidity pool, partialed at the midpoint, and closed the rest as price reacted into a 1H imbalance.

NQ - 15min chart T.A explained -
BackSide (BS)
FrontSide (FS)
Inverse BS (Inv.BS)
Inverse FS (Inv.FS)
BS & FS levels are expected support when dashed lines, tested when dotted and resistance when solid lines.
The inverse is true for the Inv. BS Inv. FS levels, they are resistance as dashed lines, tested as dotted and support as solid lines.
Monthly timeframe is color pink
weekly grey
daily is red
4hr is orange
1hr is yellow
15min is blue
5min is green if they are shown.
strength favors the higher timeframe.
2x dotted levels are origin levels where trends have or will originate. When trends break, price will target the origin of the trend. its math, when the trend breaks, the vertex breaks too so the higher timeframe level/trend that breaks, the more volatility there could be as strength in the orders flow in to fuel the move.

BULLISHNQ
BIAS: BULLISH
DAILY: Price is currently above the daily -OB MT. Yesterday, price retraced to the 4H + inversion fair value gap and respected this discount array and took off.
PDH & Asian High (equal highs): Has been raided ahead London opening plus the Old High on Thursday Nov. 06, 2025. Then it retraced lower filled the 1H +FVG between 11:00pm and 1:00am
PRE-MARKET: NQ and ES made a LL whereas YM failed to make a LL. There's a cracking correlation here (SMT).
BUYSIDE TARGET: LONDON HIGH @25,830.25 and DAILY -FVG Low end @ 25,881.00

NQ1Here is a couple of possibilities: If we can bounce here at the diagonal green line then it will be making a higher low to continue the uptrend.
However, the green horizontal line is the neck line @ 24,119 for a possible head and shoulders pattern or a double bottom...either way it should bounce there... but we will have to wait for pattern development.

OPEC and Global Market Stability1. The Role and Objectives of OPEC
OPEC’s primary objective is to achieve stable oil prices in international markets while ensuring a fair return on investment for producing nations and a steady supply for consuming countries. To maintain balance, OPEC regulates oil production among its member nations, aligning supply with demand.
Market stability is central to OPEC’s philosophy. Volatility in oil prices—whether due to oversupply, underproduction, or external shocks—can harm both producers and consumers. For producers, low prices reduce revenue and strain national budgets; for consumers, excessively high prices trigger inflation and economic slowdowns. Thus, OPEC’s interventions are designed to prevent extreme price swings and promote predictability in global markets.
2. Mechanisms for Market Stability
OPEC uses a combination of strategies to achieve stability in the oil market:
a. Production Quotas:
The most significant tool is the allocation of production targets among member states. During times of excess supply, OPEC cuts output to prevent price declines; when demand rises or prices surge too high, it increases production. This mechanism acts as a balancing lever in the market.
b. Monitoring and Market Analysis:
OPEC maintains a highly sophisticated system of data collection and analysis. Through the OPEC Secretariat in Vienna, the organization constantly monitors global economic trends, oil inventories, demand projections, and supply disruptions. This allows OPEC to make informed decisions that align with global economic realities.
c. Cooperation with Non-OPEC Producers:
In recent years, OPEC has expanded its influence by forming alliances with non-member oil-producing countries, such as Russia, Mexico, and Kazakhstan. This collaboration, known as OPEC+, was formalized in 2016. The OPEC+ framework enhances OPEC’s control over the global oil supply, making it easier to stabilize prices in times of volatility.
3. OPEC’s Historical Impact on Market Stability
Since its inception, OPEC’s policies have shaped the evolution of global oil markets.
a. The 1970s Oil Crises:
During the early 1970s, OPEC gained significant power by using oil as a political and economic tool. The 1973 oil embargo, in response to Western support for Israel during the Yom Kippur War, caused prices to quadruple. Although disruptive, it demonstrated OPEC’s ability to influence global energy markets and highlighted the importance of energy security for consuming nations.
b. The 1980s Oil Glut:
In the early 1980s, technological advancements and overproduction led to a sharp fall in prices. OPEC responded by reducing output quotas, attempting to balance the market. However, disagreements among members limited effectiveness, underscoring the challenge of enforcing collective discipline.
c. The 2000s Oil Boom:
Rapid industrialization in China and India fueled a massive surge in global demand, leading to record-high oil prices. OPEC managed this period by gradually increasing production while maintaining relative market stability.
d. The 2020 COVID-19 Shock:
Perhaps the most dramatic test of OPEC’s stabilizing role occurred during the COVID-19 pandemic. In April 2020, global oil demand collapsed as travel and industrial activity halted. Prices even turned negative for a brief period. OPEC+, led by Saudi Arabia and Russia, implemented historic production cuts of nearly 10 million barrels per day to restore equilibrium. Within months, markets began recovering, showcasing OPEC’s ability to stabilize a crisis-driven market.
4. Challenges to OPEC’s Market Stability Mission
Despite its influence, OPEC faces multiple challenges in maintaining stability in today’s rapidly changing energy environment.
a. Internal Disagreements:
OPEC’s strength depends on collective compliance. Differences in economic needs, production capacities, and political agendas among member states often cause disputes. For instance, nations like Saudi Arabia prefer conservative production strategies, while others like Iran or Nigeria may push for higher output to meet domestic financial obligations.
b. Competition from Non-OPEC Producers:
The rise of shale oil production, particularly in the United States, has reduced OPEC’s market dominance. Shale oil’s flexibility—its ability to ramp up production quickly when prices rise—has weakened OPEC’s control over global supply dynamics.
c. Energy Transition and Climate Policies:
As the world shifts toward renewable energy and decarbonization, the long-term demand for oil may decline. This transition poses strategic challenges for OPEC, as it must adapt to a market where oil is no longer the primary source of energy. Balancing environmental commitments with economic survival remains a delicate task.
d. Geopolitical Tensions:
Many OPEC members are located in politically volatile regions. Conflicts in the Middle East, sanctions on countries like Iran and Venezuela, and regional rivalries can disrupt production and weaken the organization’s cohesion.
5. OPEC’s Modern Strategies for Stability
In response to evolving challenges, OPEC has refined its approach to market stability.
a. The OPEC+ Alliance:
The OPEC+ coalition has been a major innovation in global oil diplomacy. By bringing non-member producers into coordinated production agreements, OPEC has extended its reach beyond traditional boundaries. This broader coalition enhances the group’s capacity to respond to market shocks and maintain price stability.
b. Flexible Policy Frameworks:
OPEC now adopts a more flexible and data-driven approach. Instead of rigid annual quotas, it meets regularly to adjust policies based on real-time data. This agility allows quicker responses to demand changes, such as post-pandemic recovery or geopolitical disruptions.
c. Investment in Energy Technology:
Some OPEC members are diversifying their economies by investing in renewable energy, hydrogen, and carbon capture technologies. For example, Saudi Arabia’s Vision 2030 plan aims to reduce dependence on oil revenues and strengthen economic resilience. This diversification supports long-term market stability by mitigating risks from oil dependency.
6. OPEC’s Economic and Geopolitical Influence
OPEC’s role extends beyond oil markets—it significantly impacts global macroeconomic stability and international relations.
When OPEC successfully stabilizes prices, both producers and consumers benefit. Predictable oil prices allow governments to plan budgets, encourage investment, and maintain economic growth. Conversely, instability often leads to inflation, currency fluctuations, and trade imbalances.
Geopolitically, OPEC serves as a platform for dialogue between member nations, fostering cooperation in an otherwise fragmented global environment. Its coordination with non-OPEC producers has also strengthened diplomatic ties across continents.
7. The Future of OPEC and Market Stability
Looking ahead, OPEC’s relevance will depend on how effectively it adapts to a transforming global energy landscape. The push for carbon neutrality, electric vehicles, and renewable alternatives poses both threats and opportunities. While demand for oil may plateau in the coming decades, OPEC can continue to play a stabilizing role by ensuring orderly transitions in the energy market.
Future stability will likely involve balancing oil production with global sustainability goals, supporting cleaner technologies, and maintaining dialogue with both producers and consumers.
8. Conclusion
OPEC has been, and continues to be, a cornerstone of global market stability. Through production management, international cooperation, and adaptive policymaking, it has guided the oil market through crises, booms, and transitions. While challenges such as energy diversification, internal discord, and environmental policies loom large, OPEC’s experience and coordination capacity position it as a key player in shaping the future of global energy stability.
In essence, OPEC’s success in stabilizing markets lies not only in controlling oil output but in balancing the complex intersection of economics, politics, and sustainability in a world increasingly conscious of both energy security and environmental responsibility.

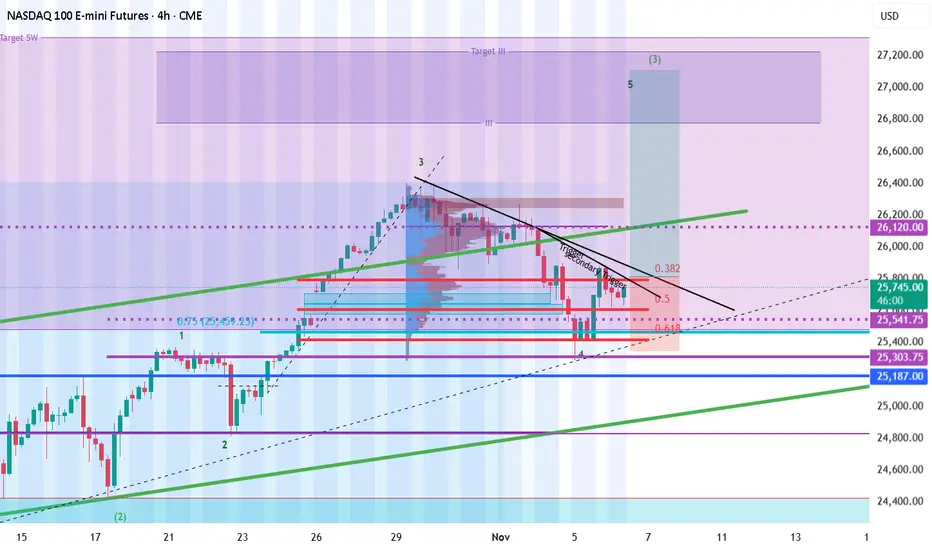
Elliott Wave Analysis of Nasdaq (NQ) Forecasts New All Time HighThe bullish cycle in the Nasdaq (NQ) that commenced from the April 2025 low remains underway, unfolding as an impulsive Elliott Wave structure. Within this broader advance, wave (3) of the eight-month rally concluded at 26,399. The subsequent corrective phase, wave (4), developed as a double three structure. This is an Elliott Wave pattern characterized by a combination of corrective sequences.
From the peak of wave (3), wave ((a)) declined to 25,853, followed by a rebound in wave ((b)) that reached 26,274. The final leg of the correction, wave ((c)), extended lower to 25,282, thereby completing wave W of a higher degree. A subsequent rally in wave X peaked at 25,880 before the index turned lower once more in wave Y, which has taken the form of a zigzag.
Within wave Y, wave ((a)) declined to 25,162, followed by a corrective bounce in wave ((b)) to 25,354.75. The final leg, wave ((c)), dropped to 24,707.1, marking the completion of wave Y of (4). From this low, the index has resumed its upward trajectory in wave (5). Advancing from wave (4), wave ((i)) topped at 25,768.75, and the pullback in wave ((ii)) found support at 25,478.50. Provided the pivot at 24,707.1 remains intact, the near-term outlook favors further upside continuation in wave (5)

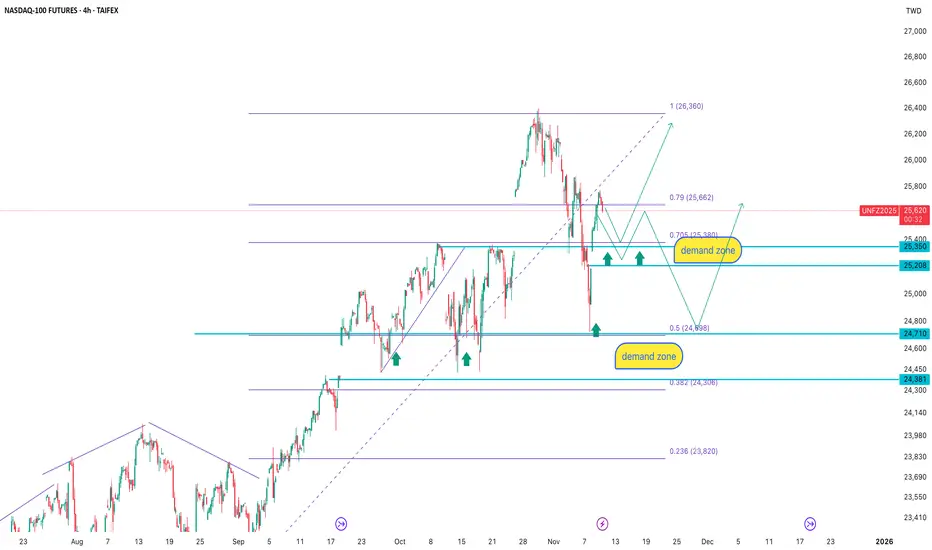
NASDAQ-100 4H: demand is not gone, only waiting for the priceAfter the recent upward impulse, the price retraced into the key demand zone at 25 350–25 208, an area that has repeatedly triggered buying reactions in the past. T
he latest correction pushed the price into the 0.79–0.705 Fibonacci range, which frequently acts as a retest zone before continuation.
Below that lies an even stronger demand zone at 24 710–24 381, aligning with the 0.5 Fibonacci level and previous volume accumulation.
The trading logic here is simple: don’t chase the move, let the price come to demand and wait for confirmation.
As long as the market structure holds, the primary scenario remains bullish from demand zones with a target toward 26 360 and potentially higher.
Fundamentally, NASDAQ remains supported by expectations of softer Fed policy, strong tech capital inflows, and continued investment in AI, cloud, and data-center infrastructure. Smart money accumulates on corrections, not on peaks.
When price falls into demand, it’s not fear — it’s opportunity.
Nasdaq - potential trigger Break for a long targetNasdaq - potential trigger Break for a long target
We are at final point of rebound
We can have a potential 5 wave so, if price will break trigger zone we can have final long wave.
NQ Short opportunityBased on TA, i see a shortBased on the market structure, there are few unmitigated orders that are not filled which needs to be tapped into before covering the gap formed below. Daily TF, there is a WICK CE available to get retraced into

NQ Daily Outlook | November 12th, 2025Most likely direction: Up (bullish)
Why:
Trend is still up on my read of structure.
NY session pulled back deeper than expected and slipped under the black 50 EMA.
I see it as a correction within the trend. I expect price to reclaim and trade back above the EMAs and continue higher.
Scenarios:
Preferred — Reclaim and continue: We push back above the EMAs, they curl up, and we get a break of structure to the upside. I’ll look to join on the first clean impulse → shallow correction → continuation above the EMAs.
Retest then go: We dip a bit more, hold a higher low, then reclaim the EMAs. Once BOS up prints and EMAs fan upward, I lean long again.
Bear alt: We stay trapped under the 50 EMA, fast EMAs roll over, and we print a BOS down (lower low). If that happens, I step back or treat it as range-to-down for the day.
Bias:
Bullish while we can reclaim and hold above the EMAs with upside BOS.
If EMAs stay above price and structure flips down, I’ll pause the long idea.

Ode to Joy Jr.Buy the Dips worked well.
He always waits for a bounce in a BTD area (accumulation/distribution area). He buys 1 MNQ in 5-point intervals. Every target is 21 points. His first entry was 610 and his bottom entry was 490.
He has entered NQ Breakouts. First entry at 620 and every 20 points thereafter. 19-point target per entry.
If you prefer The MNQ Ladder of success you may buy 1 or more contracts every 5 points. 19-point target per entry. If you prefer 1 or more contracts every 10 points.
Ode to Joy Jr. because I think the original may have been taken down by the moderators.

Trades with B – Daily Recap (Nov 10 2025)Ticker: QQQ / NQ1!
Strategy: ORB Pro with Filters + 5 min / 15 min Multi-Timeframe Confluence
Result: Green day ✅ (+$97.78 total gain)
🧭 Market Context
The market opened inside an early consolidation range with mixed momentum. The 5-minute chart gave the first confirmation through a clean ORB signal rejection, while the 15-minute held the higher-timeframe structure and kept the EMA slope intact.
The plan today was simple — trade the first valid signal from ORB Pro, confirm with the higher timeframe trend, and respect stops.
🎯 Trade Execution Recap
9:37 AM: First Call entry (ORB signal + fib retest) — caught the initial push before stall. + $172.94
9:44 AM: Locked profits on strength into EMA resistance.
11:14 AM: Put entry after ORB Pro signaled a short on the 5 min matching 15 min trend.
11:40 AM: Exit for + $194.94 after momentum follow-through.
Cumulative Options P/L:
QQQ $618 Put (11/10/25) → + $67.89
QQQ $621 Call (11/10/25) → + $29.89
Net: + $97.78
💡 What Went Right
Followed the ORB signal with confirmation from the higher-timeframe trend filter.
Perfect execution on the Put trade — clean entry and timely exit.
Didn’t overstay the welcome once the move completed.
⚠️ What to Improve
Stay patient for stronger confluence before taking early entries.
Avoid re-entries once price returns to mid-range (less edge after initial break).
🧘♂️ Reflection
“The 5 min showed me the trigger, the 15 min confirmed the story. ORB Pro did its job — I just had to listen.”

Long trade
15min TF overview
Pair / Contract: MNQ1! (Micro E-mini Nasdaq-100 Index Futures)
Date: Mon 3 Nov 2025
Session: Tokyo Session → Pre-Asia to London Transition
Direction: Buy-side Trade
Timeframe: 15 minutes
🔹 Trade Details
Entry: 25 466.75
Take Profit (TP): 25 709.50 (+0.95 %)
Stop Loss (SL): 25 409.25 (–0.23 %)
Risk / Reward (RR): 3.14 R
🔹 Market Context
After a broad distribution → markdown sequence, price reached a high-volume imbalance zone near 24 900–25 000 — a previous accumulation base.
🧾The session opened with a liquidity sweep beneath prior low (24,875) → confirmed displacement above intraday structure.
🧾Multiple FVG patches stacked through 25 200–25 400 served as a refined entry trigger and confluence for continuation.
🧾Volume expansion into the retrace + KAMA flattening then uptick confirmed a shift in short-term bias to bullish.
🧾Target aligns with upper gap fill/supply zone ≈ 25 700 (level of previous imbalance).
🔹 Model Type
Accumulation → FVG Continuation Model
Displacement leg established structural BOS above 25,300.
Entry taken on retrace into discount FVG and breaker block confluence zone (25 460–25 420).
Price objective: recovery into the premium zone (gap-fill @ 25 700).
🔹 Execution Notes
Entry triggered after observing a clean MSB on the 5-minute chart, with confirmation of a candle close above KAMA. Stop set below FVG origin (25,409) to maintain a tight risk. Partial profits secured at 25,600 region before NY open volatility. Risk controlled with FVG-based entry for ~3 R return potential within the session window.
5min TF overview
🔹 Trade Narrative
This MNQ setup represents a reversal transition from a bearish liquidity flush into a controlled markup. The combination of volume absorption at the low, multiple FVG alignments, and a clear BOS confirm smart-money accumulation. With strong confluence from session timing and gap magnet at 25,700, this position targets a measured buyside retracement within a broader range-bound context.

NQ = NAS100Elite Strategy
NASDAQ (MNQ/NQ) – Multi-Timeframe Analysis
Price tapped into the 45-minute imbalance inside a 4H premium zone. The overall structure remains bearish, and the reaction confirms sellers defending this level.
Expecting continuation toward 25,300 and possibly 25,000 as the next liquidity zones.
Key confluence: 4H bearish structure + 45m FVG + liquidity grab on 5m.
📊 Educational analysis — not financial advice.
-------
Higher-Timeframe Context (4H Chart)
🔹 Overview
The 4H chart shows a clear bearish structure: lower highs and lower lows.
Price dropped aggressively from the 26,300–26,400 supply zone (blue).
The market then found strong demand at 24,800–25,000 (blue + gray confluence zone).
Current price is reacting to a 45-minute fair value gap (FVG) marked in red, sitting inside a bearish 4H imbalance.
🔹 Implications
The FVG at 25,550–25,600 represents a premium retracement level in a bearish leg.
This area is optimal for short-position entries as price taps into unmitigated imbalance.
Expectation: rejection → continuation toward 25,300 or lower, targeting the demand zone (24,900–25,000).
_______
Lower-Timeframe Confirmation (5-Minute Chart)
🔹 What’s happening now
Price just filled the 45-minute gap and reached the same supply zone.
Microstructure shows a slowdown + rejection wick from the red zone.
Potential entry trigger for short bias around 25,555–25,590.
Targets:
1st TP: 25,400 (internal liquidity)
2nd TP: 25,300 (structural low)
Stop-loss above 25,595 (above FVG).
🔹 Confluence
4H + 5M both align: bearish reaction at premium zone.
The liquidity buildup under 25,400 acts as the next target area.
