NQ Targets (11-24-25)The downtrend is on and will play inside the Diablo's (red diagonal lines) until breakout. 24,600 to 24,056 is Churn Zone and 24,708 and 24,226 are KL's to watch for opposite direction trades 1st and follow through 2nd. NAZ did come close to -10% level in the overnight, popped back up on a Friday (t
Related futures

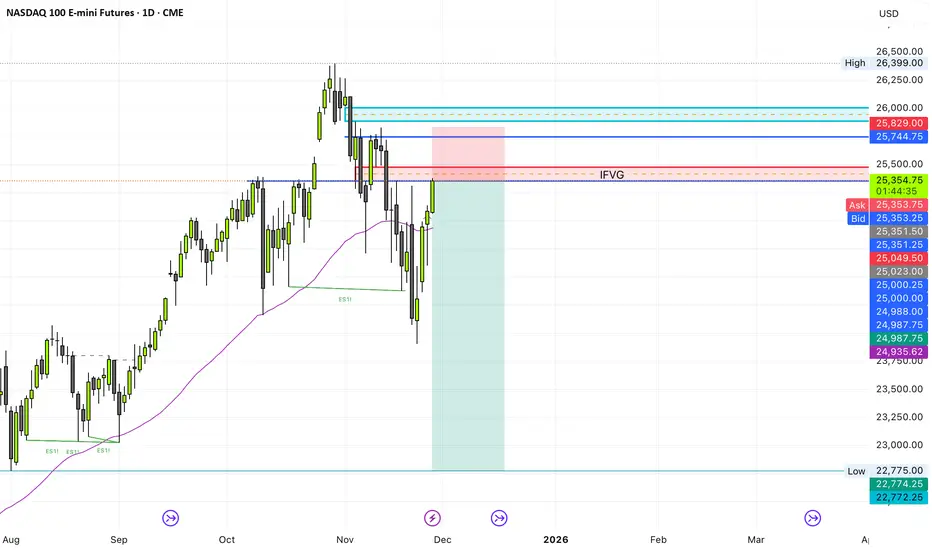
Potential short setup on NQ
I am still learning but looking to me like a potential short setup from that daily inverted fair value gap targeting the next sell side liquidity zone.
Please let me know in the comments if my bias is wrong and why.
NQ Short (12-02-25)Easy one from here, Long above 25340-360 and Short below. Let the Overnight lift and stall and look at Reg Session Open Drive for a drop test. Tweets, Tricks and low volume periods are only challenge on this one.
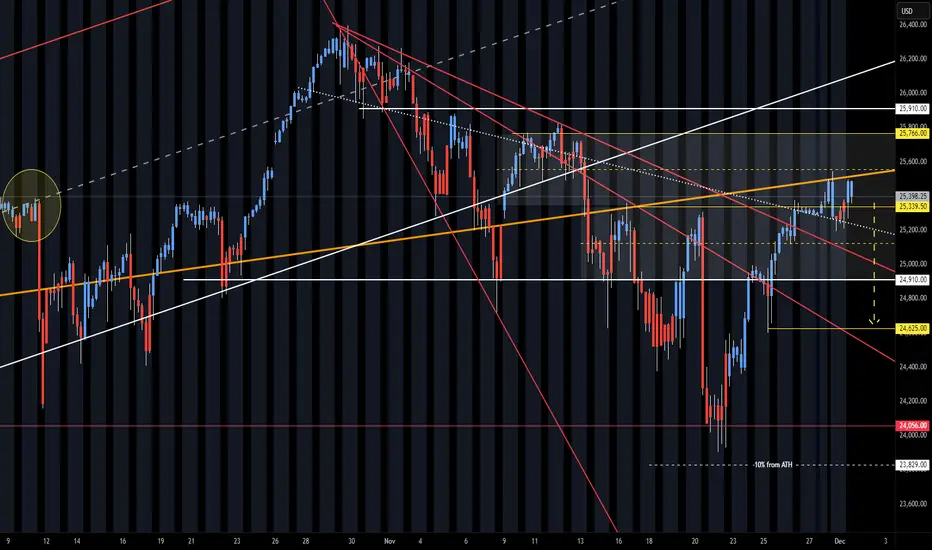
NasdaQ BiasDAILY CHART
1. Expecting lower prices if we stay below that balanced price range just above the 50% level.
2. If the balanced price range fails to hold price the market might look to explore that in the last premium quadrant and possibly all time highs.

NQ Range (12-01-25)NAZ lower in O/N and inside wide Churn Zone, look Long above 25339 and Short below 25,125. May see opposite direction trades at these levels and some sideways churn until breakout. Look at 1,000 point range of 25,910 - 24,910 as a wider CZ range.

NQ UpdateOdd that MFI went up on no movement
At this point, I'm mostly cash. My favorite long play was GM calls, and that looks topped out.
Not sure about NQ, but I think ES will double top, so no put options for now. I did think about buying GM puts but decided not to.
NQ 25,155: Heavy-Volume Resistance + FVG Short SetupNQ is forming a strong resistance at 25,155, sitting at the start of a heavy-volume zone created during a sharp selloff. This is where sellers previously built short positions and are likely to defend again. A bearish Fair Value Gap aligns perfectly with the same level, strengthening the zone. A pul

NQ1! – Bearish Descending Channel, Short Setup Active Nasdaq 100 futures remain trapped inside a bearish descending channel on the 4H chart after failing to reclaim the 25,500 zone.
Key points: Series of lower highs along the blue upper trendline
Strong rejection every time price touches the channel top
Support cluster 25,000–24,800 tested multipl

NASDAQ 100: Bullish! Look For Valid Buys With The Trend!Welcome back to the Weekly Forex Forecast for the week of Dec. 1-5th.
In this video, we will analyze the following FX market: NASDAQ (NQ1!) NAS100
The NASDAQ closed last week strong. It would indicated the potential for follow through going into this week, at least early.
Bear in mind that the p

FVG Reversal Play – NASDAQ 100 Futures [NQ1!]CME_MINI:NQ1! FVG Reversal Play – NASDAQ 100 Futures
Signal: 🟢 BUY
Entry: 25,106.00TP1: 25,327.75TP2: 25,376.00TP3: 25,500.00SL: 24,924.50
Insights:
Price retraced into a Fair Value Gap (FVG) and sits near the 0.618–0.705 Fibonacci cluster, aligning with high-volume nodes on VRVP.
RSI is rec
See all ideas
Summarizing what the indicators are suggesting.
Neutral
SellBuy
Strong sellStrong buy
Strong sellSellNeutralBuyStrong buy
Neutral
SellBuy
Strong sellStrong buy
Strong sellSellNeutralBuyStrong buy
Neutral
SellBuy
Strong sellStrong buy
Strong sellSellNeutralBuyStrong buy
A representation of what an asset is worth today and what the market thinks it will be worth in the future.
Displays a symbol's price movements over previous years to identify recurring trends.
Frequently Asked Questions
The current price of NASDAQ-100 FUTURES (Dec 2026) is 26,238 TWD — it has risen 0.57% in the past 24 hours. Watch NASDAQ-100 FUTURES (Dec 2026) price in more detail on the chart.
Track more important stats on the NASDAQ-100 FUTURES (Dec 2026) chart.
The nearest expiration date for NASDAQ-100 FUTURES (Dec 2026) is Dec 18, 2026.
Traders prefer to sell futures contracts when they've already made money on the investment, but still have plenty of time left before the expiration date. Thus, many consider it a good option to sell NASDAQ-100 FUTURES (Dec 2026) before Dec 18, 2026.
Open interest is the number of contracts held by traders in active positions — they're not closed or expired. For NASDAQ-100 FUTURES (Dec 2026) this number is 0.00. You can use it to track a prevailing market trend and adjust your own strategy: declining open interest for NASDAQ-100 FUTURES (Dec 2026) shows that traders are closing their positions, which means a weakening trend.
Buying or selling futures contracts depends on many factors: season, underlying commodity, your own trading strategy. So mostly it's up to you, but if you look for some certain calculations to take into account, you can study technical analysis for NASDAQ-100 FUTURES (Dec 2026). Today its technical rating is buy, but remember that market conditions change all the time, so it's always crucial to do your own research. See more of NASDAQ-100 FUTURES (Dec 2026) technicals for a more comprehensive analysis.