NQTargets are above unless price respects this demand and continues moving up. After price reaches a target, wait for confirmation on the lower timeframes — that’s what will tell you whether price will continue or not. You don’t predict; you react to each zone.
Trade ideas

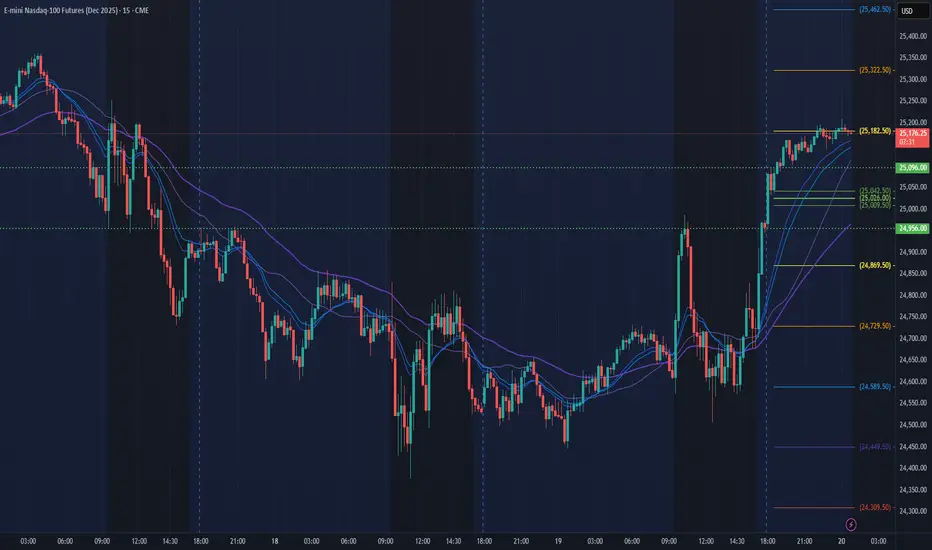
NQ Power Range Report with FIB Ext - 11/20/2025 SessionCME_MINI:NQZ2025
- PR High: 25110.75
- PR Low: 24955.50
- NZ Spread: 211.5
Key scheduled economic events:
08:30 | Philadelphia Fed Manufacturing Index
10:00 | Existing Home Sales
Session Open Stats (As of 12:15 AM)
- Session Open ATR: 478.35
- Volume: 49K
- Open Int: 292K
- Trend Grade: Long
- From BA ATH: -4.6% (Rounded)
Key Levels (Rounded - Think of these as ranges)
- Long: 26636
- Mid: 25410
- Short: 24039
Keep in mind this is not speculation or a prediction. Only a report of the Power Range with Fib extensions for target hunting. Do your DD! You determine your risk tolerance. You are fully capable of making your own decisions.
BA: Back Adjusted
BuZ/BeZ: Bull Zone / Bear Zone
NZ: Neutral Zone
NQ UpdatePretty much the same as ES.
Since I didn't buy any calls this afternoon, I'm probably just staying out for now. No point in chasing a 1.5% futures pump.

NQ: 285th trading session - recapI'm back now, haven't scalped in a while since my gf decided to break things up which really messed me up. I'm trying to get my stuff together and start over with scalping after a longer break. One of the first days of me actually being able to have a sort of normal session lmao
Garrett Ball Spelling Garrett with two t doesn't make sense. We really need to sweep the t out of his name


"Tiny Bubbles"Don Ho 1966
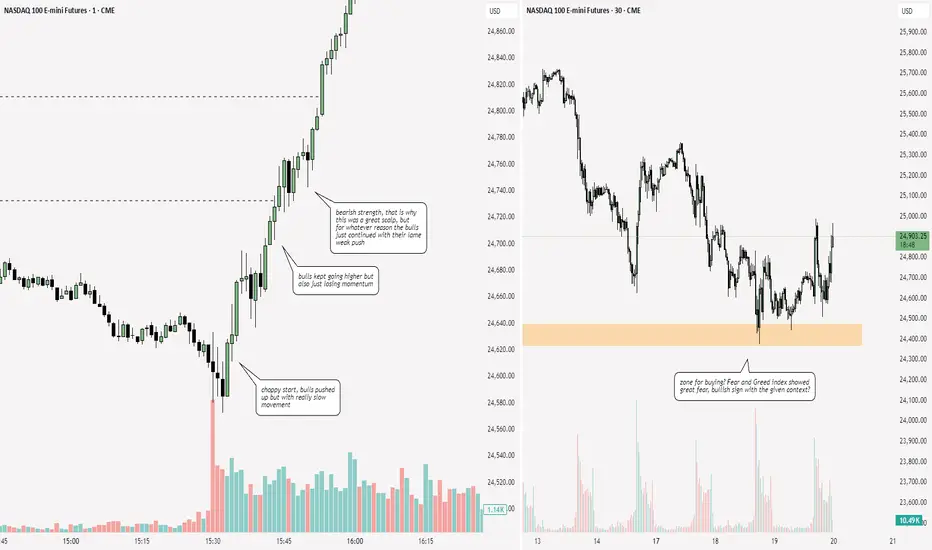
Setup
6.3% moderate pull back
Px coil atop strong support
Breakout trade just above 09:30 close
09:30 5m candle big volume
Don't think this is a bubble. Just a normal pull back.
All fundamentals remain strong.
His entries
+4 @ 24640; target: 24659
+4 @ 24660; target: 24679
+4 @ 24680; target: 24699
+4 @ 24700; target: 24719
+4 @ 24720; target: 24739
This was a really good setup, so he used +4 for first five entries. He very seldom does 5 trades in a row of +4. That tells you how good this setup was. 24740 is a bit of resistance so he switched to +3 entries.
From here to 24840, the next resistance, he bot +3 in 20-point increments with corresponding 19-point targets.
From here to 24940, the next resistance, +2 in 20-point increments with corresponding 19-point increments.
From here on +1 in 20-point increments same 19-point target.

Diabolical trading could frustrate you if you let it, in hindsight the play was right at the off when the bodies were respecting that very first OB+


bullish move in the makingusing trendline trading strategy time-frame analysis its clear that a bullish move is about to happen. As always money management is key and trading is risky. This is not a financial advice.

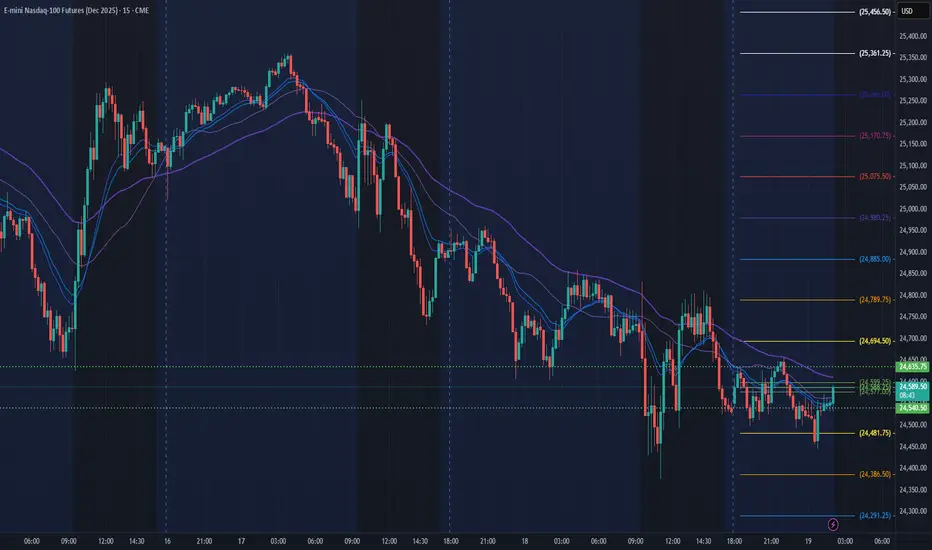
NQ Power Range Report with FIB Ext - 11/19/2025 SessionCME_MINI:NQZ2025
- PR High: 24635.25
- PR Low: 24540.75
- NZ Spread: 211.5
Key scheduled economic events:
14:00 | FOMC Meeting Minutes
Session Open Stats (As of 12:35 AM)
- Session Open ATR: 468.50
- Volume: 51K
- Open Int: 295K
- Trend Grade: Long
- From BA ATH: -6.9% (Rounded)
Key Levels (Rounded - Think of these as ranges)
- Long: 26636
- Mid: 25410
- Short: 24039
Keep in mind this is not speculation or a prediction. Only a report of the Power Range with Fib extensions for target hunting. Do your DD! You determine your risk tolerance. You are fully capable of making your own decisions.
BA: Back Adjusted
BuZ/BeZ: Bull Zone / Bear Zone
NZ: Neutral Zone
NQ1! 1H Chart – Bearish Channel + Hidden DivergencePrice is moving within a descending channel on the 1-hour chart. A hidden bearish divergence is confirmed on the stochastic oscillator, aligning with the channel structure.
System-based short setup using EMA 100 structure and divergence logic.

Do You Know Bitcoin and Nasdaq Have a 92% Correlation?* Most traders still believe Bitcoin and the Nasdaq 100 belong to two different worlds — one is “digital currency,” the other is “US tech stocks.”
- But in reality, Bitcoin and Nasdaq have nearly 92% positive correlation (based on past +10 years data).
The current market movements are showing signs of a market crash on the way...........
- See for arounf past 10 years, Bitcoin stayed above the tech index.
- It was the month of Nov only in 2015, when Bitcoin crossed above Nasdaq on the chart
After 10 straight years - Its 2025 & the month of November itself
- And Bitcoin has slipped below Nasdaq, forming its first bearish crossover in a decade.
This is a major shift.
- When a long-term leader loses momentum, it often signals deeper structural weakness — not only for Bitcoin, but for the entire risk-on ecosystem.
- Remember, Nasdaq & Bitcoin has over a 92% correlation
- And US tech industry is brewing a bubble somewhere - where the epicenter lies in the AI sector
A crash in one will sink the other with it
Checkout the chart (Nasdaq Futures & Bitcoin Weekly)

# /Nq trend #nasdaq - neutral to bearishNasdaq is trading at the crucial levels major support held at 2430 zone. if this level breaks then bearish momentum with broader sell off heading towards weekly correction. key levels to watch mentioned below.
resistance: 24800,24950, 25200-240
support: 24380 -2440 , 23845,23100

$NQ1! End of Year Prediction! Based off of the recent price action:
I understand that this is a Bank Run.
These take profits will be kiddy-backed by short margin and whence upon each institution reaches their desired "Share Weight", there will be a resultant Gamma Squeeze.
The rules are simple in these situations:
"Sell before our friends sell on us."
"First Out Wins, Last Out Loses."
This is basically just purely panic from High Executives of Financial Firms Reading the Room.
Don't worry about it, Buy the Dip when they Cover Up.
I expect some covering to begin around 23875 beeps, with the Lion's Share targeting a cover around 23050 - 23350.
Beware we can also fail out of this Broadening Descending Wedge (Bullish Structure although the price zig zags downwards in corrective mode)
In that case, you might want to target around 15800-16700 for fun.
Enjoy and Happy Trading!
Mr. Storm

Sizing down after a lossTook a 1% loss, then took a 2nd trade for a 0.5% win, so i can go back to risking 1% now.

NQ1/Nasdaq Daily Trade SetupsIn this update we review the recent price action in the e-mini Nasdaq futures and identify the next high-probability trading opportunities and price objectives to target. To review today's video analysis, click here!

NQ - ShortNQ Short
Day close red, forming a C2 candle - confirmed by a 1hr change in state of delivery - anticipating short from 1hr FVG - only if proper C2 and C3 candles form.

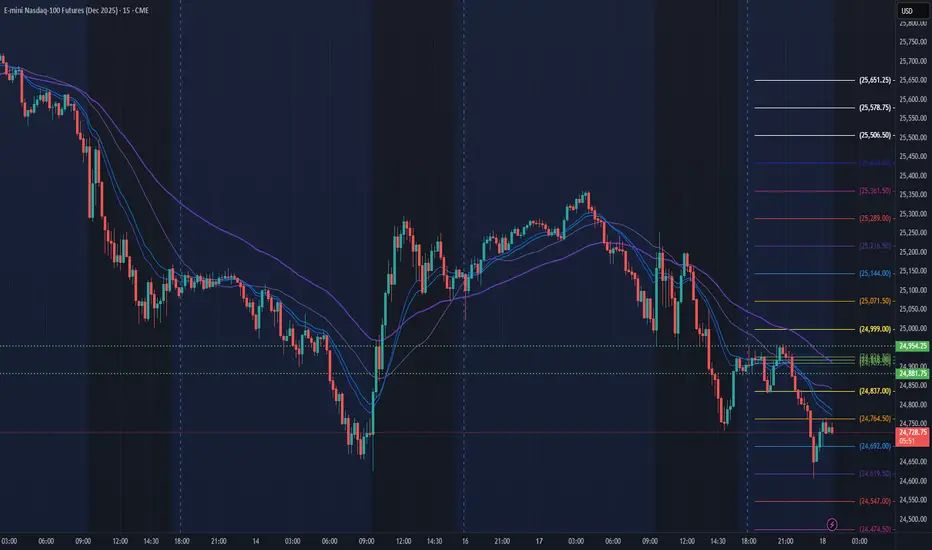
NQ Power Range Report with FIB Ext - 11/18/2025 SessionCME_MINI:NQZ2025
- PR High: 24954.50
- PR Low: 24882.00
- NZ Spread: 162.25
No key scheduled economic events
Session Open Stats (As of 12:35 AM)
- Session Open ATR: 475.50
- Volume: 67K
- Open Int: 291K
- Trend Grade: Long
- From BA ATH: -6.3% (Rounded)
Key Levels (Rounded - Think of these as ranges)
- Long: 26636
- Mid: 25410
- Short: 24039
Keep in mind this is not speculation or a prediction. Only a report of the Power Range with Fib extensions for target hunting. Do your DD! You determine your risk tolerance. You are fully capable of making your own decisions.
BA: Back Adjusted
BuZ/BeZ: Bull Zone / Bear Zone
NZ: Neutral Zone
NQ Daily Outlook | November 18, 20251H timeframe — 50 EMA (black) for trend, 5 & 10 EMAs (white) for momentum/BOS.
Quick read: Still under the 50 EMA after a bounce. Whites are curled down; structure is lower‑high/lower‑low.
Two scenarios I’m watching
Bearish trend (favored): Stay under the whites and reject the 50 → print BOS down → ride impulse down, sell pops into the whites.
Bullish trend: Reclaim the whites, push and hold over the 50 → print BOS up → impulse > shallow correction > continuation higher.
Bias: Leaning bearish while we’re below the 50 with no upside BOS. I flip long only after we clear a lower high and hold above the 50 EMA.

Tuesday NQ looks good for big trades againIn following the HTF on previous post. If downside is going to continue, we have these 2 options for today.
1st is the 80% trade to fill yesterday's open VA, which keeps us inside the area of not invalidating the downside trade. With the way Vol has been, it will probably happen overnight, and we will miss the upside. For the downside the .5 entry with TP at .25 being a must to protect profit from another bounce out of the support zone. Hold runners and hope this is the time we crack it. Prefer this way of breaking the support.
2nd is the pdVAL holds us down, and we break through the support. If this happens, prefer it happens around RTH open. Otherwise, safer to wait for a solid closes below that level to not get trapped.
Top of fib pull invalidates.

Buried Treasure MapPicture Buy the Dip areas as not so hidden pirate treasure.
Here is one of this trader's favorite BTD setups. A bounce:
1.In a green shaded BTD area aka accumulation/distribution area
2.Exhaustion Candle: 5m chart, 10:05 candle
3.White bullish candle,10:10 candle
4.@ prior day's close
5.@ prior vpoc
6.Double Bottom
7.9:30 White Tail with bigger than usual volume
8.As you can see, the more supports the better chance of success.
His Buy the Dip Trade Plan
1.Buy 1 MNQ contract @ top of BTD area 25145
2.Buy 1 MNQ contract every 5 points - 25140, 25135, 25130... all the way down to the low of the BTD area 25070.
3.21-point target per entry
4.No stop loss
5.If some entries fx and the 21-point exit doesn't, he simply holds until it does. Ultimately, in this bull market, nearly all hit their targets.
His goal is five a day. Somedays he gets none. Somedays twenty or more. This year he has far exceeded that goal.
On a good setup like the one above you will find that nearly 100% will be round trips - meaning they will hit their profit targets.
Make it your own. Buy 1 every 10 points. If you want to buy the most successful zone of the BTD area, divide the area into thirds and buy only the middle third. Caveat: that middle third is simply his experience. It is not a result of a scientific study. Perhaps someone more skilled with such a study will do a back test and provide us with the results. If you want to use a stop by all means use one.
Always be careful. Sometimes the Px will continue to fall. Always save dry powder for that event because it does happen. The above setup is far less likely to fall than others.
Always trade with an ear to the news. News events can and do turn markets.
Most importantly of all - use your good common sense.

Macro trade again, trading view laggingA buy of 20 points, which worked but tradingview didn't put it on.
