Saham PTBA: Tunggu Sinyal lenkap dgn 5 Peluru📊 Stock Analysis of PTBA Bukit Asam Tbk. using Profitmore Trade™'s 5 Bullets Strategy:
🔹 1. Zero Line
🔹 2. AO Divergence
🔹 3. SQUAT
🔹 4. Fractal
🔹 5. Momentum
🔍 Market Segmentation Analysis:
📅 Monthly: Even segment
📅 Weekly: 8 even segments (Monthly timeframe)
📅 Daily: Corrective eve
Next report date
—
Report period
—
EPS estimate
—
Revenue estimate
—
0.01 EUR
305.67 M EUR
2.56 B EUR
3.92 B
About PT Bukit Asam Tbk
Sector
Industry
CEO
Arsal Ismail
Website
Headquarters
Jakarta
Founded
1981
ISIN
ID1000094006
FIGI
BBG00FGWWCY9
PT Bukit Asam Tbk engages in the business of coal mining activities. It operates through the Coal and Other segments. The Coal segment includes general research activities, exploration, exploitation, processing, refining, transportation, trading, and maintenance of special coal dock facilities. The Other segment focuses on mining services, briquette processing, palm plantation, palm processing, and health services. The company was founded on March 2, 1981 and is headquartered in Jakarta, Indonesia.
Related stocks

The analysis of PTBARSI showing that it on reversal stage and same goes to MACD showing us that is a good momentum for buying. I created big resistance due to the gap and used fib retracement to make sure the gap is valid. Prepare your money for "Menyerok" this stocks guys

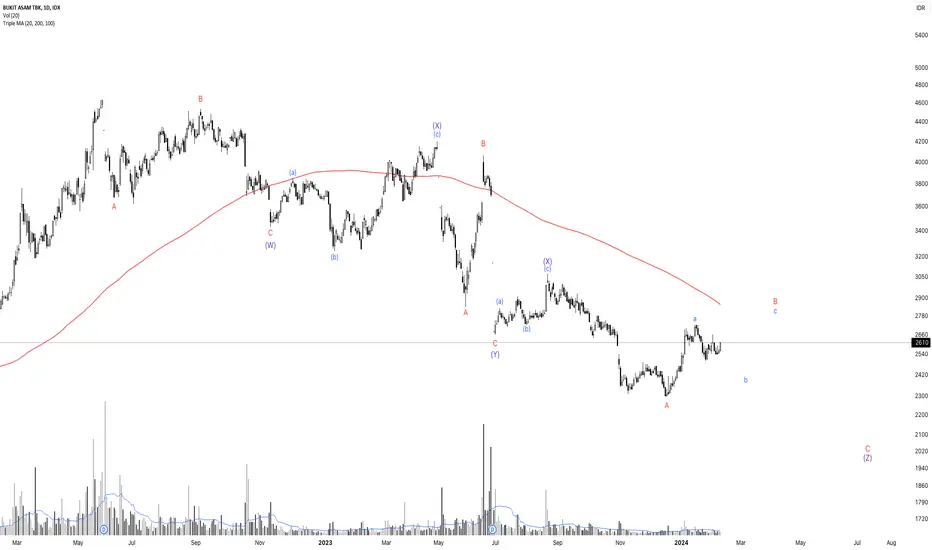
PTBA Elliott Wave Count Scenario 2In this scenario, we are also on the (b) wave of the (X) wave. I expect PTBA to drop again for a bit.
The 200-day MA could offer a strong resistance for the (c) wave. It could poke through, but I think its gonna continue to the downside afterwards.

PTBA Elliott Wave Count Scenario 1I believe we are in the B wave of the latest ABC correction to the upside. I'll post my other slightly different scenario than this one.
Please do share your ideas if you count any different from what I did. Thanks

Buy IfHave some planning for this
1. Wait for breakout fib618
2. Averaging 2x, start from fib05 area and the second start from fib382 area
This analysis just made for education purpose only
Trade with your decision
DisclaimerOn

PTBA in Retest ⚠️⚠️⚠️PTBA . Daily TF. Rising wedge pattern. Has broke the trendline support and go to the retest area (support that become resistance). Be carefull. It might do down if it rejected. Or if it enter the wedge area again and breakout the wedge, it is become bullish and cancel the bearish.


PTBATechnical Analysis is the forecasting of future financial price movements based on an examination of past price movements. Like weather forecasting, technical analysis does not result in absolute predictions about the future.

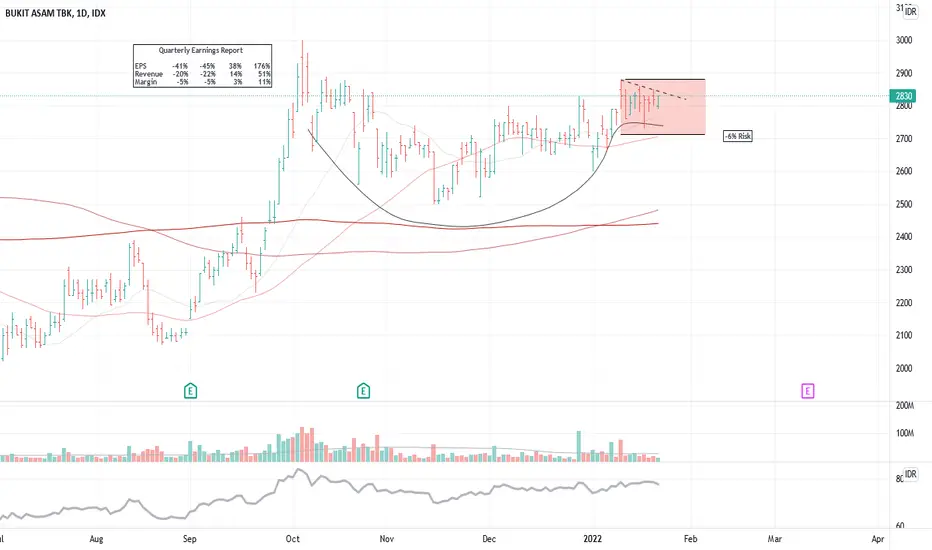
PTBA - CUP WITH HANDLESetting up a Cup with handle, the stock develops its handle area.
The fundamentals are outstanding, I like to see a break out very soon, I am watching this closely now.
See all ideas
Summarizing what the indicators are suggesting.
Neutral
SellBuy
Strong sellStrong buy
Strong sellSellNeutralBuyStrong buy
Neutral
SellBuy
Strong sellStrong buy
Strong sellSellNeutralBuyStrong buy
Neutral
SellBuy
Strong sellStrong buy
Strong sellSellNeutralBuyStrong buy
An aggregate view of professional's ratings.
Neutral
SellBuy
Strong sellStrong buy
Strong sellSellNeutralBuyStrong buy
Neutral
SellBuy
Strong sellStrong buy
Strong sellSellNeutralBuyStrong buy
Neutral
SellBuy
Strong sellStrong buy
Strong sellSellNeutralBuyStrong buy
Displays a symbol's price movements over previous years to identify recurring trends.
Frequently Asked Questions
The current price of TBA is 0.11 EUR — it hasn't changed in the past 24 hours. Watch PT Bukit Asam Tbk stock price performance more closely on the chart.
Depending on the exchange, the stock ticker may vary. For instance, on GETTEX exchange PT Bukit Asam Tbk stocks are traded under the ticker TBA.
TBA stock has risen by 22.73% compared to the previous week, the month change is a 23.85% rise, over the last year PT Bukit Asam Tbk has showed a −27.33% decrease.
We've gathered analysts' opinions on PT Bukit Asam Tbk future price: according to them, TBA price has a max estimate of 0.14 EUR and a min estimate of 0.08 EUR. Watch TBA chart and read a more detailed PT Bukit Asam Tbk stock forecast: see what analysts think of PT Bukit Asam Tbk and suggest that you do with its stocks.
TBA stock is 23.85% volatile and has beta coefficient of 0.50. Track PT Bukit Asam Tbk stock price on the chart and check out the list of the most volatile stocks — is PT Bukit Asam Tbk there?
Today PT Bukit Asam Tbk has the market capitalization of 1.43 B, it has increased by 3.52% over the last week.
Yes, you can track PT Bukit Asam Tbk financials in yearly and quarterly reports right on TradingView.
PT Bukit Asam Tbk is going to release the next earnings report on Mar 9, 2026. Keep track of upcoming events with our Earnings Calendar.
TBA net income for the last quarter is 28.68 M EUR, while the quarter before that showed 23.24 M EUR of net income which accounts for 23.42% change. Track more PT Bukit Asam Tbk financial stats to get the full picture.
Yes, TBA dividends are paid annually. The last dividend per share was 0.02 EUR. As of today, Dividend Yield (TTM)% is 13.91%. Tracking PT Bukit Asam Tbk dividends might help you take more informed decisions.
PT Bukit Asam Tbk dividend yield was 12.09% in 2024, and payout ratio reached 74.96%. The year before the numbers were 16.30% and 74.82% correspondingly. See high-dividend stocks and find more opportunities for your portfolio.
As of Nov 11, 2025, the company has 1.68 K employees. See our rating of the largest employees — is PT Bukit Asam Tbk on this list?
EBITDA measures a company's operating performance, its growth signifies an improvement in the efficiency of a company. PT Bukit Asam Tbk EBITDA is 276.48 M EUR, and current EBITDA margin is 17.08%. See more stats in PT Bukit Asam Tbk financial statements.
Like other stocks, TBA shares are traded on stock exchanges, e.g. Nasdaq, Nyse, Euronext, and the easiest way to buy them is through an online stock broker. To do this, you need to open an account and follow a broker's procedures, then start trading. You can trade PT Bukit Asam Tbk stock right from TradingView charts — choose your broker and connect to your account.
Investing in stocks requires a comprehensive research: you should carefully study all the available data, e.g. company's financials, related news, and its technical analysis. So PT Bukit Asam Tbk technincal analysis shows the sell today, and its 1 week rating is strong sell. Since market conditions are prone to changes, it's worth looking a bit further into the future — according to the 1 month rating PT Bukit Asam Tbk stock shows the strong sell signal. See more of PT Bukit Asam Tbk technicals for a more comprehensive analysis.
If you're still not sure, try looking for inspiration in our curated watchlists.
If you're still not sure, try looking for inspiration in our curated watchlists.