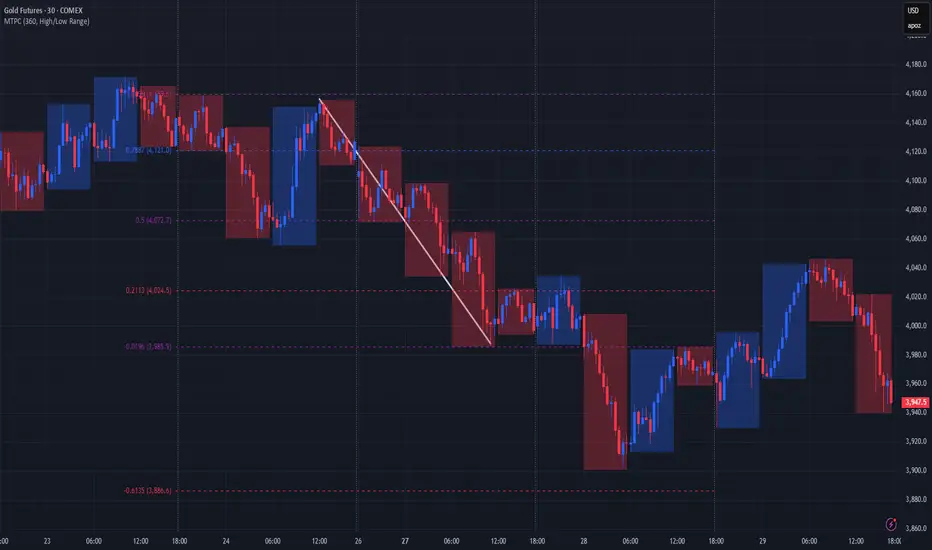
A better alternative to Fibonacci grid🙏🏻 Fibonacci based grid is a great inspiration from the Universe, but imo ain’t the final product, and here it is:
For traders
Use these values above and put em into grid tool here, and you’ll end up with uniform distribution based grid:
1.6134612334371357
1.0196152422706632
0.7886751345948129
0.5
0.21132486540518708
-0.019615242270663247
-0.6134612334371357
Then about how to apply it, you can divide trading activity by analytical units, these are in turn are based on:
^^ by price
^^ by time
^^ by signed volume waves/volume delta
Explanation
If you’ve followed my latest work you know I’ve identified a way to combine higher order moments to construct natural data driven estimates of data’s extremums and “ever possible” values (I still got no idea how no1 Ever posted it anywhere over the last centuries).
Now imagine you got only 2 input values: actual max and min (just like in Fibo grid, it ain’t knows nothing else). Given only these 2 values we can model stuff with uniform distribution that has precisely known values of standardized moments, so we end up with (and remember that uniform distro is symmetric around its mid, so all odd moments are zero):
dev = 1 / math.sqrt(12) //standard deviation
kurt = 1.8 //kurtosis (not excess ofc, the raw one)
hkurt = 27 / 7 //hyperkurtosis, 6th moment, raw af as well
0.5 + dev * hkurt
0.5 + dev * kurt
0.5 + dev
0.5
0.5 - dev
0.5 - dev * kurt
0.5 - dev * hkurt
And the resulting output of it u seen at the beginning of the post, notice how the edges *almost* match your lovely golden ratio.
For wanderers:
Now for the wanderers, creators etc etc etc
We might have a new math constant in our hands.
This can’t be a coincidence that limit levels (the ones at the edges) almost match the golden ratio . What if we find some kind of ‘almost’ uniform distro, where the limit levels would ‘exactly’ match the golden ratio? No problem - Beta distribution with parameters alpha = beta = (smth just a bit greater than 1).
I solved it numerically in python with mpmath library (necessary for high precision stuff, default packages are gonna truncate too much and we work with gamma functions there, high powers, huge numbers).
The following constant used as both parameters for Beta distribution provides us an almost uniform beautiful distro, with a minimal necessary deviation from uniform distro if u pls, just with a lil bit gently smoothed corners, and all connected to fibonacci sequence and golden ratio:
1.013156499304251804283836146883597463164059088989506487984660881392552993230097518061037104047261922219476043198153474114525730243848097530913517155085537693517359999905511951459927003624291626547046737804828112785002512650…
… and it goes on and on. I called it Sagitta constant, because visually it creates that beautiful almost flat shape, the minimal natural curvature. And now if we put this as c in Beta(c, c) following the same levels construction method from before we get these levels:
std = 0.28741741
K = 1.80628205
Hk = 3.88993123
0.5 + std * hk = 1.61803398
0.5 + std * k = 1.01915692
0.5 + std = 0.78741741
0.5 = 0.5
0.5 - std = 0.21258258
0.5 - std * k = -0.01915692
0.5 - std * hk = -0.61803398
Visuals, plots, graphics
^^ here you can see how our resulting distro & derivatives look like, kinda cute aye?
Beta(c, c), where c is our constant Sagitta, actually might be a natural prior for Bayesian stuff, almost a boxcar windowing function for DSP so u gonna tame that famous spectral leakage, or a kernel for KDE, like u name it, every case when u need a uniform shape yet with slightly relaxed endpoints, you can use it in design and architecture.
Go for it bros, test it in your R&D. Maybe some1 gonna use it to prove Riemann assumption conjecture , if u get dat milli send me 25% ima find a good use for it.
∞
Trade ideas
gold to go another leg or two lower? 3800 or 3650gold achieves measured move just outside of timed zone from head and shoulders setup, retests bottom of initial shoulder, and returns to measured down move looking to break 3900 support down to 3800.
if downward momentum continues look for 3650 as solid support from an old upward trend line and parallel channel.

gold head and shoulders setuplooking like a target of $3940 for gold if head and shoulders pattern triggers

GC Futures – Are We Flipping Bearish Into Midweek?Tuesday closed below Monday’s low, hinting at a potential shift in sentiment.
Currently, price is approaching a 1H FVG inside the prior Asian range, just below the Weekly Low (W-L) and Daily High (D-H) — a perfect liquidity pocket.
I’m watching for signs of rejection here to confirm a bearish continuation. If price holds above this area, we may see a short squeeze back into higher value.
Bias remains bearish, but confirmation is key.
What are you seeing here — are we setting up for continuation or a fakeout?
#Gold #Futures #GC #DayTrading #SmartMoney #OrderFlow #ICT #NoFOMO

The reveral candle cannot be ignoredReversal candle on massive volume could be indication that the big money is exiting quietly. This along with the recent subtle strength moving into the treasuries and the consistent over exuberance of the market says it time for a sell off in gold.

Gold Near 4k: Mean-Reversion Short — Watch 3,985–4,015Timeframe: 15m • 30m • 1h
Symbol: COMEX_MINI:MGC1!
Current Read (MTF)
15m (lead): Drives turns. Watching for rejection wicks into 3,985–4,015 ; momentum rolling under guides.
30m (confirm): Capped by MA cluster ~ 4,002 ; sellers defending sub-4k. A 30m close above 4,030 changes the script.
1h (context): Lower-highs intact until 4k+ is reclaimed with closes.
Plans From Here
Fade a pop (preferred): Re-sell 3,985–4,015 on wick/rejection.
Stops: 4,032 (tight, better R:R) or 4,038 (safer vs quick sweep above 4,030/4,035).
Breakdown → retest: Lose/close below 3,960 , sell the underside retest (≈3,960–3,965) toward 3,930 , then 3,900 .
Flip long if invalidated: 30m acceptance > 4,030 opens 4,078 → 4,152; look for pullback buys into 4,015/4,030.
Levels I’m Trading
Supply/short zone: 3,985–4,015
Invalidation for shorts: 4,030 (30m close)
Downside magnets: TP1 3,960 • TP2 3,930 • TP3 3,900
Indicator Cheatsheet
15m & 30m lead the higher TFs. I act on 15m, confirm with 30m.
Bottom panel colors: Red = sell pressure , Green = buy pressure , Yellow = potential reversal .
Buy/Sell signals: Highest weight when they line up with the 3,985–4,015 zone or the 3,960 breakdown/retest.
Plan: let 15m/30m lead. Fade into 3,985–4,015 unless we accept above 4,030; otherwise trade breakdown–retests toward 3,930/3,900. Not financial advice — manage your own risk.
COMEX_MINI:MGC1!

GOLD: Bullish, But Retracing! Short Term Sell Opportunity!In this Weekly Market Forecast, we will analyze the Gold (XAUUSD) for the week of Oct. 27 - 31st.
Gold is still bullish, the current pullback it's in notwithstanding. Waiting patiently for valid buy setups is the sure way to go.
That being said, there is sell setup that could present an short-term opportunity. The Daily -FVG is currently holding price in check. Should price return to it and it continues to hold, a valid sell opportunity could present itself.
Be careful, as it is counter-trend. They can be lower-probability.
Enjoy!
May profits be upon you.
Leave any questions or comments in the comment section.
I appreciate any feedback from my viewers!
Like and/or subscribe if you want more accurate analysis.
Thank you so much!
Disclaimer:
I do not provide personal investment advice and I am not a qualified licensed investment advisor.
All information found here, including any ideas, opinions, views, predictions, forecasts, commentaries, suggestions, expressed or implied herein, are for informational, entertainment or educational purposes only and should not be construed as personal investment advice. While the information provided is believed to be accurate, it may include errors or inaccuracies.
I will not and cannot be held liable for any actions you take as a result of anything you read here.
Conduct your own due diligence, or consult a licensed financial advisor or broker before making any and all investment decisions. Any investments, trades, speculations, or decisions made on the basis of any information found on this channel, expressed or implied herein, are committed at your own risk, financial or otherwise.

Short the Pop Near Intraday Highs — Gold Dec ’25Timeframe: 30m with 15m confluence
Symbol: COMEX_MINI:MGC1!
Thesis
Price pushed into a confluence resistance area and printed rejection. I’m positioned short from ~ 3,980 , looking for a fade back toward mid/low-day supports unless we accept above the resistance shelf.
Confluence (15m + 30m)
Tag of the prior intraday high / supply shelf around 3,985–4,015 .
MA cluster overhead on the 30m near ~ 4,002 ; 15m shows momentum roll + rejection wicks after the push.
Lower-high structure maintained; guide line curling down with momentum dots flipping bearish after the probe.
Key Levels
Short/Supply Zone: 3,985–4,015
My Entry: ~3,980 (15m rejection confirmation)
Invalidation: 4,030 on a 30-min close (acceptance above = short thesis off)
Downside Targets: TP1 3,960 • TP2 3,930 • TP3 3,900
Trade Plan
Aggressive Adds (if re-test): Scale 3,985–4,015 on wick/rejection.
Stops: 4,032 (tighter, better R:R) or 4,038 (safer vs quick stop sweep above 4,030/4,035).
Management from my 3,980 entry:
TP1 3,960 → move stop to BE
TP2 3,930
TP3 3,900 → trail above successive lower highs
What I’m Watching
Rejection tells on 5–15m (upper wicks, bearish engulfing) under the MA cluster
Momentum divergence into 3,985–4,015
Mean-reversion fade into layered resistance with defined invalidation. I’ll take partials quickly and let a runner try for deeper levels. Not financial advice — manage your own risk. Written using ChatGPT

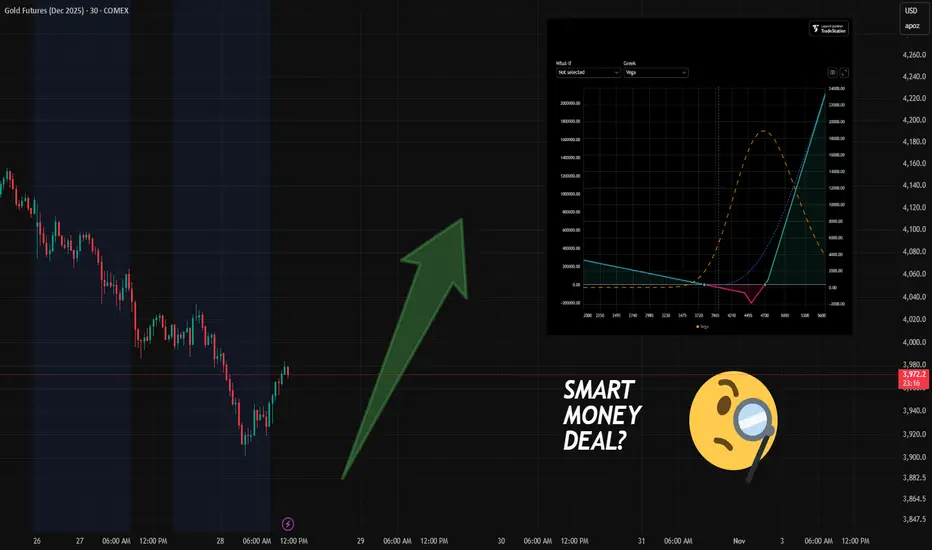
Quiet in FX Options — But Gold Is Heating Up
Over the past 24 hours, major currency options saw little of interest.
In contrast, precious metals — especially Gold — are attracting serious attention.
Let’s break down the key developments:
🔹 Observation #1: A New Bullish (But Hedged) Portfolio Appears
(See risk profile on screenshot.)
A new SMART option portfolio has entered the market:
Bullish bias, but with a built-in hedge — which reduces its predictive value.
If price drops below $3,800, the portfolio starts generating profit for its owner (via the hedge).
Built on the February 2025 futures contract, under an option series expiring in December 2025.
📌 Yes, it sounds confusing — and it is.
Option series expire, but futures live on.
This creates what we call "expiry risk" — a topic for another deep-dive article.
🔹 Observation #2: Put Activity at 3900 (Dec Series)
There’s growing activity in puts at the 3900 strike — moderate bullish positioning or support.
The bullish structure is hedged — not a pure directional bet.
Bearish positioning remains active.
Price has not yet shown signs of moving toward the main long setup.
I’d recommend at least 2–7 days of observation before considering any reversal trades.
📌 And here's why:
It’s rare for price to move immediately toward the target of a large, long-dated portfolio.
More often, there’s a delay of several days — especially when expiry is still far out.
Watch the flow.
Trade only when the edge is clear.
May the data-driven approach be with you!
GC (Gold Futures): Towards $3900?This is MGC chart.
Current Market Situation
The chart shows MGC trading around $4,000 with a bearish outlook projected through the end of the week.
What We're Seeing
Price Movement:
- Price is trapped in a descending channel (purple trendlines)
- Currently attempting to push up near the $4,000 resistance zone
- Overall trend still shows downward pressure
This Week's Forecast:
- Tuesday (today): Might bounce up first, attempting a rally toward upper channel resistance
- Wednesday-Friday: Expected to reverse sharply and decline due to high impact news.
- Target: Down to $3,900 by end of week
Key Levels to Watch
- Resistance: $4,008-$4,010 (current area)
- Support: $3,900 (primary target), $3,868 (secondary support)
- Upper purple trendline acts as dynamic resistance
Bottom Line
This setup anticipates a "bull trap" scenario - a brief rally that fails at resistance before resuming the downtrend. The trader expects gold to drop approximately $100+ over the next few days, staying within the descending channel pattern.
Risk Warning: If price breaks decisively above the upper purple trendline with strong volume, this bearish scenario would be invalidated and the trend could reverse bullish.

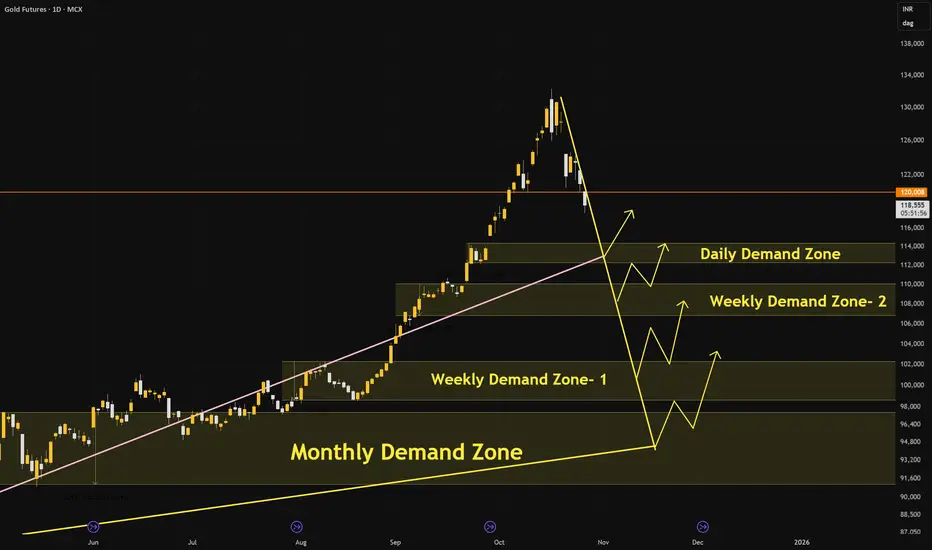
A Case Study: GOLD probable price ProjectionA Spectacular and exponential price movement was observed in GOLD for last 3 months.
A Mega BullRun is witnessed in the bullion market across the globe. Gold is considered as the best among multi asset classes. Especially in Indian subcontinent Gold is not only considered as precious metal which holds a greater value but also very auspicious .
Now lets dive deep into its price movement based on Demand Zone Concept.Accordingly how can we position ourselves to get most out of it.
Case1: Daily Demand Zone (DDZ)
If Price reaches Daily Demand Zone then there is high probability of accumulation is observed by market players. and if the price is considered as fair then it may move up. here we can see buying reaction.
Case 2: Weeekly Demand Zone (WDZ)
If price reaches Weekly Demand zone then some more accumulation occurs and then price moves up.
Now the question arises that if we see good buying at daily demand zone then why should price reach weekly demand zone. to understand this i explained briefly about different market players in the follwing link.
How perfectly market players defend their positions is clearly seen in this chart . Please go through it.
WDZ 1 & WDZ 2:
These are the zones where gold was accumulated.
Case 3: Monthly Demand Zone (MDZ)
If ever price reaches this zone it shall be a good level to invest .
Note : price movement may not be as swift as it was in last 3 months.
GOLD - Sell off when u see a crowd entering - always workingGOLD - Sell off when u see a crowd entering - always working
New that in Argentina people buying al ot of phisical GOLD was a perfect signal of retail FOMO
$3400 isa key support

Gold Sitting on the Edge – Liquidity Sweep Before the Bounce?Monday didn’t give much movement, and price is now hovering around last week’s low.
I’m expecting a liquidity sweep of the current levels — likely taking out the Daily Low before moving to fill the full Weekly FVG below.
Short-term bias is bearish for the Asian session, but I’ll be watching closely for a shift once that FVG is filled.
If absorption shows up after the sweep, I’ll flip long for the bigger move higher into midweek.
#FuturesTrading #Gold #ICT #LiquiditySweep #NOFOMO

Buy Entry Model Key Points Summary
Market is still in a downtrend, but a pullback is in progress.
Lower supply zone around 4,050 is currently holding resistance.
Strong demand zone around 3,975 is your main downside target.
Trade setup shows a short position respecting supply-demand structure.
Confirmation of continued bearishness would come from a break below 3,990.
A break above 4,075 would invalidate the short and suggest potential shift in momentum.

GC Gold UpdateI shifted my overlay a bit because gold took the dip earlier than expected. Probably gets a pump from the rate cut later this week. It's also flashing my buy indicator.
If I go long, it'll probably just be a few call contracts, definitely not going all in like last time.

Expecting the worst. Hoping for the best.We have an engulfing candle on the monthly. Definitely a bearish candle on the weekly in the past weeklies. It only had known the first of the year. To put everything in the gold. I would be 2x richer. Than I was. Than I am. Brace for the pullback. Short GDX late if you want to. It always lags. Zoom out. Check out the 15 Minute check it all. It's not looking good.

Understanding Margin & Mechanics in Futures MarketsBefore you trade Futures, it’s essential to understand how these markets operate, especially how margin, leverage, and settlement work. This insight helps you manage risk, stay capital-efficient, and avoid unnecessary surprises.
Margin Basics
Every future position requires margin. It’s important to note margin is not an added cost per contract, margin is a good-faith deposit or can be thought of as a “performance bond” to ensure you can meet your obligations. There are three main types:
Initial Margin: The exchange sets this as a percentage of the contract’s notional value based on a wide variety of factors including volatility, size of the contract, and average market movement.
Maintenance Margin: The minimum balance required to keep your position open. If your balance drops below this, you’ll get a margin call.
Day Trading Margin: Set by your broker, often a fraction of the exchanges Initial Margin. Day Trading margins can provide more leverage, but in turn this comes with more risk.
Leverage in Action
Futures are leveraged products. With just a small amount of capital, you can control a much larger position. For example, with the E-mini S&P 500 trading at 6800, one contract has a notional value of $50 x 6800 = $340,000. We illustrate this below using initial margin and day margins examples.
Leverage using Initial Margin:
Leverage = Notional Value / Initial margin required
Example:
For 1 Long ES contract, with initial margin $23429.
Leverage = 340,000 /23429
Leverage = 14.5x
Leverage using Day Trading Margin:
Leverage = Notional Value / Day margin required
For 1 Long ES contract, with day margin at $1000.
Leverage = 340,000/1000
Leverage = 340x
**As the notional value rises or falls, so does leverage. Leverage is a double-edged sword it can work for you and against you. Higher leverage increases the risk of gains as well as losses.
Depending on your margin, you might only need a few thousand dollars to take that trade. While this enhances your buying power, it also increases risk, as losses could exceed your initial deposit.
Mark-to-Market & Daily Settlements
Futures are marked to market daily. This means your P&L is updated at the end of each session based on the day’s closing price. Gains are credited to your account, and losses are debited, helping to ensure real-time risk management and capital adequacy.
Physical vs. Cash Settlement
When a contract expires, there are two possible outcomes:
Physical Delivery: You receive or deliver the actual commodity.
Example: An oil producer secures a price of $62.00 per barrel through a long futures position. At contract expiration, the producer is obligated to take delivery of 1,000 barrels, which represents $62,000 in total value. If market prices rise to $80.00 per barrel, the producer can sell the physical oil at an $18.00 per barrel gain (before accounting for commissions and futures and other related fees).
Cash Settlement: No goods change hands, and your account is adjusted based on the final settlement price set by the exchange. This is common in financial contracts like the E-mini S&P 500 (ES).
Understanding margin and leverage is fundamental to trading futures effectively. These mechanics define how much risk you’re taking, how your capital is allocated, and how your account is managed daily.
At EdgeClear, our mission is to help traders develop a deeper understanding of the markets and the tools that move them. Follow us on TradingView for more Trade Ideas like this one, or connect with our team to learn how you can trade futures with confidence, precision, and the right guidance.

The markets are overbought and I am looking for them to go lowerSunday the 26th and I'd like to talk about gold and silver and the market in general since it is oversold an equities and gold and silver can go lower but it doesn't necessarily mean the end of gold and silver. In the video I show why gold could go lower and to me it's a function of markets expanding and contracting if gold makes a new high I would expect for it to correct and that's not bad and it's not the end of gold and silver. If you're listening to my stuff you want to look at the market as having buyers and sellers and you need to know where they are within reason and you should be thinking in terms of patterns.

Gold might retest broken upside trendGold might retest broken upside trend Which will push it down near 4000 support as a first target. If broken will take the price further down to 3800

GC UpdateIf gold was done, silver would have flat out tanked instead of going sideways.
Overlayed the last flat, expanded to the last ramp up. We're gonna see sideways movement until teh Fed decides on even more rate cuts and end to QT. Then we're headed to over 5k.
You'll know if it's happening if it sets a new high. All previous tanks did not set a new high before tanking.

Can Gold Rival ATHs?Early last week, we finally saw the much anticipated correction on Gold. This move was likely a liquidation event, shaking out a wave of over-leveraged long positions that had built up during the prior rally.
On the 4H timeframe, price consolidated and accumulated for most of the week following that flush, suggesting that the market may now be rebuilding liquidity for its next major leg.
With weak hands cleared and positioning reset, Gold could now be preparing to retest its ATHs and possibly break into new territory if momentum and fundamentals align.

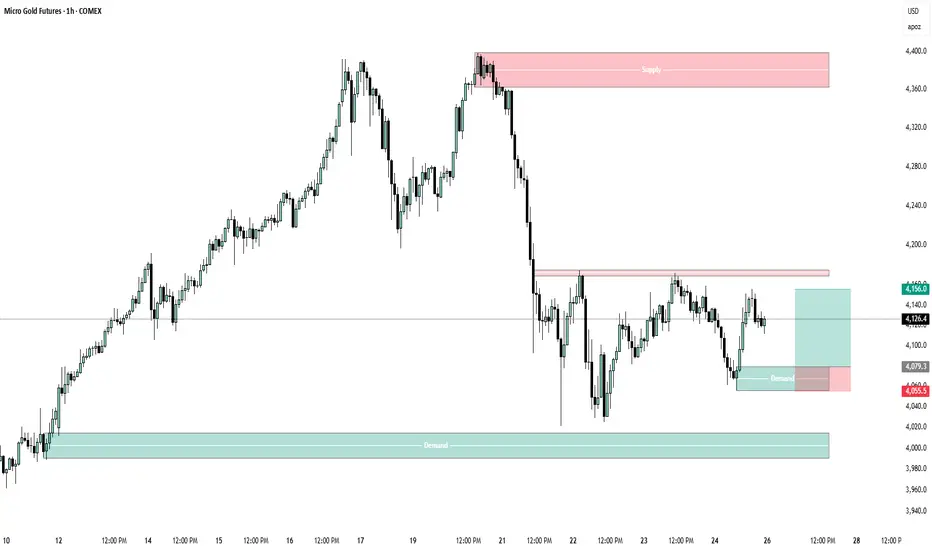
short term bias Buy Entry Model🔴 Supply Zones (Potential Short Entry Areas)
Major Supply: 4,360 – 4,400
Origin of the strong sell-off.
Clean imbalance and strong bearish move afterward.
If price retraces back here, it’s a high-probability short zone.
Entry idea:
Sell: 4,370–4,390
Stop: Above 4,410
Target 1: 4,080 (first demand zone)
Target 2: 3,980 (lower demand zone)
Minor Supply: 4,165 – 4,180
This is a recent reaction zone that rejected price.
Can be used for scalping or short-term intraday short setups if price retests.
Sell: 4,165–4,175
Stop: Above 4,190
Target: 4,080 (nearest demand)
🟢 Demand Zones (Potential Long Entry Areas)
Near-Term Demand: 4,050 – 4,080
The most recent rally base before price bounced higher.
Price has respected this area already once, showing buyers stepping in.
Entry idea:
Buy: 4,060–4,080
Stop: Below 4,040
Target: 4,160 (supply)
R:R ≈ 1:2
Major Demand: 3,970 – 4,010
Strong base formed before the previous impulsive move upward.
If price breaks below 4,050, this would be the next strong long zone.
Buy: 3,980–4,000
Stop: Below 3,950
Target 1: 4,080
Target 2: 4,170
📊 Overall Bias
Short-term bias: Neutral to slightly bullish within the range (4,050–4,160).
Medium-term bias: Bearish while below 4,360 (major supply).
Expect possible range trading between 4,050 and 4,160 before a breakout.
A break below 4,050 could send price toward the 3,970 demand zone.
A break above 4,180 could lead to a retest of the 4,360 supply.