All Time Highs for Precious MetalsGold and Silver are continuing to show resilience today leading the precious metals higher to new all time high prices. Looking at the Gold market, today marks 5 consecutive days with a higher all-time high and a higher low, and Silver has had 4 consecutive days with a higher high and higher low, which is rare to see at elevated prices for these markets. There was some significant data released looking at JOLTs, which was the lowest reported number since Match of 2021 which led Gold and Silver to both see positive gains again today. Along with that, there is an expected nonfarm payrolls report and an unemployment rate coming out Friday, and the nonfarm payrolls number is expected at 74k, which is the lowest expected number since February of 2021.
Equity markets battled back and forth today and the S&P and Nasdaq were able to finish the day positive with a strong upside move into the close. With the equities trading near all time high prices, there will be a lot of attention on the economic data for the rest of the week looking at jobs and employment. The CME Fed Watch Tool also saw slight shifts over the past 2 days and now are pricing in a 25-basis point rate cut for the September and October meeting. These figures have been changing rapidly, and traders will get more clarity once we hear from Powell after the September meeting in a few weeks.
If you have futures in your trading portfolio, you can check out on CME Group data plans available that suit your trading needs tradingview.com/cme/
*CME Group futures are not suitable for all investors and involve the risk of loss. Copyright © 2023 CME Group Inc.
**All examples in this report are hypothetical interpretations of situations and are used for explanation purposes only. The views in this report reflect solely those of the author and not necessarily those of CME Group or its affiliated institutions. This report and the information herein should not be considered investment advice or the results of actual market experience.
GF1! trade ideas
Basic Trading Marking up Support and Resistance In this lesson, I walk through the basics of how I mark support and resistance levels on my charts. These key zones highlight areas where price has reacted multiple times, creating strong consolidation. Within these zones, there’s often opportunity to capture moves as the market ranges and builds momentum. By identifying these levels, traders can better anticipate entries, manage risk, and find room to profit inside the zone before price makes its next breakout or reversal.

Gold Lags Behind SilverGold lags behind silver. I’m referring to silver’s percentage gains outpacing gold, not suggesting that silver is becoming more expensive than gold. Investors and traders focus on percentage gains, whereas consumers buying jewelry make decisions based on how much it’ll actually cost them.
Last year, silver’s 60% gain outpaced gold’s 40%, and year-to-date, silver has once again outperformed gold with a 52% gain compared to gold’s 36%.
Micro Silver Futures
Ticker: SIL
Minimum fluctuation:
0.005 per troy ounce = $5.00
Disclaimer:
• What presented here is not a recommendation, please consult your licensed broker.
• Our mission is to create lateral thinking skills for every investor and trader, knowing when to take a calculated risk with market uncertainty and a bolder risk when opportunity arises.
CME Real-time Market Data help identify trading set-ups in real-time and express my market views. If you have futures in your trading portfolio, you can check out on CME Group data plans available that suit your trading needs www.tradingview.com

return to support provides bullish entry 1->3 : creates higher high and number 2
as dominant buyers
3->4 : return to buyers
what next ?
* uptrend and return to proven support
* obv is uptrend showing buying interest
* mfi and rsi is hidden bull+oversold on both
*waiting micro bull pattern for entry

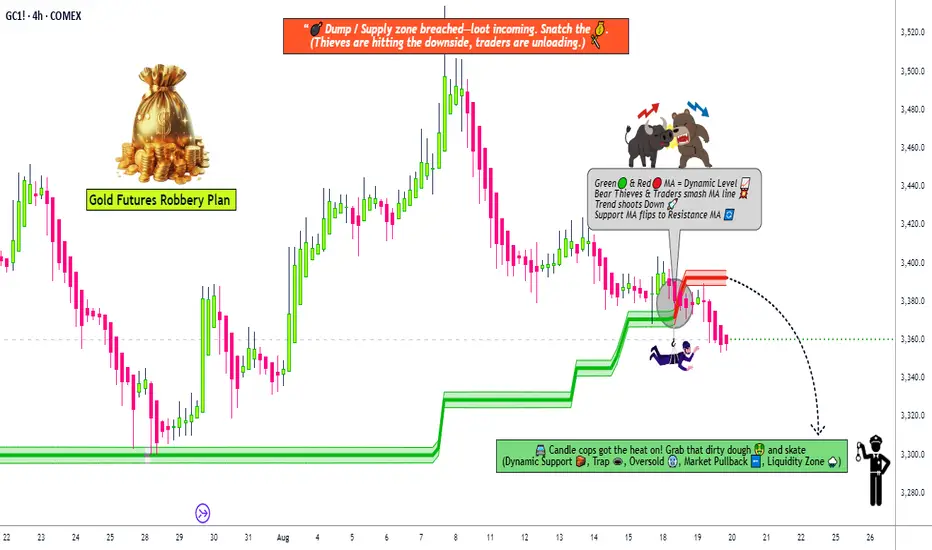
GC1! Thief Trader Mission – Short Gold, Grab the Loot🚨💰 Thief Trader Gold Heist Plan – GC1! "The Gold" Metal Market 🎭🔒
🌟Hey Robbers & Money Makers!🌟
Welcome back to another OG Thief Trader Robbery Plan — today we’re targeting the shining vault of GC1! "The Gold".
This time, the mission is BEARISH. The vault doors are heavy, but with layered sell entries, we’re breaking in! 💣💸
📜 The Plan (Swing/Day Trade)
Entry 🏴☠️: Any price level — but real thieves don’t rush! Use layered sell limit entries like a pro:
🔹 3360.0
🔹 3370.0
🔹 3380.0
(Add more layers if you’re greedy enough 👀💰)
Stop Loss 🛑: Thief SL @ 3400.0 (but remember, OG’s — adjust your SL with your own risk appetite & strategy).
Target 🎯: Police barricade spotted near 3300.0 — our final escape point is 3310.0. Grab the gold & run before the cops catch you 🚔💨.
📊 Thief Strategy 🕵️♂️
We don’t enter with just one order — layering strategy is the art of the heist. Multiple entries = multiple chances to loot the market. Scalpers & swingers both welcome to join this robbery.
📰 Thief’s Outlook (Gold Market Status)
Trend: Bearish bias 🐻
Setup: Short the rallies 🔥
Sentiment: Overloaded bulls = perfect robbery target 🎯
Fundamentals & Macros: Inflation heat & policy shifts keeping gold shaky ⚖️
⚠️ Robbery Warning 🚨
Avoid getting trapped during major news releases 📢.
Protect your loot with trailing stops 🛡️.
Never risk your whole bag on one entry — spread it thief-style.
💖 Support the crew! 💖
Follow, like, and share this heist plan with your robbery gang 🤝. The more OG’s we got, the bigger the score 💎💰.
See you after the escape, thieves — with pockets full & smiles wide 🏆🤑🐱👤
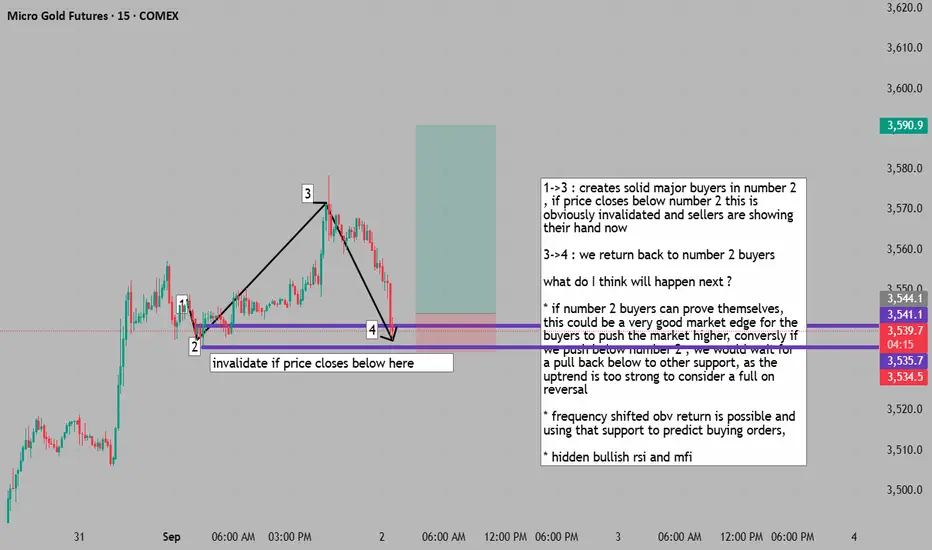
gold is at a decision point to continue upward or retrace furthe1->3 : creates solid major buyers in number 2 , if price closes below number 2 this is obviously invalidated and sellers are showing their hand now
3->4 : we return back to number 2 buyers
what do I think will happen next ?
* if number 2 buyers can prove themselves, this could be a very good market edge for the buyers to push the market higher, conversly if we push below number 2 , we would wait for a pull back below to other support, as the uptrend is too strong to consider a full on reversal
* frequency shifted obv return is possible and using that support to predict buying orders,
* hidden bullish rsi and mfi
Sell PositionWe have a break in the 15 minute Candl at 11 o’clock New York time I’m going to sell is the price Reach the top TP at the Fair value gap

New Highs For Gold Or Perfect Opportunity for Reversal Gold (GC1!) Is Poised to set New Highs, as We've seen Gold (GC1) reach its highest Point in history and shows no intentions of Slowing Down. Gold May Start off Strong with high liquidity This Monday, This could be the lowest we get to see gold Prices For a long time and late investor may want to get in before we take off. all I know is this will be a fierce battle as 'Bears' may use this opportunity to enter their positions the 'Bulls' will have to fight! if they really want it.

Gold (XAU/USD) Forex SignalGold (XAU/USD) has been showing strong bullish momentum recently, but the latest Zig Zag pattern and RSI (Relative Strength Index) suggest a potential correction in the short term. Let’s analyze and provide a clear forex trading signal.
Market Overview
| Pair | Gold (XAU/USD) |
| -------------- | ------------------------------- |
| Current Price | \$3,680.7 |
| Trend | Bullish with minor pullback |
| Key Indicators | Zig Zag (5,10), RSI (14, close) |
| Volatility | High |
| Market Session | US Session |
Technical Analysis
Zig Zag Indicator: The last leg shows a peak around **\$3,679.3** followed by a small correction, signaling possible short-term weakness.
RSI (14): Currently near the **55 level**, coming down from overbought territory (>70). This indicates the bullish rally may be slowing, and sellers could test the downside.
Support Levels: \$3,650 – \$3,620
Resistance Levels: \$3,720 – \$3,750
Gold Trading Signal (September 14, 2025)
| Signal Type | Sell (Short-term) |
| ------------- | --------------------- |
| Entry Zone | \$3,680 – \$3,690 |
| Stop Loss | \$3,720 |
| Take Profit 1 | \$3,650 |
| Take Profit 2 | \$3,620 |
Analysis: Since RSI has cooled off from overbought levels and Zig Zag shows a minor top formation, a short-term selling opportunity is expected. However, the long-term trend remains bullish, so aggressive traders may wait for dips to re-enter long positions.
Alternate Scenario
If gold breaks above \$3,720, the bearish setup becomes invalid, and bulls may drive the price toward \$3,750 – \$3,800.
FAQs on Gold Forex Signals
Q1: Is gold still a good buy in September 2025?
Yes, gold remains in a long-term uptrend, but short-term pullbacks are expected.
Q2: What is the best strategy for XAU/USD now?
Swing traders can short near resistance with tight SL, while long-term investors can buy on dips.
Q3: Which indicators are most useful for gold trading?
RSI, Zig Zag, Moving Averages, and Fibonacci retracements work well with gold volatility.
Conclusion
Gold (XAU/USD) is consolidating after a strong bullish move. Short-term traders can look for sell opportunities near \$3,680 with targets at \$3,650 – \$3,620, while long-term traders should stay bullish and buy dips.

Gold futures forcast Bullish continuation steps in?@GoldenZoneFX Follow me for more valuable content and insightful ideas.
"GC1 is in a compression phase following a bullish impulse. Decision zone lies between 3,585 and 3,716. A breakout with volume signals continuation; a rejection points to a return toward support levels. Clean structure—worth monitoring.
Risk is dynamic. Stay adaptive, stay protected.

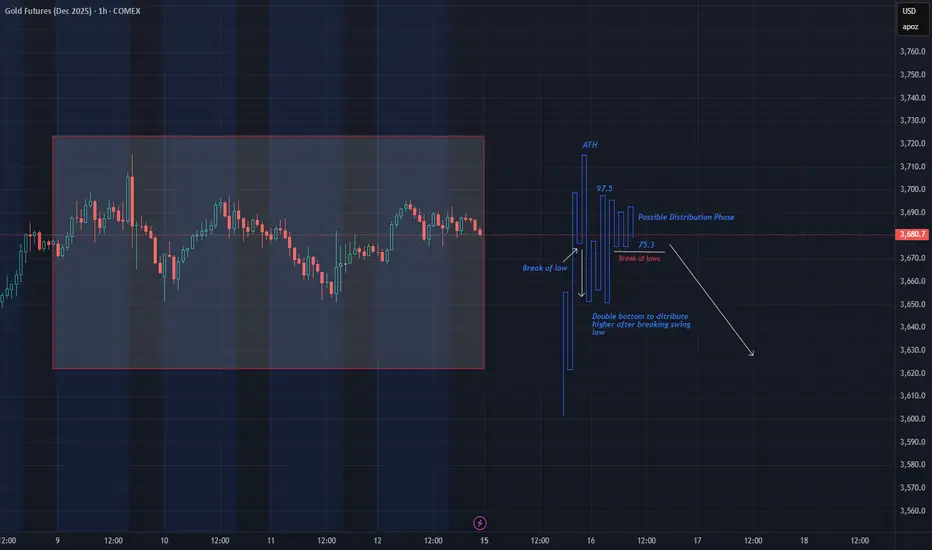
Possible distribution of Gold Futures - Hourly Swing ChartAfter reaching ATH we would have expected no hourly swings to break if it was to continue, however having a clear break of a swing low was a sign for the big players to sell out after moving market higher to distribute. It is a good idea to try to short the higer side of the distribution phase and if the high breaks go long or remain short should the lower end breaks.
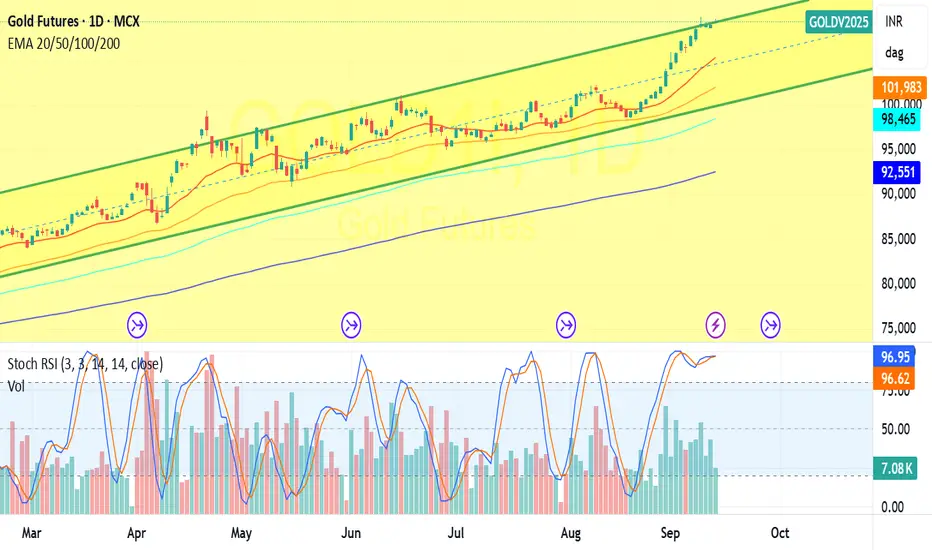
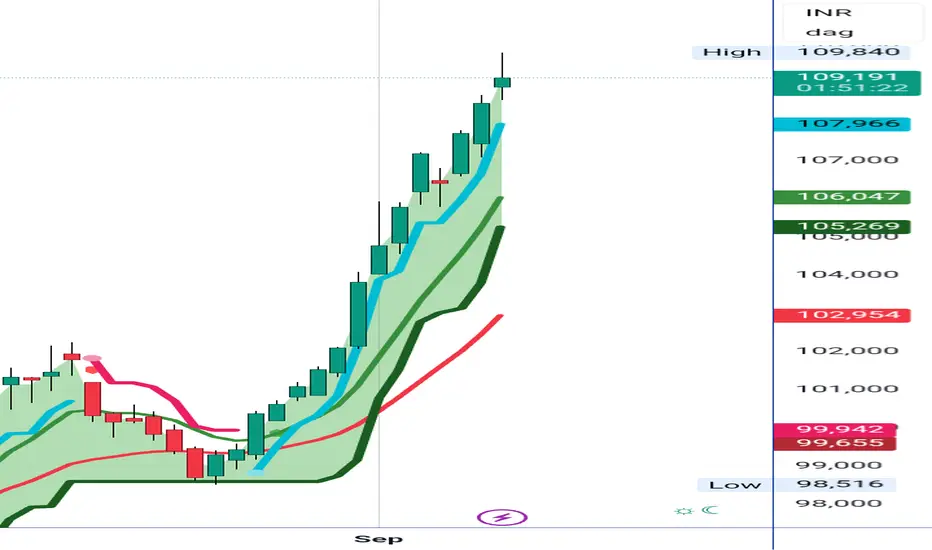
MCX GOLD;Trade Set up and TargetsKey levels
Immediate support (first line): ₹108,550
Lower support zone: ₹108,000 — if price closes below this, bearish pressure increases.
Near-term resistance zone: ₹109,440 — watch for rejections here.
Upper resistance / new-high trigger: ₹110,000 — daily close above this signals fresh bullish extension.
Psychological round: ₹111,000 (next larger objective if momentum continues)
(These are the horizontal lines on the chart and the levels I used to build targets.)
Technical read :
RSI(14) in my chart is in neutral-to-mildly-overbought area — watch for divergence or a close below 50 for weakening momentum.
Trade setups & targets
Bullish (momentum continuation)
Setup: Daily close above ₹110,000 (with follow-through volume / higher open next day).
Entry: on a clean daily close above 110,000 or a pullback to 109,400–109,600 that holds.
Targets: 1) ₹111,000 (first), 2) ₹112,400–₹113,000 (secondary extension).
Stop: below ₹108,900 (or tight intraday protective stop if entering on breakout).
Range / neutral (failure at resistance)
If price is rejected in the 109,400–110,000 zone: consider short with targets 108,550 then 108,000.
Stop: above 110,200 on a rejection scalp.
Bearish (momentum shift)
Trigger: daily close below ₹108,000 (sustained).
Short targets: 107,000 then 105,500.
Stop: above 108,800 (or recent EMA20).
Intraday scalp idea
Look for support/resistance confluence near 108,550 (buy if strong bounce and intraday momentum) or a quick rejection around 109,440–110,000 for a 200–500 point scalp, with tight stops.
Risk management & rules (short)
Risk no more than 1–2% of trading capital per trade.
Prefer daily closes for swing decisions; intraday trades need tighter stops.
Watch macro cues — US rates, USDINR and global gold (COMEX) often influence MCX moves.(For educational purpose only)
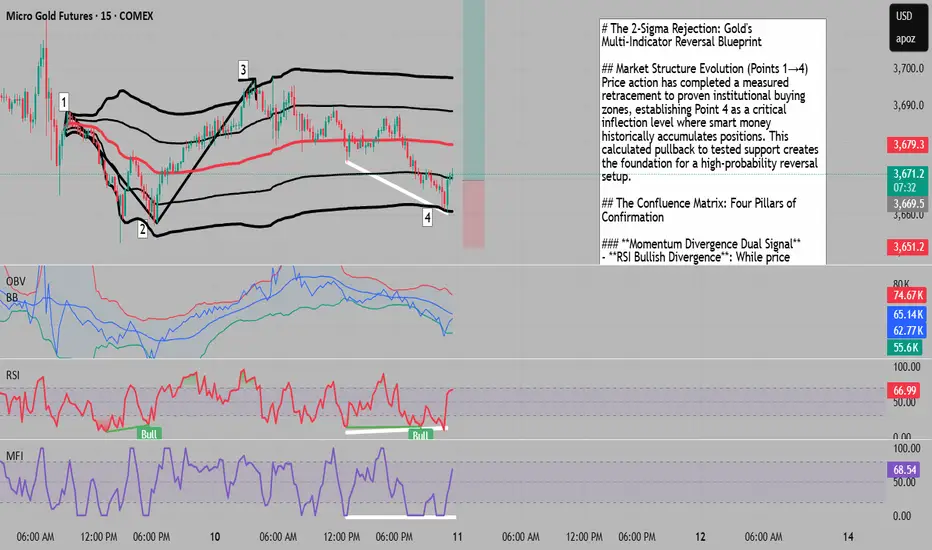
The 2-Sigma Rejection: Gold's Multi-Indicator Reversal Blueprint# The 2-Sigma Rejection: Gold's Multi-Indicator Reversal Blueprint
## Market Structure Evolution (Points 1→4)
Price action has completed a measured retracement to proven institutional buying zones, establishing Point 4 as a critical inflection level where smart money historically accumulates positions. This calculated pullback to tested support creates the foundation for a high-probability reversal setup.
## The Confluence Matrix: Four Pillars of Confirmation
### **Momentum Divergence Dual Signal**
- **RSI Bullish Divergence**: While price printed a lower low at Point 4, the Relative Strength Index formed a higher low, revealing underlying strength masked by price action
- **MFI Confirmation**: Money Flow Index mirrors the RSI divergence, indicating that capital flows are diverging positively from price - a signature of accumulation during apparent weakness
### **Bollinger Band Extremity Alignment**
- **Price at Lower Band**: Point 4 precisely tags the lower Bollinger Band, marking a statistically significant oversold extreme
- **OBV Breaking Below Its Lower Band**: A rare occurrence where On-Balance Volume pierces below its own Bollinger Band lower boundary - historically a powerful mean reversion signal that suggests panic selling into strong hands
### **The 2-Standard Deviation Rejection**
Using Point 1 as the VWAP anchor creates a statistically robust framework:
- Point 4 achieves a perfect touch and rejection from the 2nd standard deviation below VWAP
- This represents a 95% statistical extreme, where price typically finds aggressive buyers
- The rejection from this level confirms institutional algorithms are defending this mathematically significant zone
## Technical Synthesis
This setup presents a textbook convergence of statistical extremes and momentum divergences. The simultaneous occurrence of:
- Dual momentum divergences (RSI + MFI)
- Dual Bollinger Band extremes (Price + OBV)
- 2-sigma VWAP deviation test
Creates a rare "perfect storm" reversal setup where multiple independent indicators reach oversold extremes simultaneously.
## Probability Assessment
When price touches the lower Bollinger Band while OBV breaks below its own band, historical data suggests a >70% probability of mean reversion within 5-10 bars. Combined with the momentum divergences and VWAP deviation test, this creates an asymmetric risk-reward scenario favoring long positions.
## Risk Management Framework
- **Stop Loss**: Below Point 4 with buffer for volatility
- **Initial Target**: VWAP mean reversion (1st standard deviation)
- **Extended Target**: Upper Bollinger Band or Point 3 resistance
- **Invalidation**: Sustained break below 2nd VWAP deviation would negate the setup
## Key Takeaway
The convergence of statistical extremes across multiple non-correlated indicators at Point 4 creates a institutional-grade reversal setup. The 2-sigma VWAP rejection, combined with rare OBV Bollinger Band penetration and dual momentum divergences, presents a compelling mean reversion opportunity with clearly defined risk parameters.
Longing Goldyep, Longing Gold, i mean who would short it anyways.
Iam coming from a very long losing streak so that confirm the move and do your own analysis.
Also just so you know, there is a good chance that i will play out as analyzed, just do your own analysis and if both analysis matches, then take the trade.
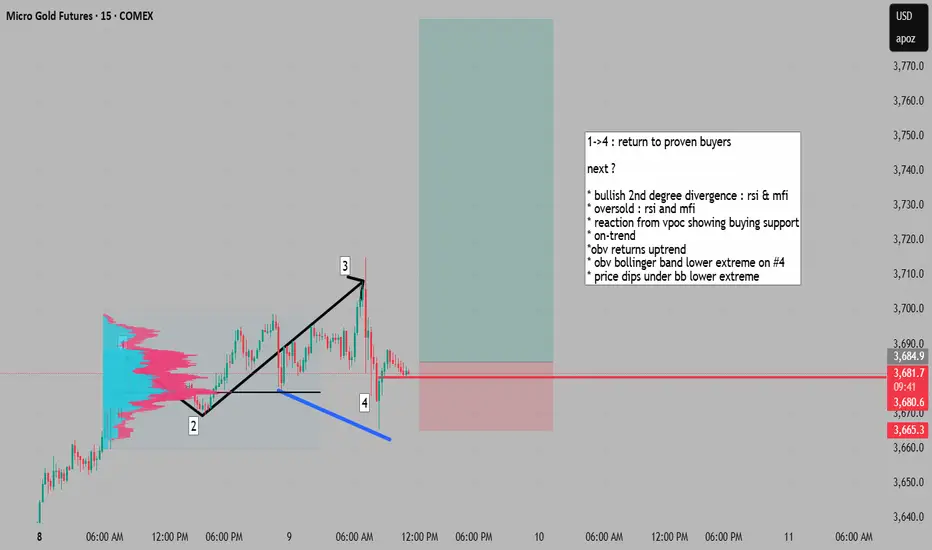
return to proven buyers presents entry at market edge on trend1->4 : return to proven buyers
next ?
* bullish 2nd degree divergence : rsi & mfi
* oversold : rsi and mfi
* reaction from vpoc showing buying support
* on-trend
*obv returns uptrend
* obv bollinger band lower extreme on #4
* price dips under bb lower extreme
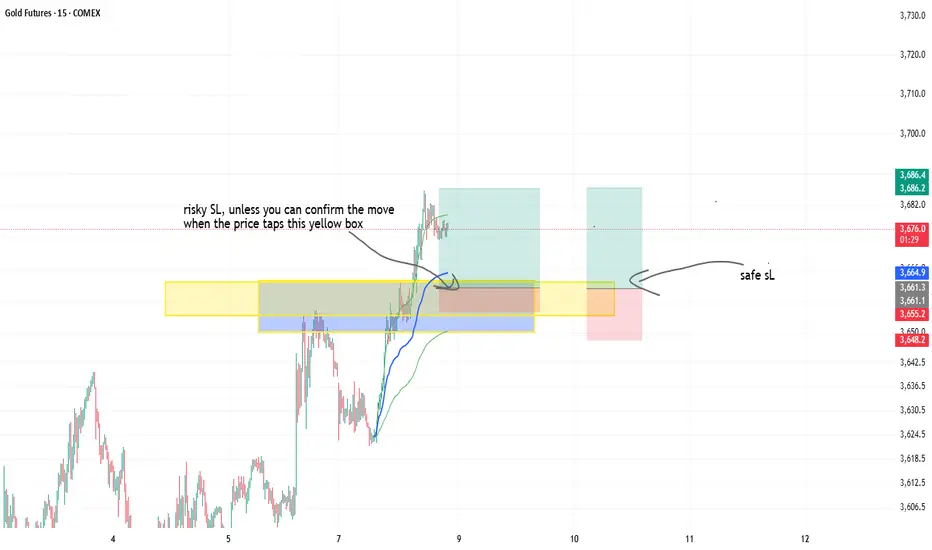
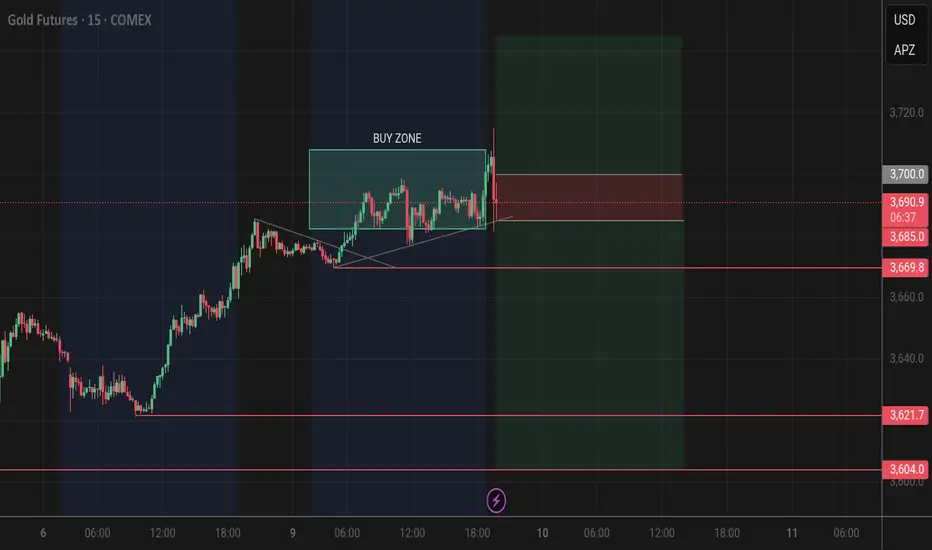
GOLD | Buy & Sell Setup | 09 Sep 2025 – 10:32 EDTGOLD | Buy & Sell Setup | 09 Sep 2025 – 10:32 EDT
Buy Zone: 3709 – 3682
Scenario 1 : Buy
Entry: 3700
Stop Loss: 3685
Targets:
TP1 → 3745 (1:3)
Analysis:
From Buy Zone (3709 – 3682) creates possibilities for a buy move.
Scenario 2 : Sell
Entry: 3685
Stop Loss: 3700
Targets:
TP1 → 3670
TP2 → 3621
TP2 → 3604
Analysis:
Below Buy Zone (3709 – 3682) creates possibilities for a sell move.
Stay alert on updates here.
⚠️ Disclaimer: This idea is shared for educational purposes only and should not be considered financial advice. Please do your own analysis before making trading decisions.
GOLD SHORT TERM VIEWWill look for shorts if we sweep the zone and get a selling confirmation on smaller TF. We can wait for MSS on 1 or 3min TF.

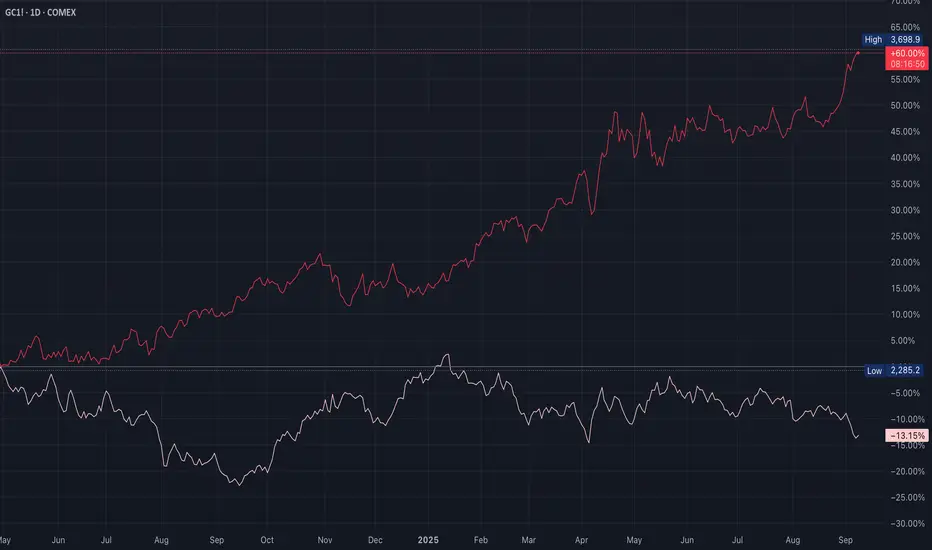
QQQ Macro Stress Gold ripping higher (+60% YoY)
Investors are hedging inflation risk, currency debasement, or policy uncertainty
Gold outperformance shows capital fleeing to “hard money” rather than growth assets
CRBS/US10Y above 8% + US10Y trending down is a classic stagflation warning
Economy faces cost pressures (gold pricing in inflation fears)
Bond market is saying “growth is slowing/policy will ease"
Commodities are saying “inflation pressures are rising"
That’s the exact recipe for stagflation - weak real growth, sticky/accelerating inflation
This is bearish-biased for QQQ unless CRBS/US10Y cools back below +8% because of multiple compression risk - growth narrative struggles if inflation is sticky while real growth is soft
Valuations pressured by elevated yields
No reflationary support from commodities
Historically underperform in stagflation regimes
This setup (gold vertical, CRBS/US10Y sinking) = stagflation hedge regime
QQQ continues higher if yields stabilize & capital rotation pauses (20%)
Possible if Fed pivots or inflation fears calm while liquidity remains strong
QQQ consolidates near highs (30%)
Yields + inflation fears cap upside, but strong AI/earnings narrative prevents a deep selloff
Most likely outcome (50%) is stagflation + sticky yields compress multiples (5%–10% correction risk)
CRBS/US10Y >8% while US10Y trends lower is one of the cleanest stagflation warning signals
For QQQ it usually shifts probabilities heavily toward correction
For gold/commodities it confirms continued strength
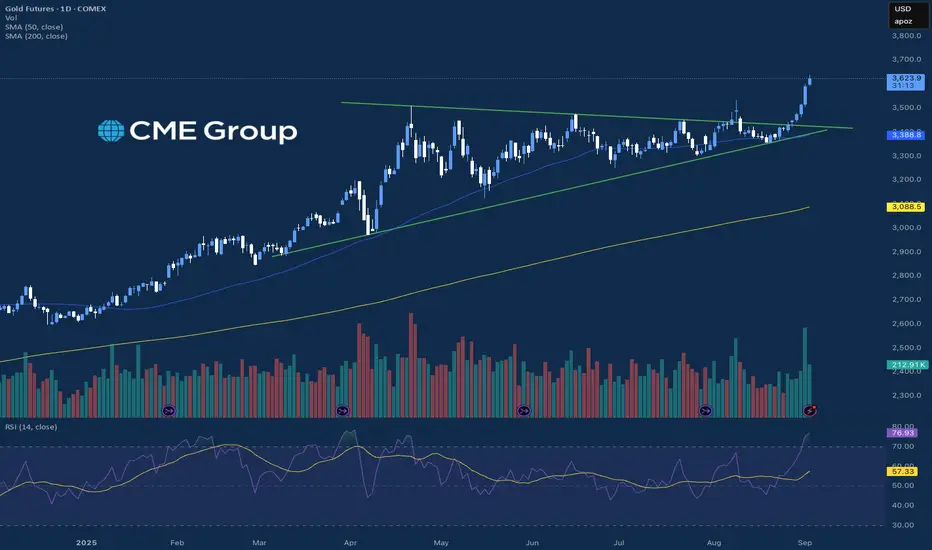
Gold Eyes $3,700 Amid Overbought SignalsGold broke out of a multi-month trading range when the spot price finally cleared resistance around $3,450. It took some time for the ascending triangle to play out, and this could mean gold is now on its way towards $3,700. However, the metal has quickly reached overbought levels and may be due for a pause.
Breaking Out
The breakout could be significant and may trigger a move to much higher levels over time; it just doesn’t mean it will all happen at once. One way to measure the breakout from the ascending triangle pattern suggests the precious metal could climb to about $3,700.
The relative strength index also confirms the breakout, rising above a downtrend that had formed between April and August. The rise above the trend line on the RSI confirms the breakout and signals that the consolidation period has ended.
Overbought
However, the precious metal did not take long to reach overbought levels, with its value rising above the upper Bollinger Band and the relative strength index climbing over 70. This could mean that gold is due for a pause—a period of sideways consolidation—before moving on to higher prices.
It could also suggest that the metal is about to run out of steam, having expended too much energy breaking out of the consolidation range, and may be due for a sharp pullback to $3,440 to retest the breakout, or even a decline towards the lower Bollinger Band near $3,200.
Written by Michael J. Kramer, founder of Mott Capital Management.
Disclaimer: CMC Markets is an execution-only service provider. The material (whether or not it states any opinions) is for general information purposes only and does not take into account your personal circumstances or objectives. Nothing in this material is (or should be considered to be) financial, investment or other advice on which reliance should be placed.
No opinion given in the material constitutes a recommendation by CMC Markets or the author that any particular investment, security, transaction, or investment strategy is suitable for any specific person. The material has not been prepared in accordance with legal requirements designed to promote the independence of investment research. Although we are not specifically prevented from dealing before providing this material, we do not seek to take advantage of the material prior to its dissemination.

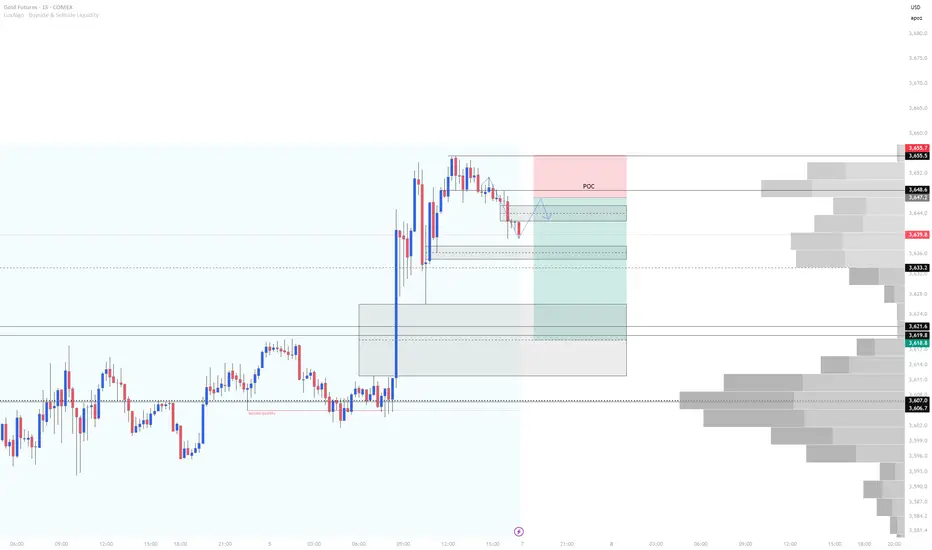
Gold Futures Short Into Asia 9/7/25Based on the current Fair Value Gap (FVG), Order Block (OB), and the liquidity resting below, I anticipate gold will retrace toward the Point of Control (POC) identified on the volume profile. This would provide an ideal setup for short-term selling opportunities during tonight’s PM session.
My expectation is for price to open lower, push into the 3658 range, and present a bearish entry signal. From there, I’ll be targeting shorts toward the equilibrium of the FVG around 3619, which also aligns closely with previous session highs and lows—adding confluence to the setup.
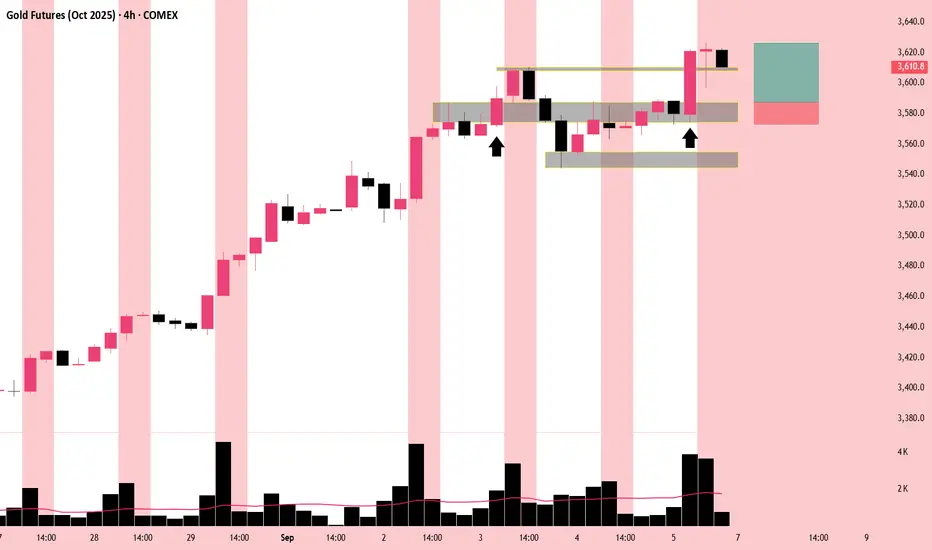
GC 4H icc analysisGold has been in a clear uptrend and ran into resistance between 3574.6/3587.9. Price broke the zone and indicated that sellers were weak above 3587.9, continued to climb making a new high before correcting back below the zone. Once price hit a support, it continued back above 3587.9 aggressively making a new indication and a new high.
Entry: around 3587.9 (after reversal confirmation on 1 hour)
Stop loss: Below last low
Target: Last swing high
Not financial advice.
gold futures analysis past weeks and upcoming weekshowing how gold broke out of long term range and what it may do next
