Analysis on Gold THBDear all
- currently, no clear direction
- if cannot pass 66000 = open short cut new high
- if 60000 broken down => at least 57000
- if 57000 cannot hold => 51-53k
not a buying time, wait and see or tp only.
not a financial advise, make your own decision and manage your own risk.
Trade ideas

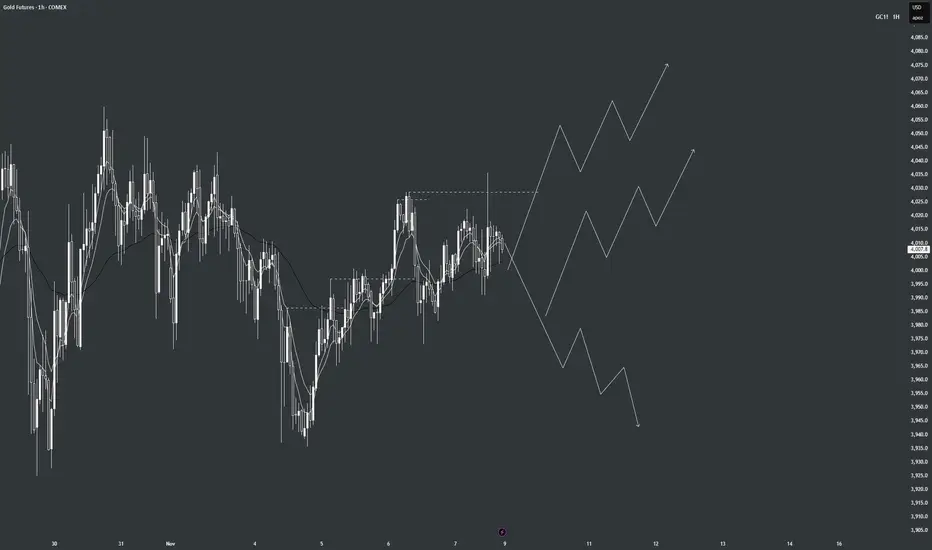
plan for MondayScenario 1 – Most Likely
🔻 Price continues drifting down toward 4000–4010 demand
→ Bounce expected here.
Scenario 2
🔺 Price retraces up into 4135–4140 breaker block, rejects, and then drops
→ Very clean short setup.
Scenario 3
🔺 Strong rally into 4205–4215 supply
→ High-probability short zone.
🎯 Summary: Best & Most Accurate Zone
📌 Best Bullish Zone:
➡ 4000–4010 Demand
📌 Best Bearish Zone:
➡ 4135–4140 Breaker Block
📌 Strongest Overall Zone:
➡ 4205–4215 Supply

MGC Short Asian SessionShort On MGC
Price action confirmed a short on the 5m TF
Targets session lows

GOLD Near Levels of Interest and Buyer Aggession. Another Rally?Gold is near key levels where buyers aggression has been seen in the past. Another rally brewing in GOLD?
Recently US Govenrment reopening has raised chances of interest rate cuts in December which can boost Gold prices further. All eyes on key US data points coming around 2200-2300 IST
Follow me for more such updates
4398.7This channel is not providing individualized trading or investment advice, nor is it a banking service, brokerage service, trading service, investment service or money management service

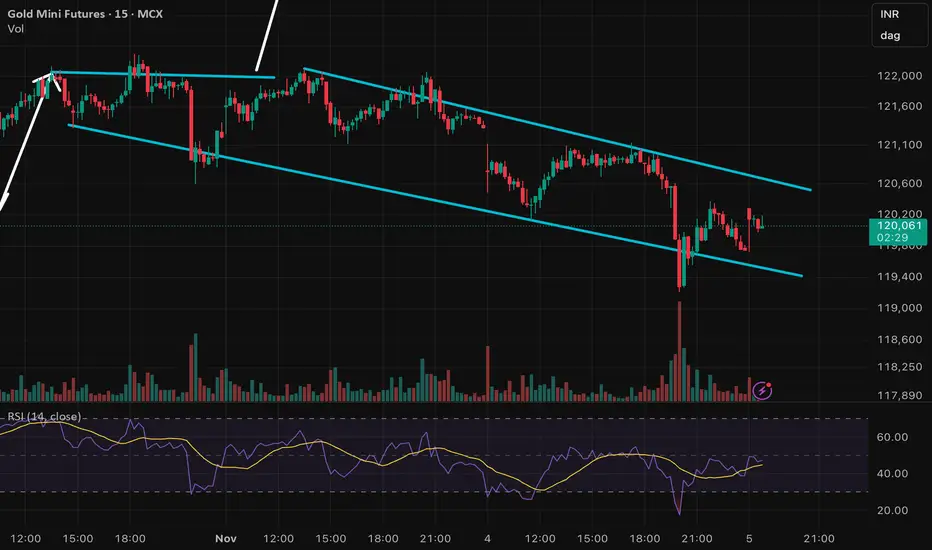
GOLD falling in a parallel channel formation Gold price has been falling since yesterday as expectations of December rate cut fades away. It is forming a parallel falling channel pattern and has recently bounced from the lower zone.
Keep an eye on it as volatility is expected to stay and there will be ample opportunities to capture movements. Follow me for live updates.
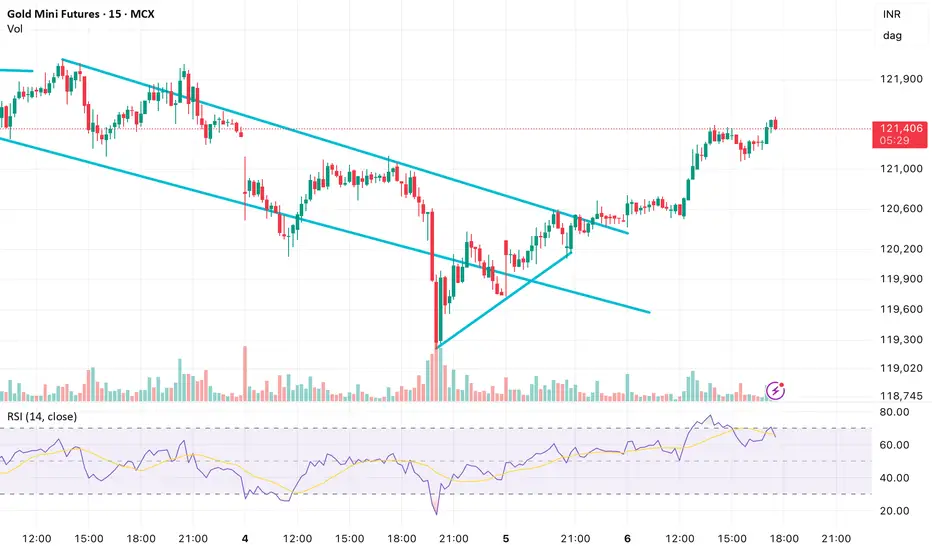
GOLDM showing upside momentum as BoE keeps rate at 4%GOLDM is rallying today before Bank of England interest rate decision where they have kept interest rate at 4% meeting market expectations.
Gold recently gave a breakout from a falling channel pattern formation on 15 min chart
Gold GC - Is the bullish Bias Back?Gold just completed a major pullback. Is Gold going to recover? Will the bullish Bias continue? Price is trending above the EMAs. This signals strong momentum for now. The Gold rush is on?

GC - til Nov 2025 (1hr chart)T.A explained -
BackSide (BS)
FrontSide (FS)
Inverse BS (Inv.BS)
Inverse FS (Inv.FS)
BS & FS levels are expected support when dashed lines, tested when dotted and resistance when solid lines.
The inverse is true for the Inv. BS Inv. FS levels, they are resistance as dashed lines, tested as dotted and support as solid lines.
Monthly timeframe is color pink
weekly grey
daily is red
4hr is orange
1hr is yellow
15min is blue
5min is green if they are shown.
strength favors the higher timeframe.
2x dotted levels are origin levels where trends have or will originate. When trends break, price will target the origin of the trend. its math, when the trend breaks, the vertex breaks too so the higher timeframe level/trend that breaks, the more volatility there could be as strength in the orders flow in to fuel the move.
yesterday
Trade closed manually
price followed the candle science and timeframes from the 5min green levels to the weekly grey level. Price has left behind some inverse frontside and inverse backside candles which look to be forming the bridge to flip the script if price manages to gain those levels and start accumulation. That liquidity will "unlock" and fuel price action.

$GC_F next #gold futures target 4600Gold seems to be shining higher above the big money level and my target will be a 4600 test.

missing out on gold?if you are not longing gold you are missing out.
lets take this to olympus buy every base
GC Weekly Outlook | November 10–14, 2025Gold has been slowly breaking structure and surfing the 50ema. We creeped up inside the 1hr range last week and liquidated those highs. We could see price continue to the upside this week November 10-14. I am expecting the 1hr o continue to push higher, we can possibly get a deeper pullback until that impulse. I always make sure to follow the trend on the 1hr timeframe since I enter on the lower timeframes. The trend is your friend.
GoldFail to brake out of the triangle indicating manipulation sweeping the highs closing back in the range. If price reject the 50% of the daily wick look for a short set up cuz lower prices be the best probability.

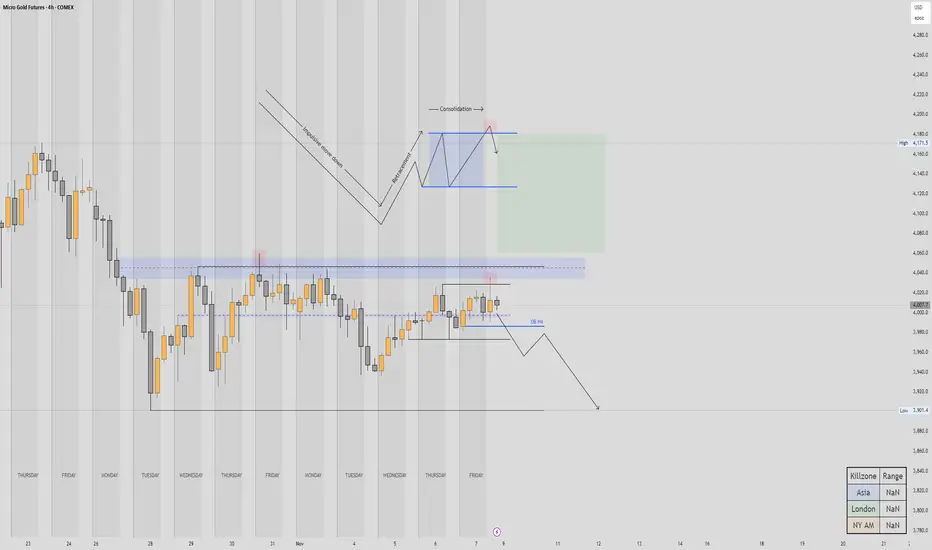
Gold futures to break back down the 4000?As we all know Gold has had an incredible rally this year,
Though, it's been consolidating for the last two weeks, and as far as the structure of the consolidation, some of the liquidity has been taken from the daily FVG on Oct the 30th, leaving a permanent high on the H4 chart with a nice bearish candle
Then it consolidated again for a bit, got an impulse to the downside, retraced with difficulty back to the H4 order block, to consolidate again last 2 days of last week. Finally , it printed what could be more of a permanent high on friday afternoon.
The combination of this, plus the last two day's candles looking bearish, starts to advocate for a bearish bias.
Therefore I'd like to see the price go and reach for the low of the range, after it's breaking the H4 structure
Of course this idea could be invalidated, if Gold was to break above the recent high and the Daily FVG, then we'd reasses the situation.
Still, I would be cautious for longs, Gold has been very extended for a very long time, needs to cool off a bit so we can go buy some coins again!
Cheers!
Trade idea for monday1. Bullish Scenario (Breakout Play)
Entry: Wait for a confirmed breakout and 30-min candle close above 4,020–4,030.
Retest Entry: Enter on retest of 4,010–4,020 zone.
Targets:
TP1: 4,060 (first resistance)
TP2: 4,100
TP3: 4,160
Stop-Loss: Below 3,980 (below breakout candle or wedge support)
R:R: ~1:2.5 to 1:3 depending on target.
2. Bearish Scenario (Rejection Play)
Entry: If price rejects 4,020–4,030 and closes below 3,995.
Targets:
TP1: 3,960
TP2: 3,945 demand zone
Stop-Loss: Above 4,030
R:R: ~1:2 potential

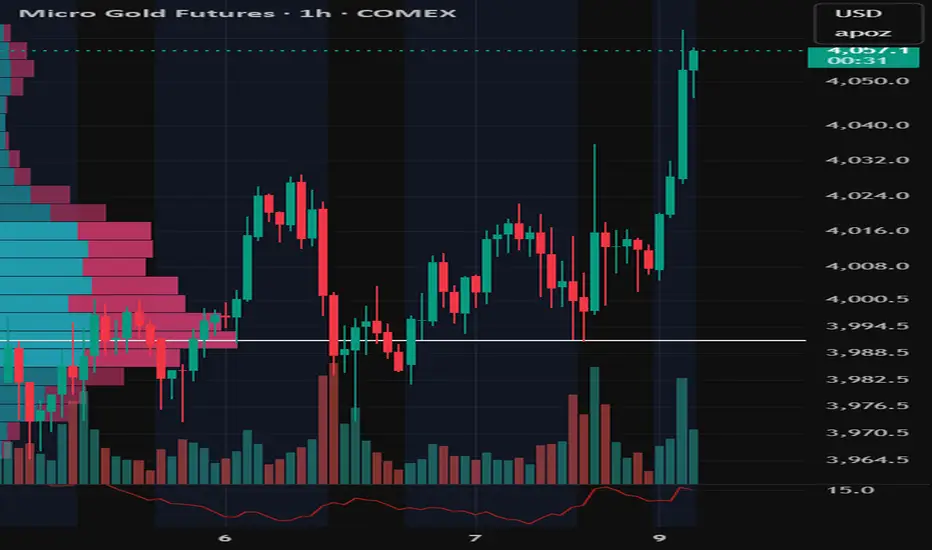
Gold Gearing Up — Watch $4,000 for the Next Bull RunXAUUSD testing $4,000 support. A bullish reaction here could ignite the next leg up. Smart money likely re-entering — I’m looking to buy dips around this level with eyes on $4,200+.
COMEX:GC1! OANDA:XAUUSD OANDA:XAUEUR FX_IDC:XAUUSD TVC:DXY

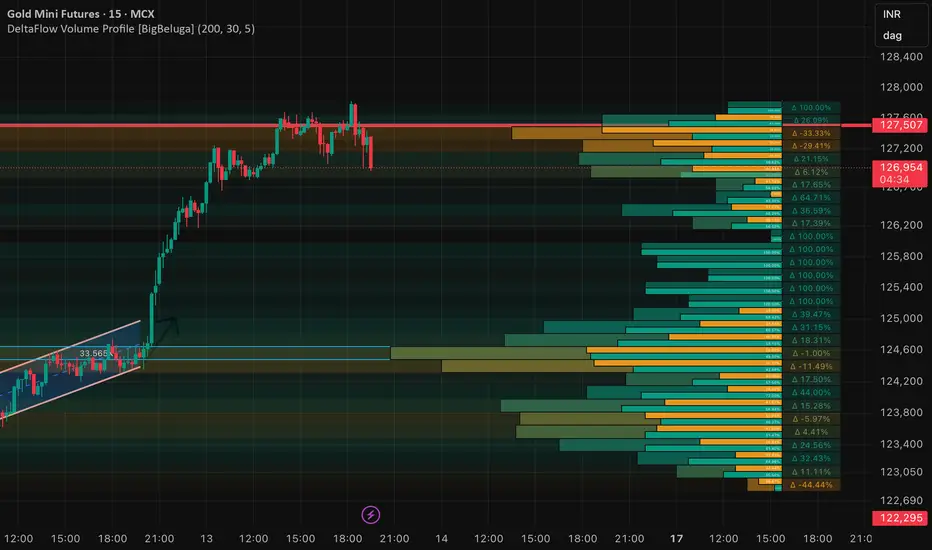
GOLD FUTURERS: Critical levels for tradingMCX GOLD : Trading sideways with minor dips. Bias :Positive
Positional Buy :Once it starts giving a close above 1,21,000 for a fresh rally towards 1,22,000+
Positional sell :Once it gives a close below 1,20,000 for 1,17,000/1,10,000 levels
Major Support :1,20,000/1,17,000/1,10,000
Major Resistance :1,21000-1,21,100(For educational purpose only)

1H BUY OPPO. AFTER BREAK OF LEVEL1. Break of 4015 buy 1H CANDLE.
2. buy on retest on 3 levels:
a) 4013-4008 LEVEL.
b) 3987-3981 level.
c) 3977-3965 level.
if 1H candle close down 3956 level.
setup fails. out of it or stop buying now.

XAUXAUStraight from perplexity - Potential for a Return to $4,200
Gold prices have fluctuated but repeatedly tested the $4,200 level, and the consensus among many experts is that, despite recent corrections, gold could readily revisit or sustain levels near $4,200, depending on global economic events, monetary policy (especially Fed rate decisions), inflation, and geopolitical uncertainties.

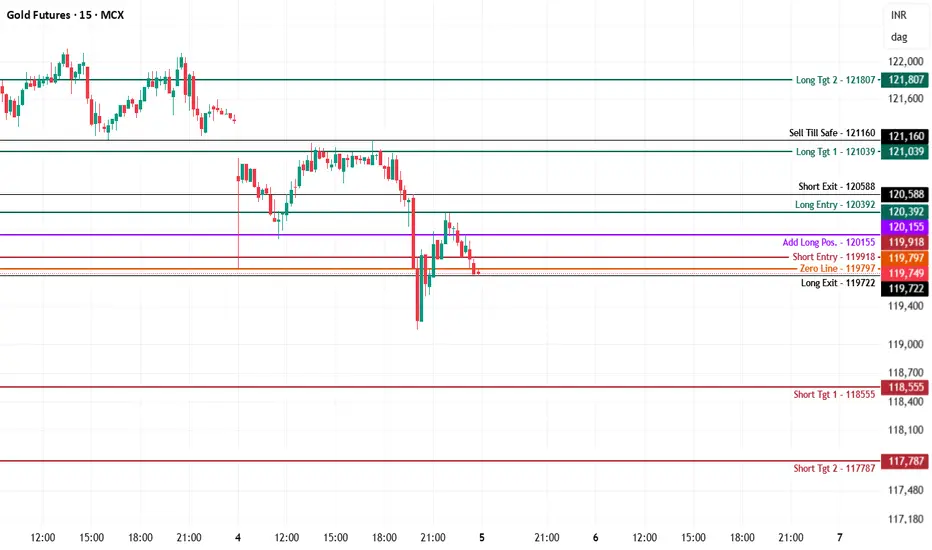
Gold MCX Future - Intraday Technical Analysis - 5th Nov., 25MCX:GOLD1!
MCX Gold Futures — Chart Pathik Insights | 5-Nov-25
Gold futures are under selling pressure, trading stall at 119,749 right at the zero line after a sharp leg down and minor bounce attempts. Price remains weak as sellers control action just beneath the 120,000 psychological mark, pointing to possible further downside unless reclaimed by bulls.
Bearish Structure:
Short setups dominate below 119,918, with every failed retest of the add-long (120,155) keeping momentum with sellers.
Downside Levels:
118,555: First logical target for bears; cover some, trail the rest.
117,787: Aggressive extension if broad liquidation triggers.
Risk Management: Shorts should be managed above the add-long or zero line to minimize risk if a reversal takes hold.
Bullish Structure:
Longs to be considered only above 120,392, needing quick acceptance back in the prior higher band and strong closes above resistance.
Upside Levels:
121,039: Initial resistance for partial or full booking.
121,807: Extension if sentiment flips with volume.
Risk Management: Use the short-entry/zero-line as stops for any fresh longs caught in whipsaws.
Neutral/Inflection:
The 119,797–119,749 band marks the direct battle for the session — choppy price is likely until a firm imbalance emerges. Be patient for confirmation before executing size.
Use these mapped zones for optimal structure, adaptive entries, and aggressive defense.
If these levels clarify your daily plan, boost, comment, and share—your support boosts the learning loop.
Follow Chart Pathik for unbiased pivots, process-backed logic, and practical market learning.
GC week 45threw this together real quick.
T.A explained -
BS & FS levels are expected support when dashed lines, tested when dotted and resistance when solid lines.
The inverse is true for the Inv. BS Inv. FS levels, they are resistance as dashed lines, tested as dotted and support as solid lines.
Monthly timeframe is color pink
weekly grey
daily is red
4hr is orange
1hr is yellow
15min is blue
5min is green if they are shown.
strength favors the higher timeframe.
2x dotted levels are origin levels where trends have or will originate. When trends break, price will target the origin of the trend. its math, when the trend breaks, the vertex breaks too so the higher timeframe level/trend that breaks, the more volatility there could be as strength in the orders flow in to fuel the move.

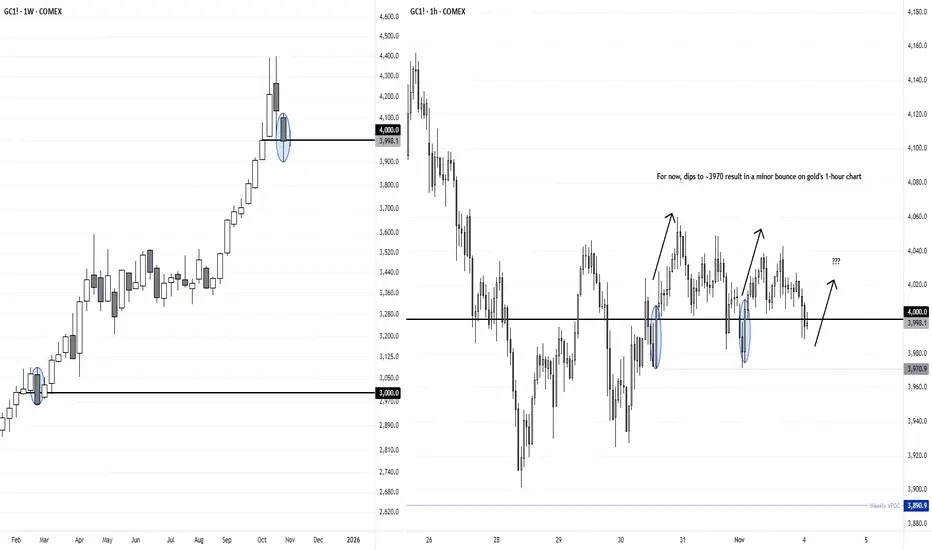
Gold Bulls Defend the $4000 Level as Bears Struggle for ControlGold closed lower for a second week, and prices are now meandering around the 4000 handle. We can see that the last time it tried to break back below such a milestone level, gold bear sonly managed a single weekly close below 3000 before the rally continued.
I doubt we’ll see another 1000 directly from current levels, and my bias is actually for the retracement to eventually dip lower before its bullish trend resumes. But for now, traders could seek false breaks below 4000 in anticipation of at least a minor move higher.
My video from Friday provides a bullish bias on the daily timeframe over the near term which still stands. But for those on intraday timeframes, notice that bullish engulfing candles have appeared on the 1-hour chart on the prior two occasions that gold tried (but failed) to break beneath 4000. It’s as if gold bears are trying to force the golden beach ball below its 4000 waterline.
Matt Simpson, Market Analyst at City Index
GOLD COMEXGold looks weak and face Resistance in 4010 and 4050. On 1hour good setup for short. Target near 3810 and SL NEAR 4050 .
