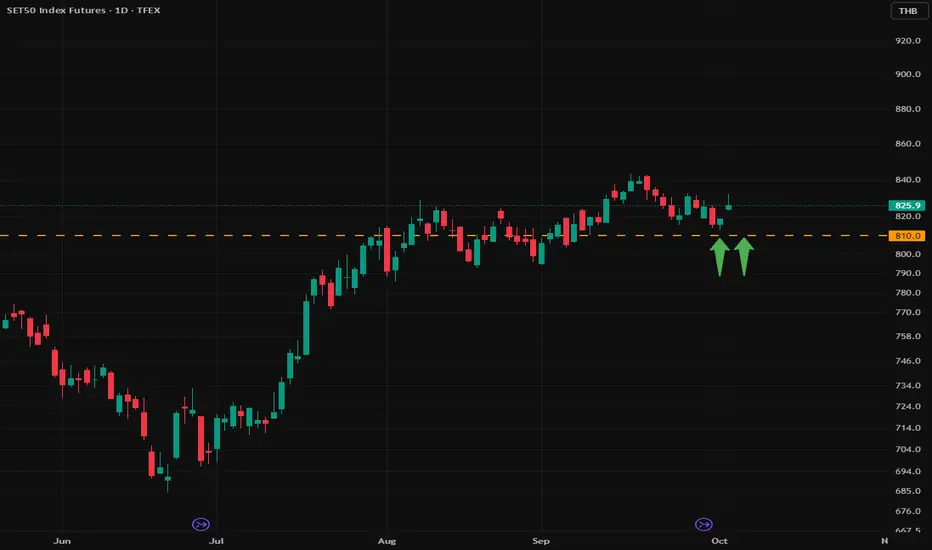
Analysis on S50 futures: sideway 811-845Dear all
its been two very hard week for trend traders.
many false signals occur during this week.
currenctly, it is in range 811-845,
suggestion, short when close to 845, long when close 811.
from the chart it is likely to go up first, if fail to break 845,
it sohuld come back down to 818, if
SET50 Index Futures
No trades
Related futures

Analysis on S50: hard to predictDear all
currently, the chart did not show any bias on either long or short
day=> it is up bias
4h=> it is down
1h=> it is up
my trading plan is to take action based on which cases it is closed to happen.
4 cases in each color shown above.
not financial advices.
wish you best of luck
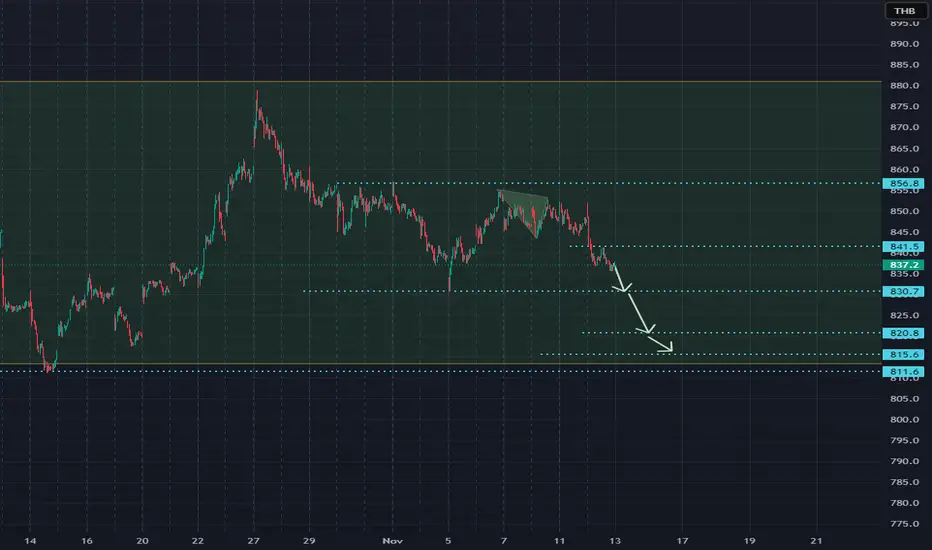
Analysis on S50 futures: bias downward if cannot break 842Dear all
after the previous post, i tried to guess but it went up a little too high.
but today, its about reading the price structure.
currently the price is going toward 831***
if it can hold, then cover some, if cannot hold, next target is 821***
if 821 cannot hold, 816 is the final targe
Newbie tries to guess: SET50Hi all
this post is just speculation and how I hope to trade.
dont need to take it so serious.
only personal bias.

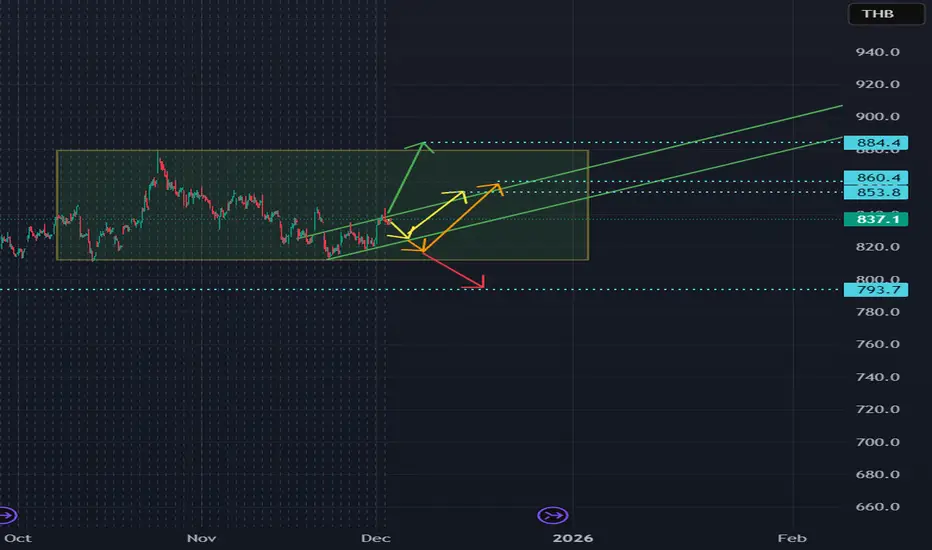
Analysis on SET50 Futures: If this level can hold, still up biasDear all
Today the chart unfold some useful information,
The old view is to wait and see how the pullback will be.
The updated view is that as long as 810 hold, it should be long bias.
But ******* Short Term ******** i expected them to come down to 819.
This will be the best entry for long if t
Analysis on S50 Futures: Still bullish but.. (cont.)Dear All
Now it reached 807 as the first target for fibo, you should be cautious already ,
the prob of going down increase after reaching the first target.
if i have to be biased, it is gonna keep pushing up to 840, 930 as next target.
As long as 773 holds, the long term view is upward and the t


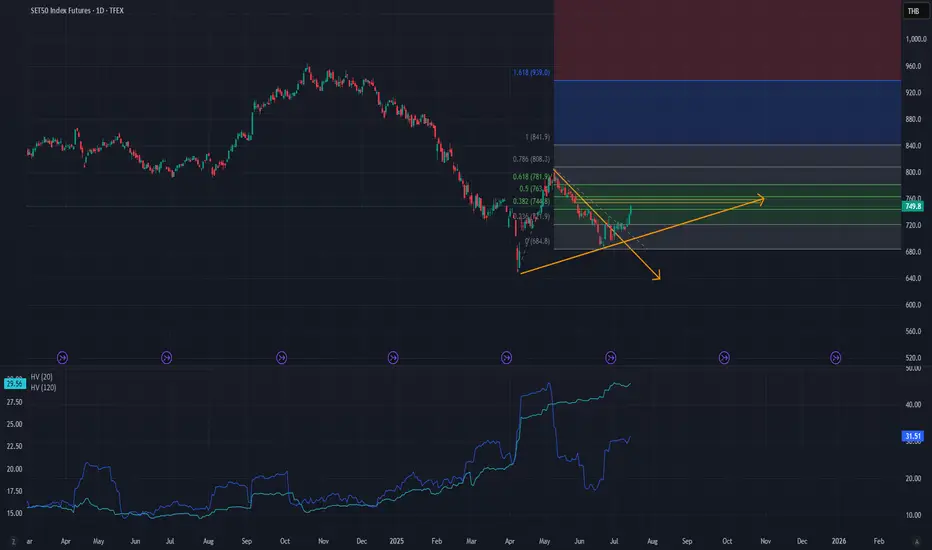
Analysis on S50 Futures: Almost hit the first targetDear all
if you are looking for long opportunity, it is not!.
The big resistance is there around 760-763
So either it is broken up or retrace first, then make a decision to buy follow or wait first.
Best Regards,
TraderPP
When Wave 3 Extends to 3.618×✅ What It Means
• Wave 3 has extended to 3.618× the length of Wave 1, which is a very strong impulsive wave.
• This often indicates high momentum and strong underlying trend (usually confirmed with high volume).
• It’s a classic sign of an extended wave structure — common in high-volatility, tren

See all ideas
Summarizing what the indicators are suggesting.
Neutral
SellBuy
Strong sellStrong buy
Strong sellSellNeutralBuyStrong buy
Neutral
SellBuy
Strong sellStrong buy
Strong sellSellNeutralBuyStrong buy
Neutral
SellBuy
Strong sellStrong buy
Strong sellSellNeutralBuyStrong buy
A representation of what an asset is worth today and what the market thinks it will be worth in the future.
Frequently Asked Questions
The current price of SET50 Index Futures is 821.4 THB — it has risen 0.37% in the past 24 hours. Watch SET50 Index Futures price in more detail on the chart.
The volume of SET50 Index Futures is 1.04 K. Track more important stats on the SET50 Index Futures chart.
The nearest expiration date for SET50 Index Futures is Sep 29, 2026.
Traders prefer to sell futures contracts when they've already made money on the investment, but still have plenty of time left before the expiration date. Thus, many consider it a good option to sell SET50 Index Futures before Sep 29, 2026.
Open interest is the number of contracts held by traders in active positions — they're not closed or expired. For SET50 Index Futures this number is 11.62 K. You can use it to track a prevailing market trend and adjust your own strategy: declining open interest for SET50 Index Futures shows that traders are closing their positions, which means a weakening trend.
Buying or selling futures contracts depends on many factors: season, underlying commodity, your own trading strategy. So mostly it's up to you, but if you look for some certain calculations to take into account, you can study technical analysis for SET50 Index Futures. Today its technical rating is buy, but remember that market conditions change all the time, so it's always crucial to do your own research. See more of SET50 Index Futures technicals for a more comprehensive analysis.