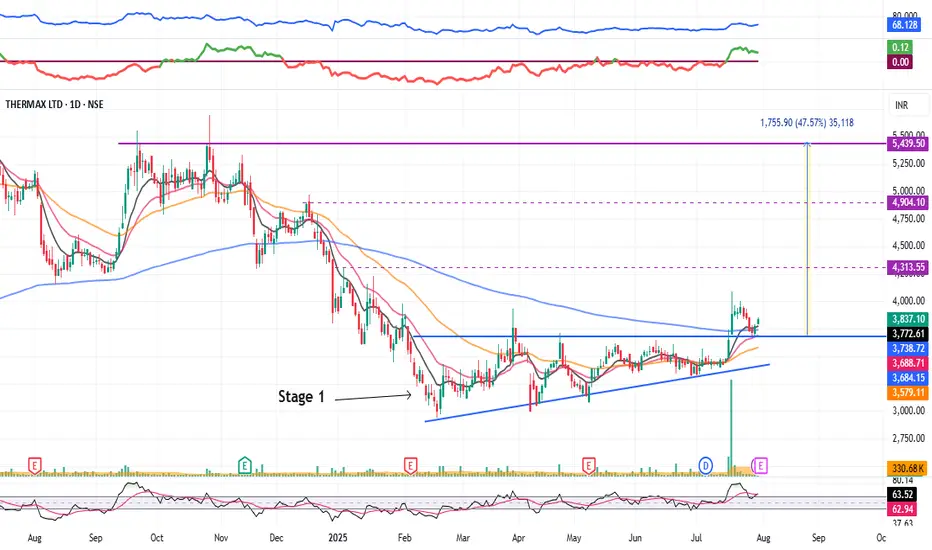
Thermax : Stage 1 Breakout (1-3 Months)#Thermax #stage1nreakout #ascendingtrianglepattern #patternbreakout #trendingstock #swingTrading
Thermax : Swing Trading
>> Stage 1 Breakout + Retest done
>> Ascending Triangle @ bottom of Downtrend
>> Trending setup in stock
>> Good strength & Recent Volume Buildup
>> Low Risk High Reward Trade
S
Next report date
—
Report period
—
EPS estimate
—
Revenue estimate
—
59.55 INR
6.34 B INR
102.83 B INR
39.04 M
About Thermax Limited.
Sector
Industry
CEO
Ashish Bhandari
Website
Headquarters
Pune
Founded
1966
ISIN
INE152A01029
FIGI
BBG000C4RWT6
Thermax Ltd. engages in the provision of engineering solutions to the energy and environment sectors. It operates through the following segments: Energy, Environment, and Chemical. The Energy segment comprises Process Heating, Absorption Cooling and Heating, Boiler and Heater and Power businesses and related services. The Environment segment consists of air pollution control and water and waste solutions. The Chemical segment comprises boiler and water chemicals, resins, performance chemicals, construction chemicals and oil field chemicals. The company was founded by A. S. Bhathena in 1966 and is headquartered in Pune, India.
Related stocks
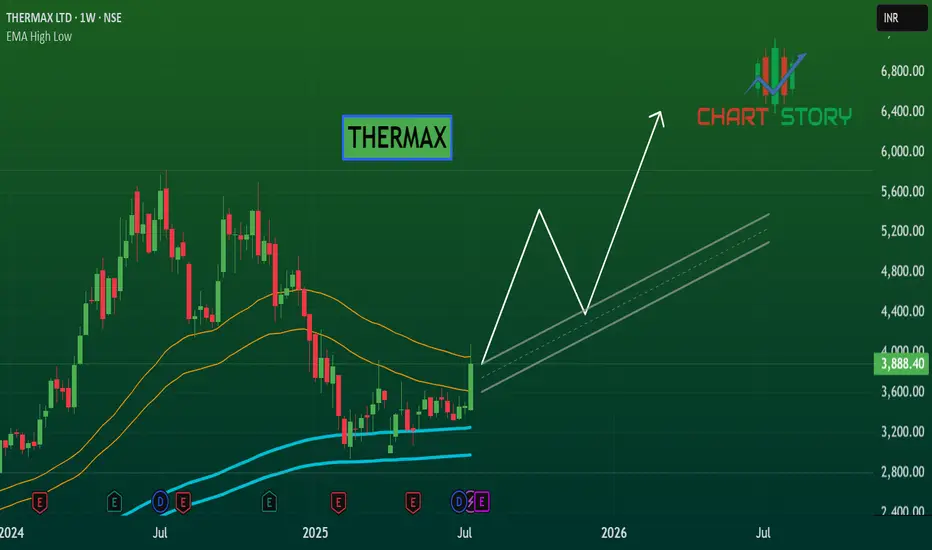
Amazing breakout on WEEKLY Timeframe - THERMAXCheckout an amazing breakout happened in the stock in Weekly timeframe, macroscopically seen in Daily timeframe. Having a great favor that the stock might be bullish expecting a staggering returns of minimum 25% TGT. IMPORTANT BREAKOUT LEVELS ARE ALWAYS RESPECTED!
NOTE for learners: Place the break
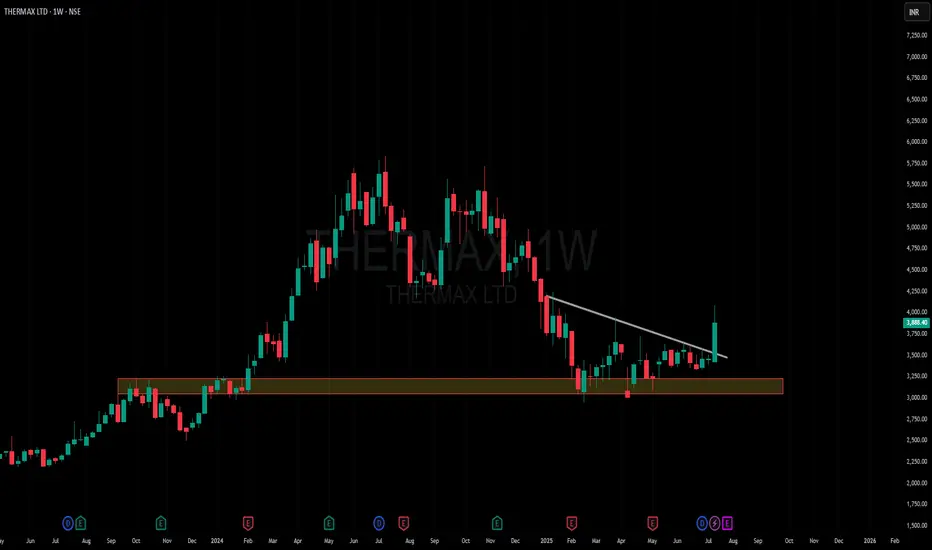
THERMAX - POSITIONAL BUYNSE:THERMAX Weekly rounding bottom trade with momentum , may continue more upside in medium term.
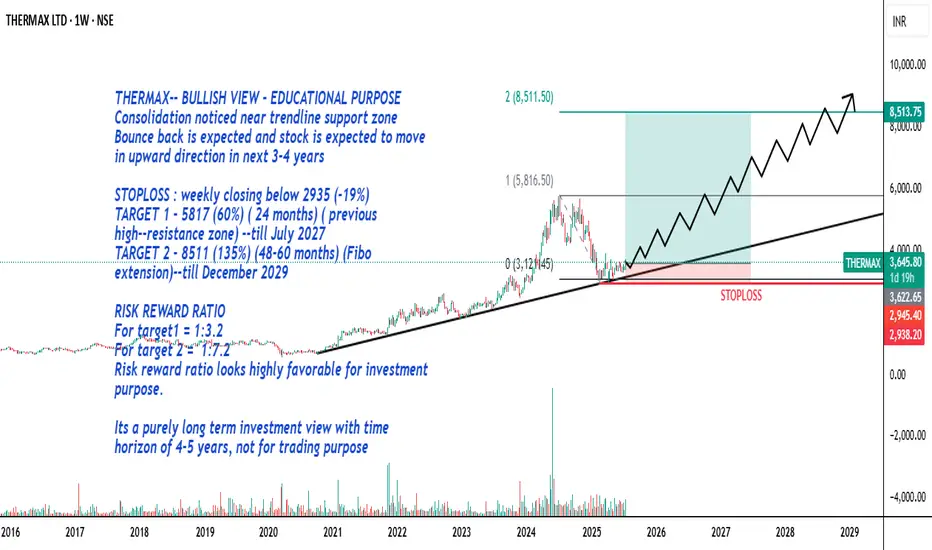
THERMAX-- BULLISH VIEW - EDUCATIONAL PURPOSE
Consolidation noticed near trendline support zone
Bounce back is expected and stock is expected to move in upward direction in next 3-4 years
STOPLOSS : weekly closing below 2935 (-19%)
TARGET 1 - 5817 (60%) ( 24 months) ( previous high--resistance zone) --till July 2027
TARGET 2 - 8511 (135%) (48
Review and plan for 2nd January 2025Nifty future and banknifty future analysis and intraday plan.
Swing ideas.
This video is for information/education purpose only. you are 100% responsible for any actions you take by reading/viewing this post.
please consult your financial advisor before taking any action.
----Vinaykumar hirem

Review and plan for 14th November 2024 Nifty future and banknifty future analysis and intraday plan.
Result analysis.
This video is for information/education purpose only. you are 100% responsible for any actions you take by reading/viewing this post.
please consult your financial advisor before taking any action.
----Vinaykumar

THERMAX CMP 5360.Thermax trading near 52 week high zone and All time high zone also.Now this is its strong resistance zone. If it can sustain this level next we can see a good upside moment.In this bearish market Thermax show strenth in price. Before take trade in this decide your Risk and Reward.Thanks.

THERMAX LTD S/R Support and Resistance Levels:
Support Levels: These are price points (green line/shade) where a downward trend may be halted due to a concentration of buying interest. Imagine them as a safety net where buyers step in, preventing further decline.
Resistance Levels: Conversely, resistance levels (re

ThermaxThermax
CMP 5431
Forming Cup and handle in daily chart
Volume seen increasing
Can target for 6000

Flag pattern breakout Swing TradeThe stock has demonstrated a flag pattern breakout, supported by impressive volume, indicating potential upward momentum. Additionally, a triangle pattern breakout has emerged, further strengthening the bullish outlook. This breakout was marked by a solid bullish candle, backed by robust volume, und

See all ideas
Summarizing what the indicators are suggesting.
Neutral
SellBuy
Strong sellStrong buy
Strong sellSellNeutralBuyStrong buy
Neutral
SellBuy
Strong sellStrong buy
Strong sellSellNeutralBuyStrong buy
Neutral
SellBuy
Strong sellStrong buy
Strong sellSellNeutralBuyStrong buy
An aggregate view of professional's ratings.
Neutral
SellBuy
Strong sellStrong buy
Strong sellSellNeutralBuyStrong buy
Neutral
SellBuy
Strong sellStrong buy
Strong sellSellNeutralBuyStrong buy
Neutral
SellBuy
Strong sellStrong buy
Strong sellSellNeutralBuyStrong buy
Displays a symbol's price movements over previous years to identify recurring trends.
SEDM
iShares IV PLC - iShares MSCI EM IMI Screened UCITS ETF Unhedged USDWeight
0.01%
Market value
934.18 K
USD
SAEM
iShares IV PLC - iShares MSCI EM IMI Screened UCITS ETF AccumUnhedged USDWeight
0.01%
Market value
934.18 K
USD
MIDCAPETF
Mirae Asset Nifty Midcap 150 ETF Exchange Traded Fund UnitsWeight
0.34%
Market value
475.30 K
USD
Explore more ETFs
Frequently Asked Questions
The current price of THERMAX is 3,145.20 INR — it has decreased by −0.10% in the past 24 hours. Watch Thermax Limited. stock price performance more closely on the chart.
Depending on the exchange, the stock ticker may vary. For instance, on NSE exchange Thermax Limited. stocks are traded under the ticker THERMAX.
THERMAX stock has fallen by −0.57% compared to the previous week, the month change is a −5.13% fall, over the last year Thermax Limited. has showed a −39.75% decrease.
We've gathered analysts' opinions on Thermax Limited. future price: according to them, THERMAX price has a max estimate of 5,100.00 INR and a min estimate of 3,210.00 INR. Watch THERMAX chart and read a more detailed Thermax Limited. stock forecast: see what analysts think of Thermax Limited. and suggest that you do with its stocks.
THERMAX reached its all-time high on Jul 8, 2024 with the price of 5,839.95 INR, and its all-time low was 7.65 INR and was reached on Sep 21, 2001. View more price dynamics on THERMAX chart.
See other stocks reaching their highest and lowest prices.
See other stocks reaching their highest and lowest prices.
THERMAX stock is 4.40% volatile and has beta coefficient of 0.73. Track Thermax Limited. stock price on the chart and check out the list of the most volatile stocks — is Thermax Limited. there?
Today Thermax Limited. has the market capitalization of 377.26 B, it has increased by 0.70% over the last week.
Yes, you can track Thermax Limited. financials in yearly and quarterly reports right on TradingView.
Thermax Limited. is going to release the next earnings report on Nov 11, 2025. Keep track of upcoming events with our Earnings Calendar.
THERMAX earnings for the last quarter are 13.25 INR per share, whereas the estimation was 12.71 INR resulting in a 4.25% surprise. The estimated earnings for the next quarter are 15.26 INR per share. See more details about Thermax Limited. earnings.
Thermax Limited. revenue for the last quarter amounts to 21.50 B INR, despite the estimated figure of 24.53 B INR. In the next quarter, revenue is expected to reach 27.99 B INR.
THERMAX net income for the last quarter is 1.52 B INR, while the quarter before that showed 2.06 B INR of net income which accounts for −25.93% change. Track more Thermax Limited. financial stats to get the full picture.
Yes, THERMAX dividends are paid annually. The last dividend per share was 14.00 INR. As of today, Dividend Yield (TTM)% is 0.44%. Tracking Thermax Limited. dividends might help you take more informed decisions.
Thermax Limited. dividend yield was 0.38% in 2024, and payout ratio reached 24.85%. The year before the numbers were 0.29% and 20.94% correspondingly. See high-dividend stocks and find more opportunities for your portfolio.
As of Oct 18, 2025, the company has 27.28 K employees. See our rating of the largest employees — is Thermax Limited. on this list?
EBITDA measures a company's operating performance, its growth signifies an improvement in the efficiency of a company. Thermax Limited. EBITDA is 9.92 B INR, and current EBITDA margin is 8.72%. See more stats in Thermax Limited. financial statements.
Like other stocks, THERMAX shares are traded on stock exchanges, e.g. Nasdaq, Nyse, Euronext, and the easiest way to buy them is through an online stock broker. To do this, you need to open an account and follow a broker's procedures, then start trading. You can trade Thermax Limited. stock right from TradingView charts — choose your broker and connect to your account.
Investing in stocks requires a comprehensive research: you should carefully study all the available data, e.g. company's financials, related news, and its technical analysis. So Thermax Limited. technincal analysis shows the sell today, and its 1 week rating is sell. Since market conditions are prone to changes, it's worth looking a bit further into the future — according to the 1 month rating Thermax Limited. stock shows the neutral signal. See more of Thermax Limited. technicals for a more comprehensive analysis.
If you're still not sure, try looking for inspiration in our curated watchlists.
If you're still not sure, try looking for inspiration in our curated watchlists.