Get Ready for a Strong Recovery on Theta in the Near Future! I believe Theta will see a strong recovery very soon based on this ABC correction, the same pattern BCH experienced. This will lead to a sharp recovery and a strong bullish move in the near future. It could be very profitable and mark the beginning of a massive run for this coin in the bigger picture. Theta is heavily undervalued and ready for big things.
As always, stay profitable.
– Dalin Anderson
THETAUSDT.3S trade ideas

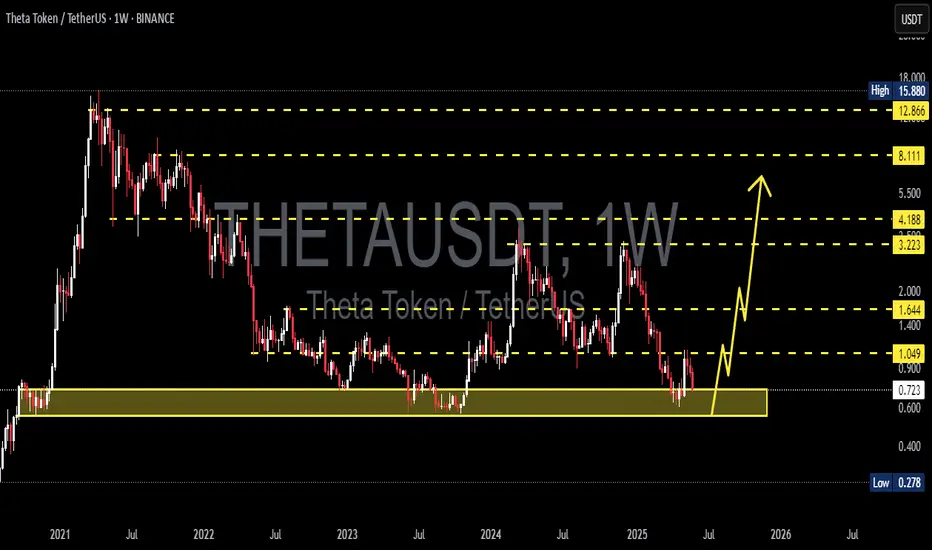
THETAUSDTDetailed Analysis
1. Market Phases
Parabolic Uptrend (Bull Market): The chart begins on the far left with a massive and rapid price increase. The long green candles indicate intense buying pressure that drove the price from well below $0.20 to a peak of nearly $16.00.
Major Downtrend (Bear Market): Following this peak, THETA entered a severe and protracted bear market. The price fell consistently for over a year, marked by a series of lower highs and lower lows. This demonstrates a long period where sellers were in complete control.
Consolidation/Accumulation Phase: For a significant portion of the chart (from mid-2022 onwards), the price has been trading in a relatively tight sideways range, primarily between approximately $0.50 and $1.50. This long period of sideways movement after a major downtrend often signifies that the bearish momentum has exhausted. This could be an accumulation phase, where long-term investors are gradually buying, or it could simply be a pause before further downside.
2. Key Price Levels
All-Time High (Major Resistance): The peak price, near $16.00, is the ultimate long-term resistance. It would take a monumental shift in market dynamics to retest this level.
Major Support Level: The price of approximately $0.425 (indicated by the dashed horizontal line) appears to be a critical long-term support level. While the price has wicked slightly below it, it has not closed below this level on a weekly basis, suggesting this is a strong floor.
Consolidation Range Resistance: The price has been rejected multiple times from the $1.20 - $1.50 area. This zone now acts as a significant resistance for any short-to-medium-term bullish rally.
Current Price: The current price is $0.743. It is trading in the lower half of its long-term consolidation range, closer to its major support than its range resistance.
3. Technical Indicators
Moving Average (The Green Line):
During the bull run, the price stayed firmly above it.
During the bear market, it acted as a dynamic resistance, with the price consistently staying below it.
In the current consolidation phase, the price is frequently crossing it, indicating a lack of a clear trend. Currently, the price is slightly below the moving average, suggesting some minor bearish pressure in the short term.
Volume (Not Pictured, but Implied): Typically, a parabolic top is formed on extremely high volume, which then tapers off during the downtrend. The consolidation phase usually sees very low volume, which would pick up significantly on a breakout in either direction.
Potential Future Scenarios
Bullish Case: A sustained weekly close above the consolidation resistance (around $1.50) would be a strong bullish signal. This could indicate the end of the long-term downtrend and the beginning of a new major uptrend. The first major target after such a break would likely be the $3.00 - $3.50 area, which acted as a previous support/resistance level.
Bearish Case: A breakdown and weekly close below the major support level at $0.425 would be a very bearish sign. This would invalidate the idea that a bottom has been formed and could lead to significant further downside, as there would be no clear support levels left from this historical data.
Neutral Case (Most Likely in Short-Term): The most probable scenario in the immediate future is a continuation of the sideways price action. THETA could continue to trade between the $0.50 support and the $1.20 resistance until a major market catalyst forces a breakout in one direction.
Disclaimer: This technical analysis is for informational purposes only and is not financial advice. The cryptocurrency market is extremely volatile, and past performance is not indicative of future results.
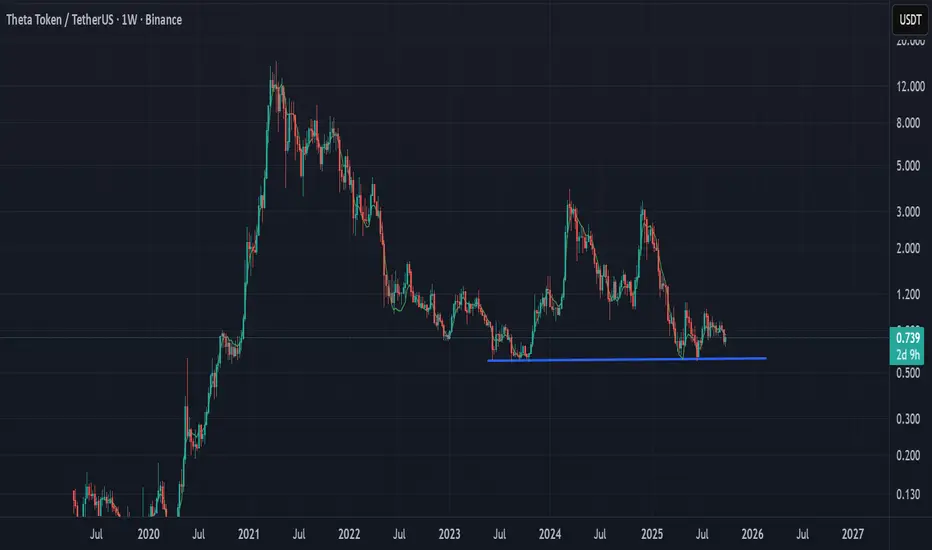
THETA/USDT — Demand Zone Retest: Strong Rebound or Breakdown?📌 Overview
THETA is currently trading at a critical decision point, sitting right inside the multi-year demand zone of $0.50–$0.75, with the price hovering around $0.694. This area has acted as a strong base since 2021, and the next move will determine whether THETA is gearing up for a major rebound or facing another leg down in its prolonged bearish trend.
---
🔹 Structure & Pattern Analysis
Macro Trend: Since hitting the all-time high of $15.88 in 2021, THETA has consistently formed lower highs, showing a dominant bearish structure.
Key Demand Zone: The $0.50–$0.75 range has acted as a long-term floor for more than 3 years.
Chart Pattern: The structure resembles a descending triangle (flat support with lower highs), a pattern that usually favors breakdowns — though invalidation remains possible with a confirmed breakout to the upside.
Accumulation Hints: Decreasing sell volume during each retest of the demand zone suggests seller exhaustion and potential long-term accumulation.
---
🔹 Bullish Scenario
1. Strong Rebound From Demand Zone
If THETA holds above $0.50–$0.75 and prints a strong bullish weekly candle (hammer or engulfing), it may signal accumulation strength.
2. First Confirmation:
A weekly close above $1.03 (immediate resistance) → signals that buyers are regaining control.
3. Upside Targets:
Target 1: $1.66
Target 2: $3.05
Target 3: $4.22
Breaking higher could extend toward $8.15 – $12.74, and possibly retest the ATH at $15.88 in the long run.
4. Momentum Validation:
RSI reclaiming >50 + MACD bullish cross would strengthen the bullish case.
---
🔹 Bearish Scenario
1. Confirmed Breakdown Below $0.50
A weekly close below $0.50 would confirm a bearish continuation and invalidate the demand zone.
2. Failed Retest:
If the price retests $0.50–$0.55 and fails to reclaim, it could trigger accelerated selling pressure.
3. Downside Targets:
Target 1: $0.33
Target 2: $0.24 (multi-year bottom)
4. Risk:
A breakdown below $0.50 may cause capitulation, with long-term holders potentially exiting positions.
---
🔹 Trading Strategy & Risk Management
Long-Term Investors (DCA): Gradual accumulation within $0.50–$0.75, with a conservative stop loss below $0.45.
Swing Traders: Enter long after a confirmed breakout and weekly close above $1.03, targeting $1.66+.
Bearish Traders: Short setups become valid if weekly closes below $0.50, with targets toward $0.33–$0.24.
Risk Control: Always apply stop losses. Maintain a minimum risk-to-reward ratio of 1:2 before entering.
---
🔹 Conclusion
THETA is standing at a make-or-break zone.
As long as it holds above the $0.50–$0.75 demand zone, the potential for a major rebound remains alive, especially if $1.03 is broken to the upside.
However, a weekly close below $0.50 would confirm a bearish continuation, opening the path to new lows.
The upcoming weekly closes will be decisive — the next candles could shape THETA’s direction not just for months, but potentially for years.
---
#THETA #Crypto #Altcoin #TechnicalAnalysis #PriceAction #SupportResistance #Breakout #Breakdown #CryptoTrading
THETA – Resistance Rejection, Targeting Accumulation Rang LowTHETA is currently showing signs of rejection at resistance from a lower high, indicating a potential move to the downside. This pullback could drive the price toward the bottom of its current accumulation range, where stronger support may be found.
📌 Trade Setup:
• Entry Zone: $0.70 – $0.75
• Take Profit Targets:
o 🥇 $0.95 – $1.00
o 🥈 $1.60 – $1.72
o 🥉 $2.13 – $2.25
• Stop Loss: Below ~$0.50

THETA Breakout Retest Done – Eyeing 20% Pump!
THETA has successfully broken out of its descending trendline (purple) and completed a clean retest. Price is now consolidating above the breakout zone, indicating strength and buyer control.
If this level holds, we could see a 15–20% upside move in the short term, with momentum possibly pushing towards the \$0.075–\$0.080 zone.
Key Points:
* ✅ Trendline breakout confirmed
* ✅ Retest completed successfully
* 📈 Bullish structure forming on lower timeframes
* 🎯 Short-term target: +15–20% from current levels
Trading Plan:
* Entry: Above breakout & retest level ($0.056–$0.058)
* SL: Below retest zone ($0.054–$0.055)
* TP1: $0.070
* TP2: $0.078–$0.080
Note: Maintain risk management and trail stop-loss as price moves in your favor.

THETA Breaks Structure With Triangle Pressure Forming
🚨 MYX:THETA just slipped below its ascending channel on the 4H timeframe 📉—a key breakdown that shifts the short-term bias.
📆 On the Daily and 3D charts, a descending triangle pattern is starting to take shape 🧊
This combination of lower highs and horizontal support could lead to further downside if bulls don't step in soon.
The next few candles are critical—either THETA reclaims the broken structure, or it slides deeper into bearish territory.
👀 Eyes on this zone—momentum could flip fast.
Is this a fakeout or the start of a deeper breakdown?
Not financial advice.
THETA Bounces Off Key Support – Eyes on Resistance!After months of holding above the key support zone, MYX:THETA is finally showing some strength.
Price is bouncing off the lows and heading toward a minor S/R zone.
If the bulls can break through this level, there’s a good chance we’ll see a move all the way up to the upper resistance line.
DYOR, NFA

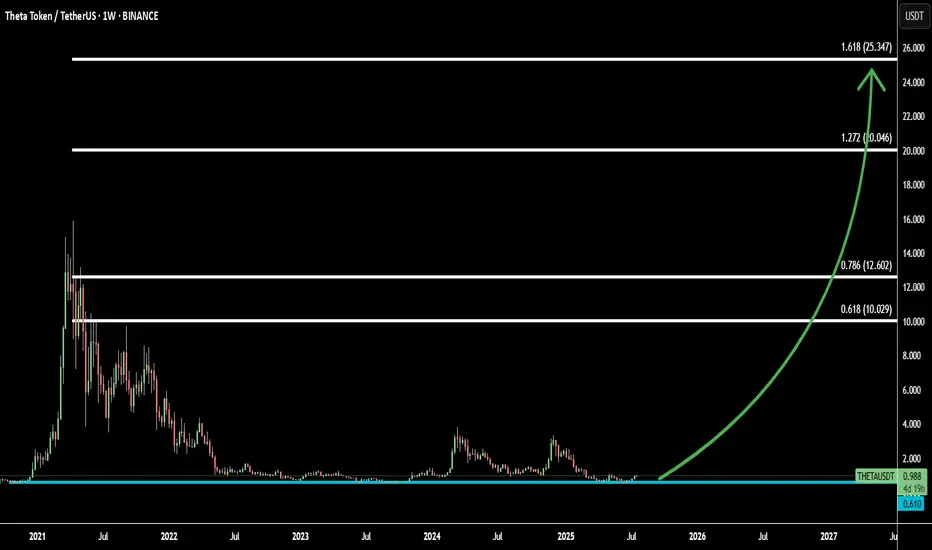
THETA in Markup Phase: 4 Fibonacci Targets from Cycle BottomEven without a full altseason, THETA (THETAUSD) appears to be transitioning into a markup phase from its deepest correction zone. Price action suggests that THETA has likely bottomed out, making this one of the most reliable buying opportunities among altcoins right now.
Technically, THETA is breaking out from long-term accumulation with strong support beneath, and the risk-reward is highly favorable at these levels.
Using Fibonacci extensions, we identify 4 major upside targets:
Target 1: 0.618 Fib — 10.029 - initial momentum and breakout confirmation
Target 2: 0.786 Fib — 12.609 - mid-cycle resistance zone
Target 3: 1.272 Fib — 20.046 - extended move aligned with historical levels
Target 4: 1.618 Fib — 25.347 - full markup potential and trend peak target
This structure suggests that THETA may not wait for altseason—it's building strength independently. The chart is aligned for a macro trend reversal.
THETA Long Swing Setup – Accumulation Phase Near BreakoutTHETA is still consolidating in a range, but momentum is quietly building. A break above $1.07 followed by a higher low would confirm structural reversal. We’re eyeing the $0.95–$1.00 zone for a clean entry on retest, offering solid risk-reward if support holds.
📌 Trade Setup:
• Entry Zone: $0.95 – $1.00
• Take Profit Targets:
o 🥇 $1.60 – $1.70
o 🥈 $2.10 – $2.20
• Stop Loss: Daily close below $0.90

Is #THETA Ready For a Major Reversal or Another Fakeout ahead?Yello, Paradisers! Is this breakout the beginning of a bullish reversal for #THETA or just a setup to trap the herd before a sharp dump? Let’s break down the setup of #ThetaNetwork:
💎After weeks of slow bleeding inside a falling wedge, #THETAUSDT has broken out of this pattern. The price is currently hovering around $0.718, and it’s the first time in weeks we’re seeing real bullish momentum starting to build. The volume is slowly picking up, so the probability of a bullish push is higher.
💎A clean breakout above the descending resistance now opens the door toward moderate resistance at $0.999. That’s the next key hurdle where we expect sellers to show up. If bulls are strong enough to clear that zone, we’re targeting the strong supply level at $1.284, where significant distribution will likely begin.
💎Why this setup matters: The support zone between $0.60 and $0.66 has acted as strong demand for multiple weeks now for #THETAUSD. Price wicked into it again recently and got bought up quickly, forming a potential higher low. This kind of accumulation behavior often precedes a strong leg up if volume confirms the move.
💎However, if price loses the key support at $0.60, and more importantly breaks below the setup invalidation level at $0.439, we’ll treat this as a failed breakout and expect a deeper correction. That would bring us back into the lower demand zones, and we’ll sit on our hands until the next proper high-probability entry appears.
Stay patient, Paradisers. Let the breakout confirm, and only then do we strike with conviction.
MyCryptoParadise
iFeel the success🌴

THETAUSDT 1D#THETA has broken above the descending resistance on the daily chart and is currently sitting on the daily SMA100. The setup looks promising. Consider buying some THETA here and near the support zone.
Targets:
🎯 $0.951
🎯 $1.190
🎯 $1.384
🎯 $1.577
🎯 $1.852
⚠️ As always, use a tight stop-loss and apply proper risk management.

Thetausdt trading ideaThetausdt is at a critical juncture, testing the immediate demand zone at $1.18-$1.36, which aligns with a key liquidity area. The structure suggests a classic accumulation phase, with a completed descending wedge marking the cycle low.
A strong reaction from this base could ignite a macro impulse wave, targeting $3.02, $5.91, and ultimately $15.88, in line with Fibonacci extensions. A deeper liquidity sweep toward the external demand zone remains possible, offering a prime accumulation opportunity.
A strategic trading plan involves scaling in at the current level, adding on dips, and securing profits at key resistance levels while allowing the long-term wave structure to play out.

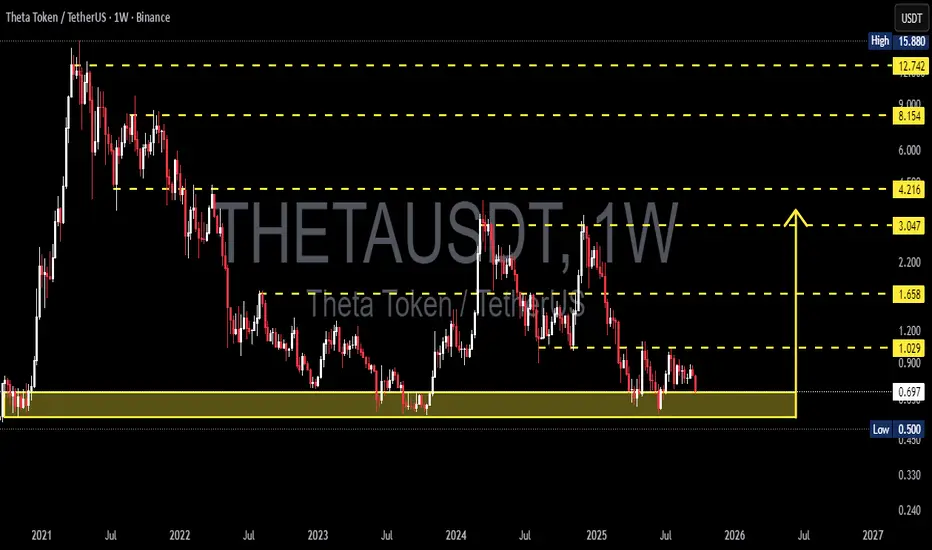
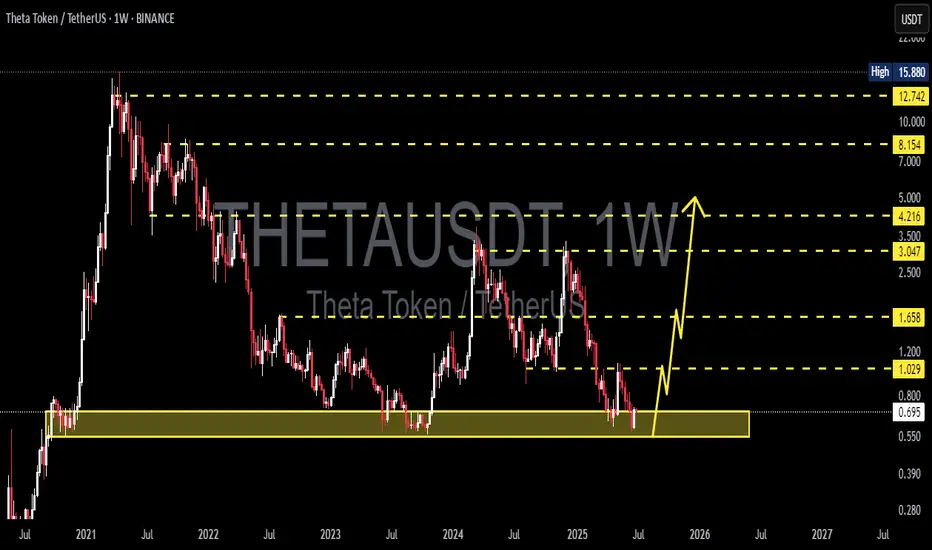
THETA Holding the Line – A Hidden Gem Before the Next Altseason?
🔍 Chart Structure and Key Zones:
Timeframe: 1W (Weekly)
Major Historical Support: The yellow zone between $0.55 - $0.70 has been tested multiple times since 2021.
The current price is once again retesting this strong support area, showing signs of a potential bullish bounce.
📈 Bullish Scenario:
If the support at $0.696 holds and triggers a reversal:
Potential short-term targets are:
$1.029 as the first minor resistance
Breakout above $1.658 could lead to a rally toward:
$3.047
$3.50
$4.216
If bullish momentum sustains, long-term targets include:
$8.154
$12.742
And possibly a retest of the all-time high at $15.880
> This price action suggests the formation of a potential Double Bottom pattern — a classic bullish reversal signal on higher timeframes.
📉 Bearish Scenario:
If price breaks below the support zone of $0.696 – $0.55:
The bullish setup becomes invalidated.
There is little significant support below $0.55, which could lead to an aggressive selloff.
This would indicate a possible final capitulation phase before a true macro bottom is formed.
📊 Chart Pattern Insight:
Potential Double Bottom forming in a high-confluence support zone
Signs of accumulation structure with long lower wicks (indicating buyers stepping in)
Bullish impulse projection is marked if a breakout confirms
🔖 Conclusion:
The $0.55 - $0.70 zone is a critical turning point for THETA.
If held, this could mark the beginning of a long-term trend reversal.
The current setup offers a favorable risk-reward ratio for swing and long-term traders, though caution is needed if the support fails.
#THETAUSDT #THETA #CryptoAnalysis #TechnicalAnalysis #CryptoBreakout #BullishReversal #AltcoinSeason #SupportAndResistance #DoubleBottom #SwingTrade
Theta Is Ready for a Strong Recovery Soon!Looking at Theta, I see strong potential for a recovery very soon. We just completed a classic ABC correction, very similar to what Amazon experienced back in the day. I expect a big bullish move on this coin shortly. We are primed for a strong reversal here.
Theta is undervalued on both the higher and lower time frames, and with such strong project fundamentals, I see this as a major mover in the upcoming altcoin bull market. There’s potential for insane gains on the larger time frames and a strong recovery on the smaller ones.
Don’t focus on the news or media—crypto is ready for big things. As always, stay profitable.
— Dalin Anderson

The hell is this garbage?So, Tradingview asks to provide a meaningful analysis of my idea. Okay, here ya go....stay away from this sh!t coin. Come on, folks.....really? Where is the demand from this mofo, except when it is in the climb to the top? Answer: No fawking where....that's where! Either people don't know what the nature of this coin is, or most just know better to gamble with this brand instead of well established coins (BTC, ETH, SOL, etc.). Look, just steer away from this money pit until shown otherwise (volume increase due to demand). Personally, looking at this coin brings about as much excitement as looking at my smear of excrement on the toilet paper after a healthy phat dump. Yeah.....you know what I mean.

THETAUSDT: Weak Buyers & Your Short Opportunity in the Red BoxAlright everyone, with a critical update on THETAUSDT. Here’s the stark truth: buyers, in general, are weak. This isn't a market signaling strong demand, and it's a mistake to think otherwise.
Most traders get trapped by false signals. But you? You need a clear, confirmed path to profit. My strategy for THETAUSDT is precise: I absolutely will not take a short without clear confirmation from the red box. This isn't about guessing; it's about making calculated moves where the market reveals its true intent.
Look at the chart. That red box I've identified? That's your critical zone for potential short entries. When price engages with this area, we're not just watching; we're hunting for specific signals:
Volume Footprint: I'll be meticulously checking the volume footprint within that red box. Are sellers truly overwhelming buyers? Is there genuine distribution happening, not just a momentary pause?
CDV (Cumulative Delta Volume): Watch for CDV to turn definitively negative or show strong bearish divergences. This tells you the sellers are gaining true control, not just a fleeting advantage.
LTF Breakdowns: On the low timeframes (LTF), I need to see clear, decisive breakdowns. We're looking for price to fail, retest the red box as new resistance, and then continue its move lower. This is your confirmation.
Why does this matter? My focus is exclusively on assets showing a sudden and significant increase in volume. While THETAUSDT might not be seeing a bullish volume surge, understanding the volume dynamics within its weakness is how we pinpoint high-probability short setups.
Keep a very close eye on that red box. If the bearish confirmations line up, you'll uncover a clear, strategic short entry. Don't be surprised if THETAUSDT's price action confounds the masses; this is where smart, confirmed decisions are made.
📌I keep my charts clean and simple because I believe clarity leads to better decisions.
📌My approach is built on years of experience and a solid track record. I don’t claim to know it all but I’m confident in my ability to spot high-probability setups.
📌If you would like to learn how to use the heatmap, cumulative volume delta and volume footprint techniques that I use below to determine very accurate demand regions, you can send me a private message. I help anyone who wants it completely free of charge.
🔑I have a long list of my proven technique below:
🎯 ZENUSDT.P: Patience & Profitability | %230 Reaction from the Sniper Entry
🐶 DOGEUSDT.P: Next Move
🎨 RENDERUSDT.P: Opportunity of the Month
💎 ETHUSDT.P: Where to Retrace
🟢 BNBUSDT.P: Potential Surge
📊 BTC Dominance: Reaction Zone
🌊 WAVESUSDT.P: Demand Zone Potential
🟣 UNIUSDT.P: Long-Term Trade
🔵 XRPUSDT.P: Entry Zones
🔗 LINKUSDT.P: Follow The River
📈 BTCUSDT.P: Two Key Demand Zones
🟩 POLUSDT: Bullish Momentum
🌟 PENDLEUSDT.P: Where Opportunity Meets Precision
🔥 BTCUSDT.P: Liquidation of Highly Leveraged Longs
🌊 SOLUSDT.P: SOL's Dip - Your Opportunity
🐸 1000PEPEUSDT.P: Prime Bounce Zone Unlocked
🚀 ETHUSDT.P: Set to Explode - Don't Miss This Game Changer
🤖 IQUSDT: Smart Plan
⚡️ PONDUSDT: A Trade Not Taken Is Better Than a Losing One
💼 STMXUSDT: 2 Buying Areas
🐢 TURBOUSDT: Buy Zones and Buyer Presence
🌍 ICPUSDT.P: Massive Upside Potential | Check the Trade Update For Seeing Results
🟠 IDEXUSDT: Spot Buy Area | %26 Profit if You Trade with MSB
📌 USUALUSDT: Buyers Are Active + %70 Profit in Total
🌟 FORTHUSDT: Sniper Entry +%26 Reaction
🐳 QKCUSDT: Sniper Entry +%57 Reaction
📊 BTC.D: Retest of Key Area Highly Likely
📊 XNOUSDT %80 Reaction with a Simple Blue Box!
📊 BELUSDT Amazing %120 Reaction!
📊 Simple Red Box, Extraordinary Results
📊 TIAUSDT | Still No Buyers—Maintaining a Bearish Outlook
📊 OGNUSDT | One of Today’s Highest Volume Gainers – +32.44%
📊 TRXUSDT - I Do My Thing Again
📊 FLOKIUSDT - +%100 From Blue Box!
📊 SFP/USDT - Perfect Entry %80 Profit!
📊 AAVEUSDT - WE DID IT AGAIN!
I stopped adding to the list because it's kinda tiring to add 5-10 charts in every move but you can check my profile and see that it goes on..

#THETA 1D. Swing High Rejected – What's Next? 06/11/25We are currently in a consolidation range. After updating the swing high, price immediately faced seller pressure from the top of the structure.
Why did this happen?
Many participants were stuck in losses for a long time and decided to exit at breakeven as soon as price gave them the chance — totally understandable.
Key levels for the setup:
Yellow lines – potential entry points.
Red lines – stop-loss levels, depending on your risk appetite (marked two options).
Green lines – target areas.
Whether you go with spot or futures — the setup is there. Choose your strategy accordingly.
DYOR.

THETAUSDT 1D Analysis THETA ~ 1D Analysis
#THETA Buy after successfully breaking this resistance line with large volume. Minimum target 10%+, Long term target $3

THETA - LONG SET-UPBINANCE:THETAUSDT
4️⃣ 𝐓𝐇𝐄𝐓𝐀/𝐔𝐒𝐃𝐓
Theta is holding a solid double bottom and pressing against trendline resistance. A breakout could open doors to a 110% rally toward $1.92. Chart looks ready to turn...
THETAUSDT 1W AnalysisTHETA ~ 1W Analysis
#THETA Buy gradually from here if you still have confidence in this coin with a short term target of at least 20%+ from here.

Theta (THETA): Expecting More Dipping Before Getting Good BuyAmazing catch on theta coin We have since broken the neckline zone, where price has reached our zones of desire, but we might see a further dip into the zones of liquidity, which are 13% away from the current market price.
We are expecting the price to drop a little more and then enter the accumulation zone, from where we are going to aim to catch a good BOS, which would give a nice entry for a buy order from lows.
But for now, let's dip a little more!
Swallow Academy

THETAUSDT: Strong Fundamentals, Bullish Technicals: What’s Next?Hello Everyone!
In this idea, I’ll break down BINANCE:THETAUSDT from both a fundamental and technical perspective. The goal is to uncover whether THETA presents a real opportunity or if it’s just another altcoin market noise.
1. Fundamental Analysis
I’m bullish on THETA not only for its technical setup but also for its strong fundamentals:
- AI Integration Advantage: THETA is carving out a niche in the AI and decentralized video infrastructure space which is a sector currently enjoying massive global attention and investment. This AI focus gives THETA a competitive edge in a rapidly evolving industry.
- Tokenomics: THETA has a maximum and circulating supply of 1 billion tokens , which is relatively no inflationary token.
- Upcoming Catalyst : EdgeCloud Beta Launch : A major catalyst is scheduled for June 25 , with the beta launch of THETA’s EdgeCloud platform. This development could generate renewed investor interest and media attention.
- Active Transparent Team : THETA’s team is known for being highly active and continuously forming strategic partnerships, which reinforces long-term credibility and ecosystem growth.
2. Technical Analysis
On Weekly timeframe
- THETA has recently made an upward move from a strong demand zone , showing clear signs of buyer interest. Notably, it didn't break below its 2023 bottom , which reinforces a bullish structure and suggests that the long-term support is holding firm.
- Additionally, the MACD is on the verge of a bullish crossover, signaling a potential shift in momentum. If confirmed.
On 4D timeframe
- THETA also bounced off a PD Array, specifically a Fair Value Gap (FVG) , which often acts as a high-probability reaction zone in ICT . Adding to the bullish confluence, it closed a previous 4-day candle with strength , confirming bullish intent and showing institutional interest may be stepping in at this level.
- THETA is currently targeting the next PD Array — a swing point around $1.08 . If price sweeps this level with strength, the next potential target lies around $1.311 , aligning with the next major liquidity zone .
On 4H timeframe
- For bullish momentum to truly build, THETA must break above the key resistance zone at $0.93 . This level has acted as a supply barrier, and a clean breakout could trigger increased buying pressure.
- On the Cumulative Volume Delta (CVD) , there's a bullish divergence forming — a strong indication that buying interest.
In conclusion, THETA/USDT is showing promising signs both technically and fundamentally. The bounce from a key demand zone, bullish divergence on CVD, and a potential MACD crossover suggest momentum may be shifting in favor of bulls. If price breaks above the $0.93 resistance , we could see a move toward $1.311 .
On the fundamental side, THETA’s involvement in the booming AI sector, capped supply, upcoming EdgeCloud beta launch (June 25), and an active development team provide strong long-term potential.
As always, manage risk wisely and monitor key levels for confirmation.
