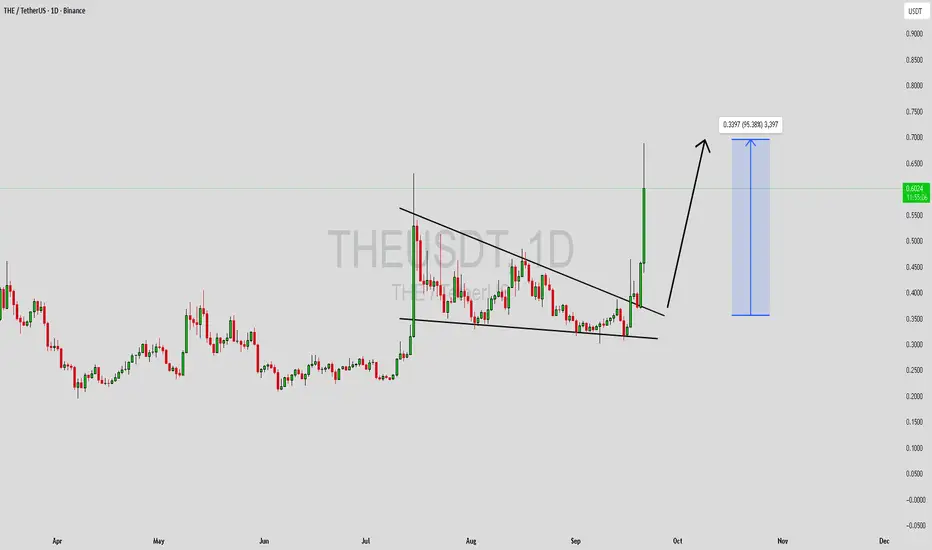
THEUSDT Forming Falling WedgeTHEUSDT is currently displaying a falling wedge pattern, which is one of the strongest bullish reversal signals in technical analysis. After a prolonged downtrend, the price has started to compress within converging trendlines, suggesting that selling pressure is weakening and buyers are preparing t
HOLDING MY THENA [THE / USDT] position! Holding my TSX:THE position 📈
Bulls will be back soon!
Remember; Key demand zone:
0.4700 - 0.440 - 0.4300$
Bullish retest daily & price discovery valid if we hold above!
Price could fly much higher HTF. 🚀

THE / USDT - BOTTOM IS PROBABLY IN! #THE / USDT - BOTTOM IS IN 📈
✅Weekly support - retest
✅Inverse H & Shoulder reversal structure
Bulls may be back soon! 📈

THE - NEXT BULLISH WAVE LOADING ? Very solid uptrend & strong hype on #THE🚀
Price is consolidating, nicely, antipating another leg up, likely toaward 0.800$ next 📈
Local key supports:
0.5600 - 0.5300 - 0.5200 - 0.4980

THE / USDT : Testing trendline resistanceTHE/USDT Price is once again testing trendline resistance. A confirmed breakout from this level could trigger a rally towards $0.60.
Always wait for confirmation before entering and manage risk properly.

SPOT BREAKOUT - HYPE ALERT --> THE/USDT🚨SPOT BREAKOUT HYPE ALERT🚨
Missed the $ASTER rocket?
Don’t worry, the real opportunity might just be starting with TSX:THE (@ThenaFi_), now trading on #Binance!
Why am I watching TSX:THE closely?
🔸DEX on BNB Chain, just like $ASTER
🔸Backed by kingmakers CZ & @YziLabs
🔸But while $ASTER is alr

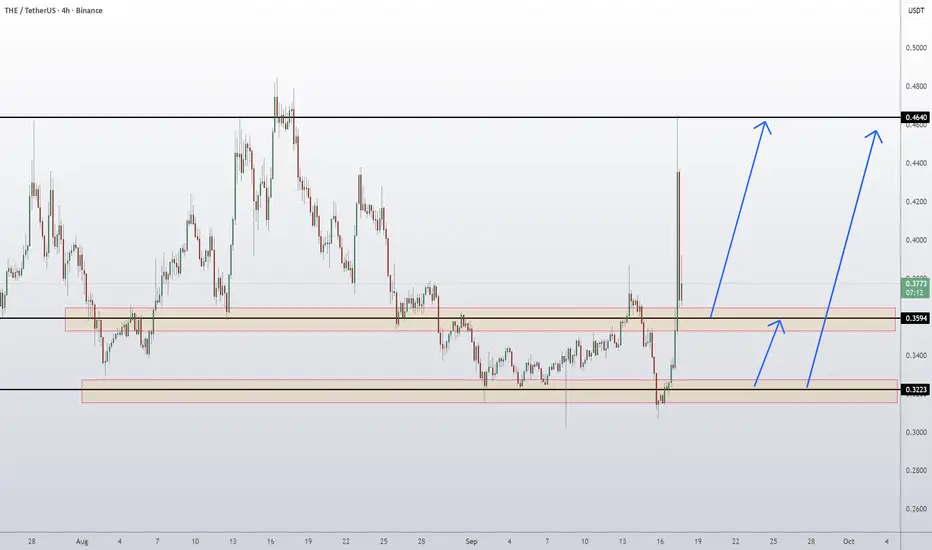
Ethena ENA Coin Price Prediction and Technical AnalysisTHE/USDT just broke out strongly from the 0.3594 resistance zone, surging toward the 0.4287 area before facing rejection. The breakout highlights renewed bullish momentum after a long consolidation. If buyers defend 0.3594 on a retest, continuation toward the 0.4640 resistance is likely. However, if
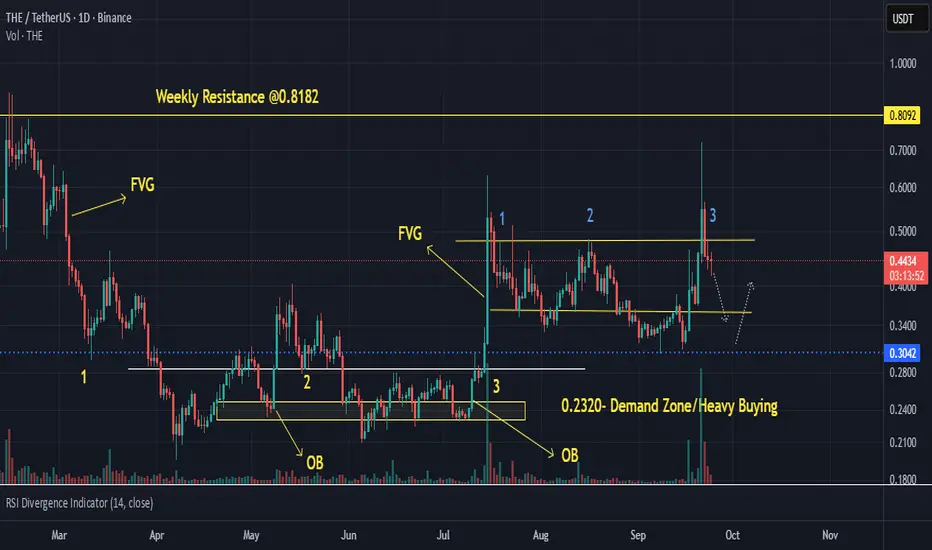
THE/USDT – Retracement Before Attempting Weekly Resistance🔑 Key Points (Analysis):
Support Zones:
$0.3042 → strong daily/weekly support.
$0.2320 → demand zone with heavy buying interest (previous OB).
Resistance Zones:
$0.55 → short-term resistance tested multiple times.
$0.8182 → key weekly resistance (major hurdle for continuation).
Order Blo
THEUSDT UPDATE#THE
UPDATE
THE Technical Setup
Pattern: Bullish Falling Wedge Pattern
Current Price: $0.1779
Target Price: $0.298
Target % Gain: 65.80%
TSX:THE is breaking out of a falling wedge pattern on the 1D timeframe. Current price is $0.1779 with a target near $0.298, showing nearly 66% upside potenti

THEUSDT UPDATE#THE
UPDATE
THE Technical Setup
Pattern: Bullish Falling Wedge Pattern
Current Price: $0.0415
Target Price: $0.0582
Target % Gain: 40.29%
TSX:THE is breaking out of a falling wedge pattern on the 1D timeframe. Current price is $0.0415 with a target near $0.0582, showing about 40% potential ups

See all ideas
Summarizing what the indicators are suggesting.
Oscillators
Neutral
SellBuy
Strong sellStrong buy
Strong sellSellNeutralBuyStrong buy
Oscillators
Neutral
SellBuy
Strong sellStrong buy
Strong sellSellNeutralBuyStrong buy
Summary
Neutral
SellBuy
Strong sellStrong buy
Strong sellSellNeutralBuyStrong buy
Summary
Neutral
SellBuy
Strong sellStrong buy
Strong sellSellNeutralBuyStrong buy
Summary
Neutral
SellBuy
Strong sellStrong buy
Strong sellSellNeutralBuyStrong buy
Moving Averages
Neutral
SellBuy
Strong sellStrong buy
Strong sellSellNeutralBuyStrong buy
Moving Averages
Neutral
SellBuy
Strong sellStrong buy
Strong sellSellNeutralBuyStrong buy
Displays a symbol's price movements over previous years to identify recurring trends.