TIAUSDT trade ideas

TIA | Next Altcoin to MOON ??In the macro, it's clear that TIA has been in a downward trend for an extended period of time. This means, it's a great place to buy - because the bullish cycle is up next.
In an earlier publication, I made an update about the ideal entry point for TIA:
A key indicator to watch is the daily timeframe, when the price begins to trade ABOVE the moving averages - that's when you'll have the first confirmation of a bullish turn around. It is a bullish sign to see the gradual higher lows.
Moving Averages:

TIAUSDT - analysis of the downtrend phase and potentialProject :
Celestia is one of the key players in the new generation of modular blockchain architecture. Unlike traditional monolithic solutions, it separates the execution and consensus layers. This provides flexibility, scalability, and creates the infrastructure for rollup and L2 ecosystems.
📍 CoinMarketCap: #47
📍 Twitter (X): 397.7K
____________________________________________________________
🔎 Technical picture :
I marked the Seed / Series A / Series B zones on the chart — it's clear how early investors locked in massive profits: from listing, the price skyrocketed +634%, and their returns are many times higher!)
From the current levels, the price is down ~87% from its all-time high.
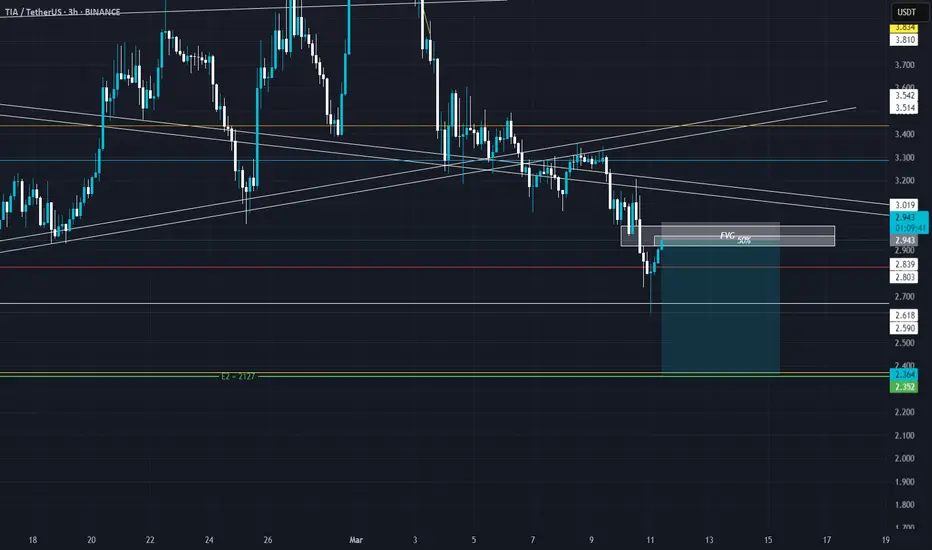
Formation: the price is moving inside a large descending channel. At the same time, a potential “cup” structure and a possibly emerging ascending channel are forming.
We are close to the lower boundary of these formations — it's an interesting zone.
A final sweep/fakeout toward the lower boundary of the descending channel is possible — keep this in mind when calculating risk.
Key level: the orange trendline marks the boundary of the secondary trend. A confident breakout and hold above it would be one of the reversal signals.
____________________________________________________________
💡 General conclusions :
Liquidity — solid.
The coin is traded on major exchanges.
Trend potential is marked on the chart.
As always — everything depends on your strategy and patience.
____________________________________________________________
📌 This review is not financial advice but my personal analysis and observations on the project.

TIA ( SPOT)BINANCE:TIAUSDT
TIA / USDT
(4H + 1D) time frames
analysis tools
____________
SMC
FVG
Trend lines
Fibonacci
Support & resistance
MACD Cross
EMA Cross
______________________________________________________________
Golden Advices.
********************
* Please calculate your losses before any entry.
* Do not enter any trade you find it not suitable for you.
* No FOMO - No Rush , it is a long journey.
Useful Tags.
****************
My total posts
www.tradingview.com

TIA LONG ALL trading ideas have entry point + stop loss + take profit + Risk level.
hello Traders, here is the full analysis for this pair, let me know in the comment section below if you have any questions, the entry will be taken only if all rules of the strategies will be satisfied. I suggest you keep this pair on your watchlist and see if the rules of your strategy are satisfied. Please also refer to the Important Risk Notice linked below.
Disclaimer

TIA: 40% Crash in Sight – What's Next?TIA recently lost its strong $4 support, and that level is now acting as resistance. For the past two months, the price hasn’t been able to climb back above $4, leaving us with one burning question: Is more blood on the table?
Broken Support: TIA has given up its $4 support, which now serves as resistance.
Looking at November 2024: The low from November 2024 was around $1.9. Revisiting that level could provide us with a high-probability long trade.
Trade Setup Opportunity
Entry Point: Set an alarm for the $1.9 low. A successful bounce here would signal a potential long trade opportunity.
Target & Reward: With the goal of targeting the $3 level, this trade could offer a risk-to-reward ratio of at least 5:1.
Implication: If the $1.9 level is revisited and holds, we could be looking at a scenario with roughly 40% more downside in the current trend—but also a setup for a low-risk long if the bounce holds.

TIAUSDT: Ascending triangle formation!!Join our community and start your crypto journey today for:
In-depth market analysis
Accurate trade setups
Early access to trending altcoins
Life-changing profit potential
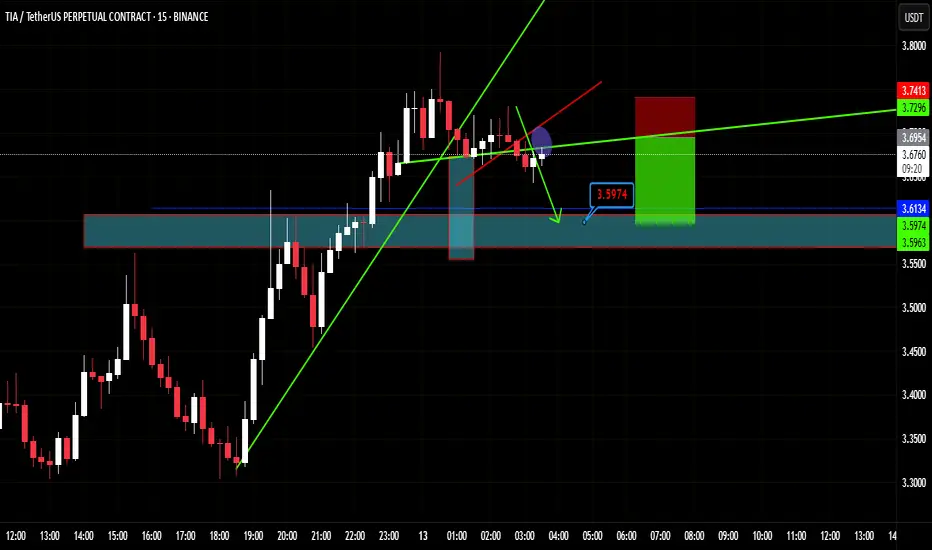
Let's analyze TIAUSDT on LFT:
TIA is in an ascending triangle, facing $3.67-$3.72 resistance. A breakout targets higher zones. A drop below $3.42 after triangle breakdown signals bearish mode. Watch for price action at these key levels for trading decisions.
Entry: CMP to $3.55
SL: close below $3.42
Target:
$4.09
$4.48
If you find this analysis helpful, please hit the like button to support my content! Share your thoughts in the comments and feel free to request any specific chart analysis you’d like to see.
Happy Trading!!

Is TIA About to Break Down Hard? Traders Beware Before It’s lateYello, Paradisers! Did you catch the recent bullish rally on #TIAUSDT? It’s been delivering solid gains over the past couple of days, giving traders reason to celebrate. But what if we told you that this rally might just be setting up a classic trap—one that smart money is already preparing to take advantage of? The technical structure forming right now suggests a high probability of a reversal, and if you’re not paying attention, you might end up on the wrong side of the move.
💎#TIAUSDT, at the core of setup is a developing a probable Bearish Gartley pattern. These harmonic structures are rare but extremely powerful when they align with multiple technical confirmations and that’s exactly what we’re seeing here. With the recent move upward, TIAUSDT appears to have completed its C leg, a critical part of the Gartley structure. This sets the stage for the D leg, which typically completes much lower. The price reacted strongly from the C leg area, which also happens to line up perfectly with a previous local high adding even more probability to the resistance at that zone.
💎This resistance isn't just horizontal there's a dynamic element at play as well. The 21-period EMA on multiple timeframes is currently acting as a ceiling for price action. When a key moving average starts rejecting price repeatedly, it often signals that the current trend is losing steam and this dynamic resistance only strengthens the case for a downside move from here.
💎Looking deeper, the bearish signs are confirmed by momentum indicators. The RSI on lower timeframes is not only overbought but also showing clear signs of bearish divergence. This divergence occurs when the price continues to make higher highs while RSI starts forming lower highs a classic sign that momentum is weakening. It’s one of the more reliable early warnings that a reversal may be near. In this case, RSI is flashing that warning now, suggesting that buyers may soon run out of fuel.
💎If this bearish probable scenario plays out as expected, the first key level to watch on the downside sits around the 3.278 zone. This minor support may offer a temporary bounce, but if the D leg of the Gartley is to be completed, we could see even deeper price action. This makes the current area extremely sensitive—any weakness from bulls could trigger a fast move downward.
💎However, no pattern is complete without an invalidation level, and for the Bearish Gartley, that comes in around the 3.805 resistance zone. A strong, sustained close above this level would invalidate the bearish setup and signal renewed bullish momentum. Until then, all technical signals are pointing toward caution, especially for those still riding long positions without a tight risk plan.
Stay alert, Paradisers. The market is about to decide. This is a textbook moment where emotions can take over, and late buyers get punished for chasing green candles. That’s why, we are playing it safe right now. If you want to be consistently profitable, you need to be extremely patient and always wait only for the best, highest probability trading opportunities.
MyCryptoParadise
iFeel the success🌴


TIAUSDT – Weak at Key Weekly Level! More Downside Ahead?TIAUSDT – Weak at Key Weekly Level! More Downside Ahead?
“This chart looks weak—momentum favors the downside. But is there a bounce first?”
🔥 Key Insights:
✅ Sitting at a Critical Weekly Zone – A breakdown here could be brutal.
✅ Momentum Looks Bearish – No real strength from buyers.
✅ Only Considering Low-Risk Buys – Fibonacci Green Zone (0-0.5) is the ideal cheap area.
💡 The Smart Plan:
Looking for a Break & Retest Downward – If support cracks, shorts become clear.
Small Risk Buys from the Fibonacci Zone – Only for aggressive traders.
CDV & Volume Profile Must Confirm – No buyers? No trade.
“Weak price action, heavy risk. Only the right levels matter here—watch closely!” 📉🔥⚠️
A tiny part of my runners;
🌊 WAVESUSDT.P: Demand Zone Potential
🟣 UNIUSDT.P: Long-Term Trade
🔵 XRPUSDT.P: Entry Zones
🔗 LINKUSDT.P: Follow The River
📈 BTCUSDT.P: Two Key Demand Zones


TIA | PERFECT Bottom??In the macro, it's clear that TIA has been in a downward trend for an extended period of time. This means, it's a great place to buy - because the bullish cycle is up next.
Trend based indicators are great to identify the immediate predominant pressure on the chart, in this case, bearish. A "Buy" signal in the weekly timeframe would be the first step in the right direction (reversal).
Trend Based Indicator:
Another key indicator to watch is the daily timeframe, when the price begins to trade ABOVE the moving averages - that's when you'll have the first confirmation of a bullish turn around.
Moving Averages:
______________________
BINANCE:TIAUSDT

Breaking: $TIA Surges 17% Eyeing A Move to $5 The first modular blockchain network that enables anyone to easily deploy their own blockchain with minimal overhead by rethinking blockchain architecture from the ground up broke out of a falling wedge patten soaring 17% albeit the crypto market is highly volatile with CRYPTOCAP:BTC reclaiming the FWB:83K pivot.
Celestia Network Native token ( LSE:TIA ) has shocked the mainstream crypto market after breaking out of a falling wedge escaping the gasp of the support point holding it at the $2 zone.
With building momentum, LSE:TIA is eyeing a move to the $5 zone should it break the $4 resistant zone a move to the $5 target isn't far-fetched. With the Relative Strength Index (RSI) at 58, LSE:TIA is poised for a bullish run should the crypto market stabilize.
Celestia Price Live Data
The live Celestia price today is $3.74 USD with a 24-hour trading volume of $220,357,891 USD. Celestia is up 17.41% in the last 24 hours. with a live market cap of $2,091,803,371 USD. It has a circulating supply of 558,964,944 TIA coins and the max. supply is not available.


Celestia TIA price analysis🟣 For the second day in a row, the LSE:TIA price is showing growth
But would we risk buying OKX:TIAUSDT now - rather no than yes...
🟡 Above the orange trend line, purchases will be safer.
🟢 And during the $3 retest in the blue scenario, it's even safer)
Although, in the medium term, seeing #Celestia at $9 again is more than a realistic task.
_____________________
Did you like our analysis? Leave a comment, like, and follow to get more

TIA Trade Setup: Potential Double Bottom FormationWith seller exhaustion possibly setting in, TIA is shaping up for a double bottom formation. If price deviates from launch levels and confirms a market structure shift, we could see a strong upside move.
🛠 Trade Details:
Entry: Around $4.00
Take Profit Targets:
$5.50 (First TP - Key Resistance Zone)
$7.10 (Second TP - Breakout Level)
$9.00 (Third TP - Full Expansion Target)
Stop Loss: Below $3.00
Keeping an eye on volume confirmation and resistance reclaim before full conviction. 🚀

TIA short back to $3.00I just now opened a short trade on TIa. Am anticipating a big drop back to $3.00 this weekend and right here where am shorting might be the top.
This setup however isnt' in full alignment with my DTT strategy. Direction, Target and Timing.
I still would need to wait a bit for the perfect timing scenario to to playout but I identified some other confluences that suggest i could make an exception here and enter so using a bit of discretion, we'll see how it plays out. Am still confident in the setup.
