Tia bounce back to $1.550Just recently opened a long position on tia
Sl: 1.453
Aiming for $1.550
2 RR trade
Related pairs

Long Tia/usdtThe long correction on LSE:TIA might finally be over.
The price just completed a classic corrective pattern and tagged a major 4H support zone.
As long as this demand area holds, the outlook is bullish. Watching this one very closely for a long entry.
LSE:TIA #TradingSetup #nfa

TIAUSDT 12H#TIA has formed a symmetrical triangle on the 12H timeframe. Consider buying here at the current price and near the support level of:
🛡 $1.700 (which is approximately aligned with the 12H SMA100)
In case of a breakout above the triangle resistance, the potential targets are:
🎯 $2.077
🎯 $2.314
🎯 $2.

Celestia (TIA): Looking For Break of 100 EMA | BULLISH PLAYTIA is once again pressing against the 100EMA, a level that has been rejecting the price multiple times in the past.
If buyers manage to secure above, it could finally unlock the path toward the upside targets.
The game plan is clear: stay patient until we get that clean confirmation (which can hap

TIA Swing Long OpportunityTIA Swing Long Opportunity
📊 Market Sentiment
Market sentiment is bullish, fueled by the FED restarting rate cuts. We’ve seen a 0.25 BPS cut in September, with expectations for two more consecutive 0.25 cuts in the coming months. In addition, institutional liquidity flow into crypto has increase

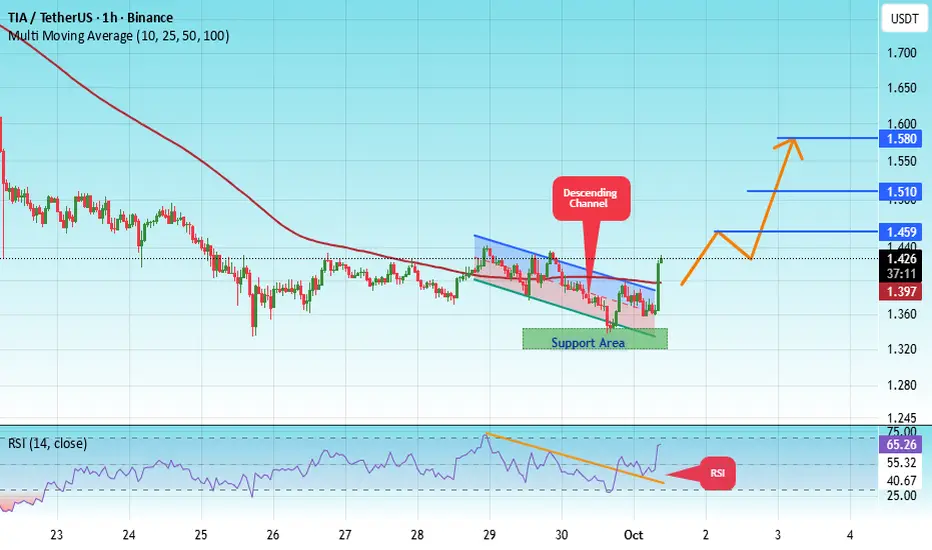
#TIA/USDT Long Opportunity#TIA
The price is moving within a descending channel on the 1-hour frame, adhering well to it, and is heading for a strong breakout and retest.
We have a bearish trend on the RSI indicator that is about to be broken and retested, which supports the upward breakout.
There is a major support area i
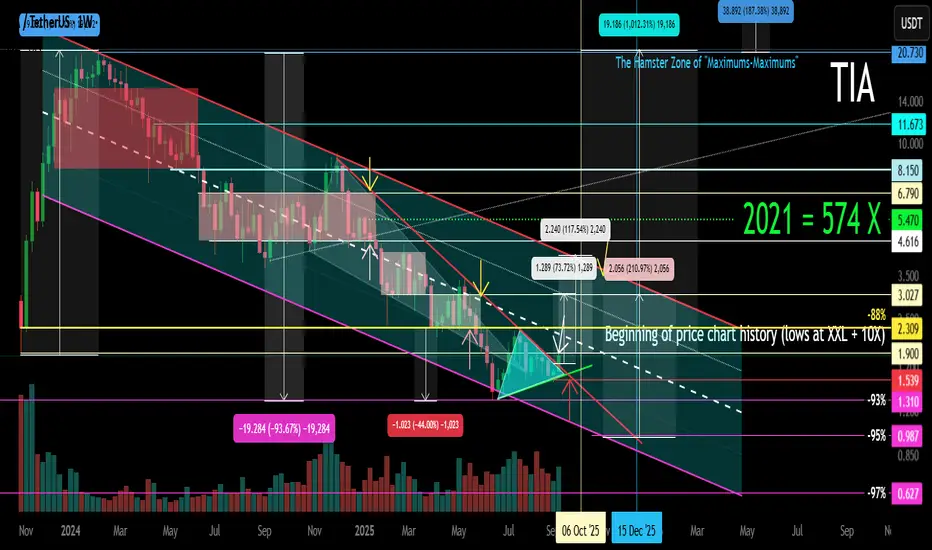
TIA (Celestia) XXL Main Trend Channel. Now +10X 13 09 25The price entered the 10X profit zone of crypto funds on 09 2025.
🟣 Locally , a symmetrical triangle formed under the downward trend.
🟢 Breakthrough — a trend break and movement to the resistance of the downward channel.
🔴Not a breakthrough — further immersion, after all, now the price is

TIA momentum crazy good!!!Just several pips to go. And surely it will be in this market situation and TIA will go super quick to 3usd minimum super easy and super quick!

TIAUSDT UPDATE#TIA
UPDATE
TIA Technical Setup
Pattern : Bullish Falling Wedge Breakout
Current Price: $1.83
Target Price: $2.45
Target % Gain: 35.38%
Technical Analysis: TIA has broken out of a bullish falling wedge on the 4H chart, with strong momentum after reclaiming trendline resistance. The breakout is s

See all ideas
Summarizing what the indicators are suggesting.
Oscillators
Neutral
SellBuy
Strong sellStrong buy
Strong sellSellNeutralBuyStrong buy
Oscillators
Neutral
SellBuy
Strong sellStrong buy
Strong sellSellNeutralBuyStrong buy
Summary
Neutral
SellBuy
Strong sellStrong buy
Strong sellSellNeutralBuyStrong buy
Summary
Neutral
SellBuy
Strong sellStrong buy
Strong sellSellNeutralBuyStrong buy
Summary
Neutral
SellBuy
Strong sellStrong buy
Strong sellSellNeutralBuyStrong buy
Moving Averages
Neutral
SellBuy
Strong sellStrong buy
Strong sellSellNeutralBuyStrong buy
Moving Averages
Neutral
SellBuy
Strong sellStrong buy
Strong sellSellNeutralBuyStrong buy
Displays a symbol's price movements over previous years to identify recurring trends.
Frequently Asked Questions
The current price of TIA / UST (TIA) is 1.45430000 USDT — it has fallen −0.77% in the past 24 hours. Try placing this info into the context by checking out what coins are also gaining and losing at the moment and seeing TIA price chart.
TIA / UST price has fallen by −7.06% over the last week, its month performance shows a −14.51% decrease, and as for the last year, TIA / UST has decreased by −73.76%. See more dynamics on TIA price chart.
Keep track of coins' changes with our Crypto Coins Heatmap.
Keep track of coins' changes with our Crypto Coins Heatmap.
TIA / UST (TIA) reached its highest price on Aug 11, 2024 — it amounted to 7,777.00000000 USDT. Find more insights on the TIA price chart.
See the list of crypto gainers and choose what best fits your strategy.
See the list of crypto gainers and choose what best fits your strategy.
TIA / UST (TIA) reached the lowest price of 0.10000000 USDT on Nov 26, 2024. View more TIA / UST dynamics on the price chart.
See the list of crypto losers to find unexpected opportunities.
See the list of crypto losers to find unexpected opportunities.
The safest choice when buying TIA is to go to a well-known crypto exchange. Some of the popular names are Binance, Coinbase, Kraken. But you'll have to find a reliable broker and create an account first. You can trade TIA right from TradingView charts — just choose a broker and connect to your account.
Crypto markets are famous for their volatility, so one should study all the available stats before adding crypto assets to their portfolio. Very often it's technical analysis that comes in handy. We prepared technical ratings for TIA / UST (TIA): today its technical analysis shows the sell signal, and according to the 1 week rating TIA shows the sell signal. And you'd better dig deeper and study 1 month rating too — it's sell. Find inspiration in TIA / UST trading ideas and keep track of what's moving crypto markets with our crypto news feed.
TIA / UST (TIA) is just as reliable as any other crypto asset — this corner of the world market is highly volatile. Today, for instance, TIA / UST is estimated as 6.92% volatile. The only thing it means is that you must prepare and examine all available information before making a decision. And if you're not sure about TIA / UST, you can find more inspiration in our curated watchlists.
You can discuss TIA / UST (TIA) with other users in our public chats, Minds or in the comments to Ideas.