SA TOP AnalysisI see this as an insight ti what is happening with the South African economy. Lets have a look:
Trade ideas

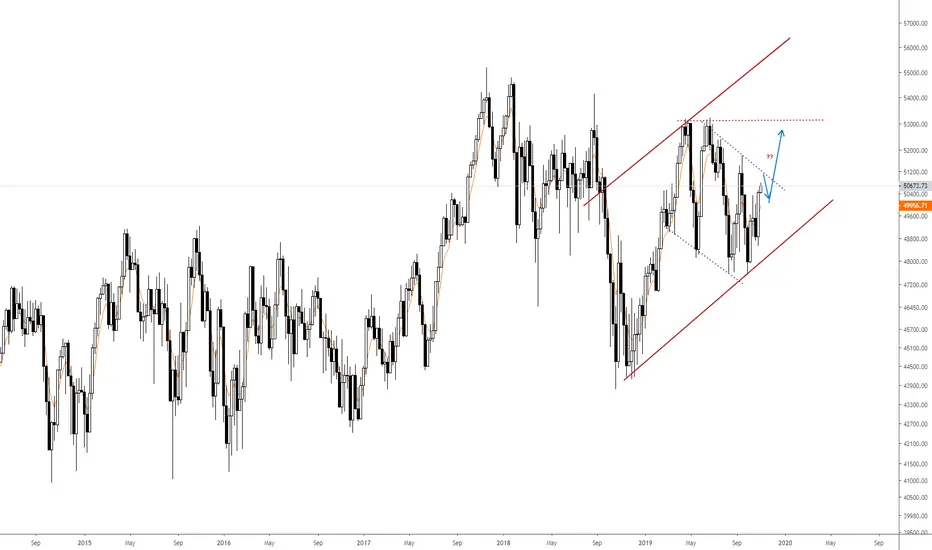
TOP40 - Resistance HeldWe may derive the following from the Weekly J200 chart:
1. Price remains bearish - as currently seen by the rejection at the orange box.
2. It is probable that price will continue to the downside until reaching the support trend line.
3. Wait for an opportunity to present itself. And as always - maintain your risk.
Note: The views provided herein do not constitute financial advice.

Indices | JSE Top 40 J200 The current technical setup is reminiscent of the August 2018 period where we saw the index break to the upside a bullish flag formation, producing a 5% move on the break. At current levels, the price is around 4.6% above the breakout level, with a slight overshoot and test of the resistance trend line going back to November 2017. We are also 9.3% (or 4400 points) up from the 4-December-2019 lows. Keeping an open mind for a potential retracement.

J200 - TOP40JSE:J200
Strong weekly candle clearing previous resistance.
Next target is 55.000 but will probably higher than that.

J200 weekly chart j200 has been ranged bound between 48000 - 53000 for the year so far in 2019.
So far in the last 3 months, a triple resistance around the 51900 area has formed and a break above this with a weekly close can be very significant.
In the broader picture there is also a massive Inverted HS pattern forming which began in april 2014. neckline for this would require a break above 53300 to confirm.

JSE Top 40 Index - SpotIndices | JSE Top 40 Spot | Weekly Chart | Flash Chart
An Alternative View: Price action a mirror image of the late August 2018 period. Another false breakout?

69% Chance of a Santa Claus Rally on the JSE in 2019Go to Google, Bloomberg, Business Times and you’ll see big debates between nations talking about this rally.
This sparked my curiosity to see if we could also see a stock market rally on the JSE this year.
Today I’m going to tell you what the Santa Claus rally is, why it exists and how you have a 69% chance to profit from the JSE this December.
Let’s get to it…
Why you can see a sudden stock market rally at Christmas time
The Santa Claus rally, in a nutshell, is when stocks see sudden price rises and strong gains near the end of December and in early January.
And when stocks rally, this drives up the actual stock market indices as well.
According to the 2019 Stock Trader’s Almanac, there’s an average 1.3% market rally in stocks, during this time that has taken place 75% of the time since 1969.
We are not 100% sure why the stock market ends positive during the last few days of the year, but here are some common theories.
Theory #1: Investment managers cut down on their taxes
This is the time when you’ll see investors and investment managers, selling their stocks to lock in tax reductions before the end of the year.
Once they sell their positions, they then buy other stocks and markets that they believe will rally in the next year.
The buying of these stocks, leads to a rise in stock prices which pushes the stock market indices up.
Theory #2: Investors treat themselves with their bonuses
Investors tend to splurge at the end of the year on stocks with their bonuses they’re paid at the end of the year.
And when there’s buying, demand picks up which leads to higher stock market prices.
We can speculate all we want, but nothing tells us the truth more than what the charts show.
What you see, is the monthly JSE-ALSI stock market chart since 2003…
Looking at the chart you can see how each December (Vertical blue line) performed from 2003 up ‘till 2018.
Year Gain/Loss
2003 7.39%
2004 1.28%
2005 6.84%
2006 3.90%
2007 -4.99%
2008 0.51%
2009 2.62%
2010 6.69%
2011 -3.26%
2012 2.72%
2013 3.27%
2014 -0.53%
2015 -1.15%
2016 0.48%
2017 -1.33%
2018 4.63%
So, there’ve been 11 out of 16 Decembers (69%) that have shown positive gains. And in total, the JSE has accumulated 29.07% gains in all of those Decembers.
This means, you have a higher chance of profiting from buying this Christmas than selling.
Trade well,
Timon Rossolimos
Founder, TimonAndMATI.com

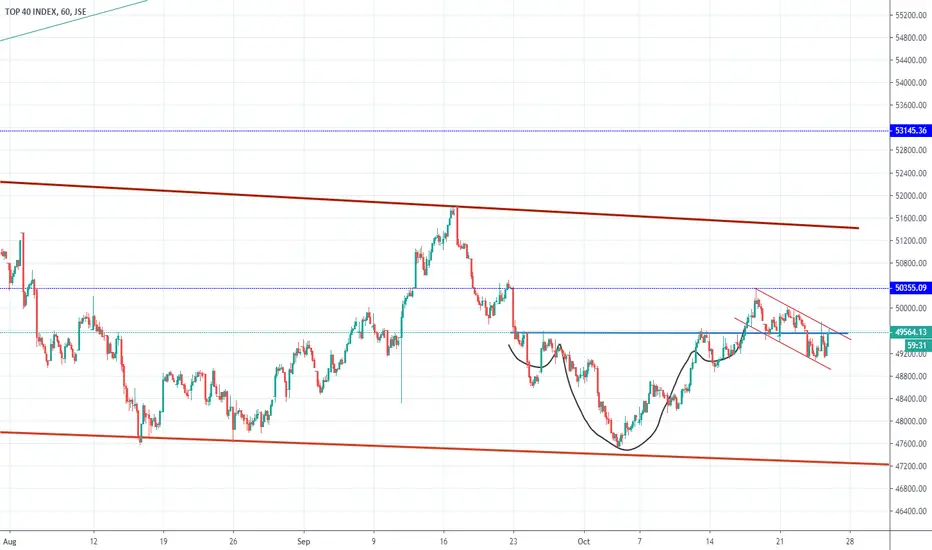
JSE Top 40 J200Indices | JSE Top 40 Index: The week ended 06-Dec saw the index rebound off the trend line support going back to the 22-October-2018 lows. In a similar fashion to the price action seen during July to September 2018, it’s possible that a rebound toward the channel highs come takes place before a further moderation of the price. Resistance levels are 49777, followed by 50100 while the major short term support zone is 48215. At current levels, the price also finds itself below the 40-week and 200-day moving averages.


JSE Top 40 SpotIndices | JSE Top 40 Index: “When in doubt in, zoom out” and that’s what I did. Since markets have been trading in a fairly choppy manner, I thought we’d take a look at the weekly chart to provide a bigger picture perspective of where things stand. Upon review, it makes sense to have studied the prior price setup which took place during the week of 25 September 2018 where we saw a breakdown of the long term trend line subsequent to a large bearish candle.

Top40: aiming for 48500?Upside price momentum is busy fading away.
Testing its 200-day simple moving average.
A break below the 200-day will set the long-term trend to bearish.

JSE:J200 Top 40 Institutional SellingLooking at a weekly chart it seems that we are in distribution that has started in 2015. We now see volume off the tops of the Last Point of Supply (LPSY). There are Signs of Weakness (SoW) and change of character in the background. I break below the yearly pivot point which should be tested this week could result in significant declines.

7 Nov 2019 - JSE ALSI 40 - Long - W Formation FEEL PRIDEThere are many aspects to celebrate the JSE rising...
Technically we have a breakout above the W-formation, break up above the downtrend for the first time since may and end of the year buying before year-end.
Fundamentally we have a couple of reasons to feel pride:
1. JSE Is tightening with the regulations with the listing requirements
2. Leila Fourie stepped in as CEO in early October which has sent the JSE flying over 8%
3. We dodged the junk status by Moodys (Baaa3)
4. US and China seem to be entering a compromise part of the relationship with cutting down on tarriffs and offering 20-40-50bn worth of farm goods.
5. We won the Rugby WOrld Cup (32:12)
6. #ImStaying grew to over 860,000 members
Anyways, the charts are what makes us take the trade - everything else is just fun confirmation.

TOP40 October was a great month, but....October proved to be a good month, but we are getting close to overhead resistance. Need to keep our eyes on the ball this November & December. Maybe time to lock in "some" profit into strength and consolidate as we anticipate the next set up. Protect you trading commodity (money) always the first priority. This does not mean we can't go higher, just that I anticipate the risk reward to become less as we move closer to overhead resistance.

J200 - Weekly Chart channelsThe weekly J200 top 40 index chart is still trading in a shorter term down trend channel that began during may 2019 up until now.
However the bigger uptrend is still intact from the lows of October 2018 And I would suspect that if we get a strong weekly close above 51500 it should open up room to move to 53200
SA40 SouthAfrica Top 40Index and LBLS indicatorSA40 looks to be bullish as per the LBLS longbuylongsell indicator.
The candle is blue and it has good strength .
As per the LongBuyLongSellIndicator Script this looks to be more positive.
Here is the script i have used for my analysis,try it out

JSE TOP40 Looking like it want to go pacesSome wild daily swings on the TOP 40 in the last couple of days. Longer term however it looks like it building some bullish formations that cannot be ignored. Inverted head and shoulders and now what looks like a bull flag. Let's see where this one is headed.
JSE:J200 Top 40 a Turn for the WorstThe Top 40 has previously found support at the yearly pivot point. After a rally, there has been a rejection of the 200Day MA. Volume is decreasing on rallies and increasing on declines indicating the selling pressure. It does not seem that the 200Day MA will hold again.


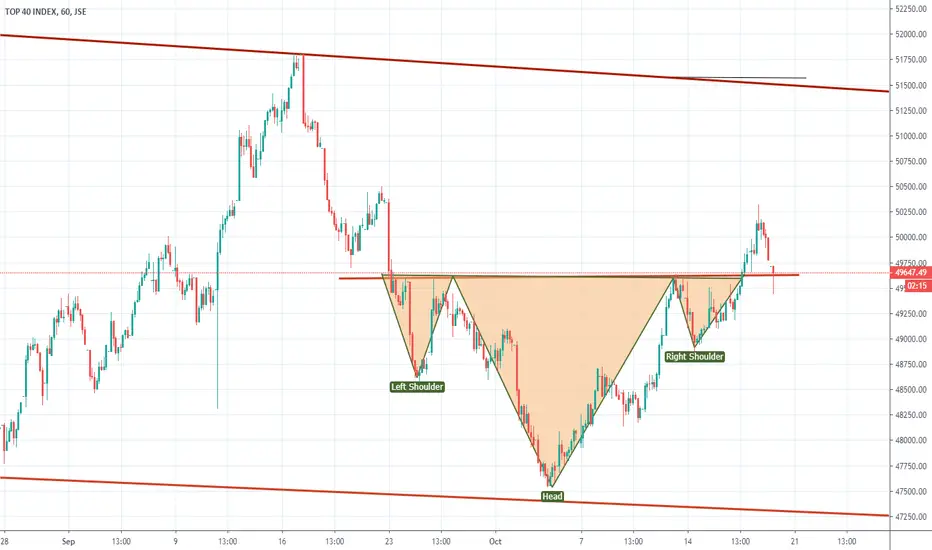
#JSETOP40 TOP40 Neckline test on a head and shouldersBigger picture is a neckline test on the TOP40. If this level hold, more upside to follow. If it fails, it could be followed by a quick selloff as longs scramble to get out.

#ALSI Possible inverted head and shoulders building Possible inverted head and shoulders building on the All Share Index. Could take some time to resolve the neckline however. A break could take us to the top of this multi year channel.

JSE Top 40 Index (Spot)JSE Top 40 Index (Spot): The index has advanced strongly from our last buy/long call on 03-October at 48232. While we saw the index dip slightly lowers, spending a day or two below the recommended buy zone, the 'swing' higher eventually unfolded with a very strong move higher throughout the course of last week. At current levels, the candle structure remains strong although I am less enthusiastic to call a buy/long at current levels that I was 11 days ago. Which levels to watch? I see 49700 as a resistance zone with the 200-day MA at 49832 just above that. Following that 50066 may also act a a short term cap. Fresh longs, I would wait for the price to pull back to 48650 for a new short term entry. The RSI has recently crossed over into bullish territory and now trades at 52 while turning up.
