DXY I Monthly CLS range - Model 1- TP discount LQHi friends, new range created. As always we are looking for the manipulation in to the key level around the range. Don't forget confirmation switch from manipulation phase to the distribution phase to make the setup valid. Stay patient and enter only after change in order flow. If price reaches 50%

DXY is making perhaps the final pull-back before a massive rallyThe U.S. Dollar index (DXY) has been trading within a Channel Up since the March 2008 bottom during the U.S. Housing Crisis. This is not the first time we use this pattern to identify key macro trend shifts, in fact we revisited it a little over 2 months ago.
The incredible symmetry it's been show

04.12.25 Daily ForecastPairs on Watch -
FX:EURUSD
FX:GBPUSD
A short overview of the instruments I am looking at for today, multi-timeframe analysis down to what I will be looking at for an entry. Enjoy!

05.12.25 Daily ForecastPairs on Watch -
FX:EURUSD
FX:AUDUSD
A short overview of the instruments I am looking at for today, multi-timeframe analysis down to what I will be looking at for an entry. Enjoy!

Buy DXYBuy Dollar. DXY coming off support after printing an symetric abc consolidation is a strong buy signal for the dollar now, i am waiting for the dollar to start rising again for days for a anticipated bearish stock structure to unfold...

Dollar Breaks The Wedge Support As SP500 Eyeing More UpsideHey guy, hope everyone is doing well.
As you know, we have seen some minor pullback on stocks yesterday as JPY come up a bit, after some hawkish remarks from BOJ Ueda. And at the same time cryptocurrencies also experienced a pretty sharp sell-off. But I believe these are all just temporary flows a

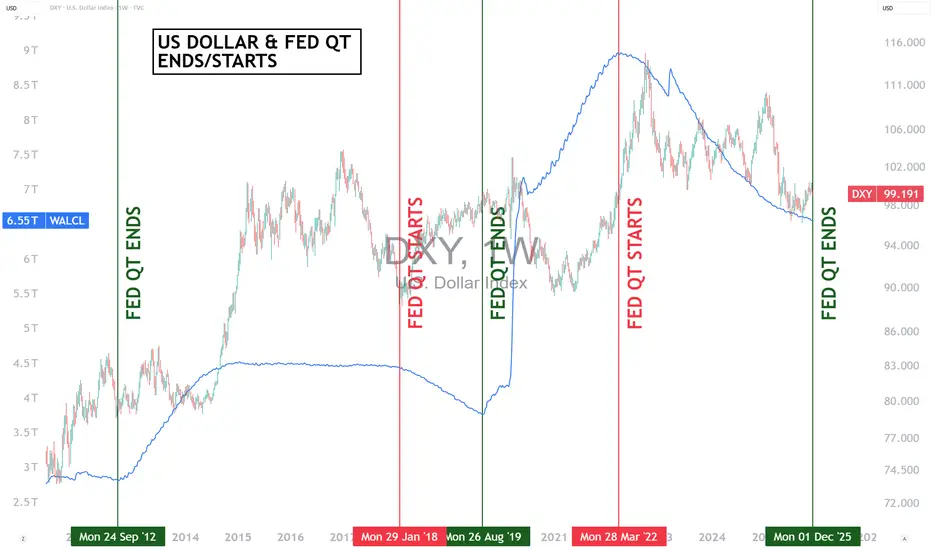
End of the Fed’s QT: What Impact on the US Dollar?Since Monday, December 1, 2025, the quantitative tightening (QT) program initiated in 2022 has been halted. The evolution of the Federal Reserve’s balance sheet has always had a major impact on financial assets, particularly in the FX market. Through which mechanisms? And what impact should we expec
US Dollar Plunges into December as DXY Threatens September RallyThe US Dollar plunged more than 1.3% off the November highs after DXY turned from pivotal resistance last week at 100.15/35- a region defined by the 2024 low, the August high, and the 2024 low-close. The losses are now threatening to break the September uptrend, and the focus is on today’s close wit

DXY: Dollar Index Mid-Term OutlookThe U.S. Dollar Index is maintaining a steady corrective rhythm on the 4-hour timeframe, with recent price behaviour indicating a potential shift in momentum as markets transition into December. Current swings highlight an evolving structure where buyers and sellers continue to balance out ahead of

DXY holding longs after correction-on my pairs with US dollar I'm still long for the following weeks. After It's correction the dollar should continue It's long movement.
I'm holding my longs on USD/CAD, USD/CHF, USD/JPY, GBP/USD.

See all ideas
Displays a symbol's price movements over previous years to identify recurring trends.
Frequently Asked Questions
Dollar Index reached its highest quote on Sep 28, 2022 — 114.715 USD. See more data on the Dollar Index chart.
The lowest ever quote of Dollar Index is 78.910 USD. It was reached on May 8, 2014. See more data on the Dollar Index chart.
Dollar Index is just a number that lets you track performance of the instruments comprising the index, so you can't invest in it directly. But you can buy Dollar Index futures or funds or invest in its components.