Will the US Dollar Run?Here we have a classic invert head and shoulders in validated if we take out the previous higher lows, but with how things are going, I don't see that happening, especially with Trump being in office you can argue all you want, but the charts don't lie
DXY trade ideas

DXY Drops to Price Lows.DXY looks bearish on the M30 timeframe due to resistance pressure around the 97.681 area. Price seems to be falling toward 97.198 with a price target of 97.279 and a bias toward 96.988.
Happy Trading,
K.
Not trading advice

DXY vs. EURUSD – Pre-FOMC DivergenceDollar Index (DXY)
Yesterday’s move was fully absorbed inside a tight range, leaving the internal range high at 99.804 ahead of the Fed meeting.
Liquidity is at 98.00 stacked above that zone; market makers could easily run the stops toward the 98 handle before any larger downside move.
EURUSD
Meanwhile, EURUSD broke out of its major range, giving us a new weekly structure with a key reference low at 1.13914.
Cross-Market View
This sets up a classic divergence:
Dollar – trapped in a premium sell range, heavy liquidity overhead.
Euro – fresh upside structure.
For cross-pairs this often means sharp pullbacks or erratic price action as we approach the FOMC decision.
Trade Notes
Stay nimble and keep stops tight.

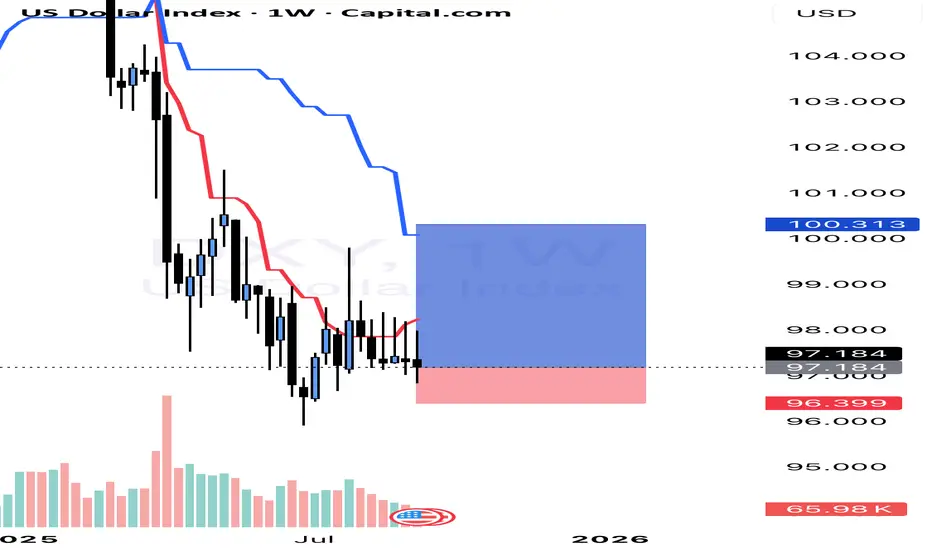
BULL RUN IS NEAR TO OVER! We are at the last stage of this bull run in my opinion. Now everything will go crazy.
Always when TVC:DXY hits its major context support, the bullrun is over
IMO the green box will be the area to sell and run from crypto as fast as possible! Around $94! #btc #altseason

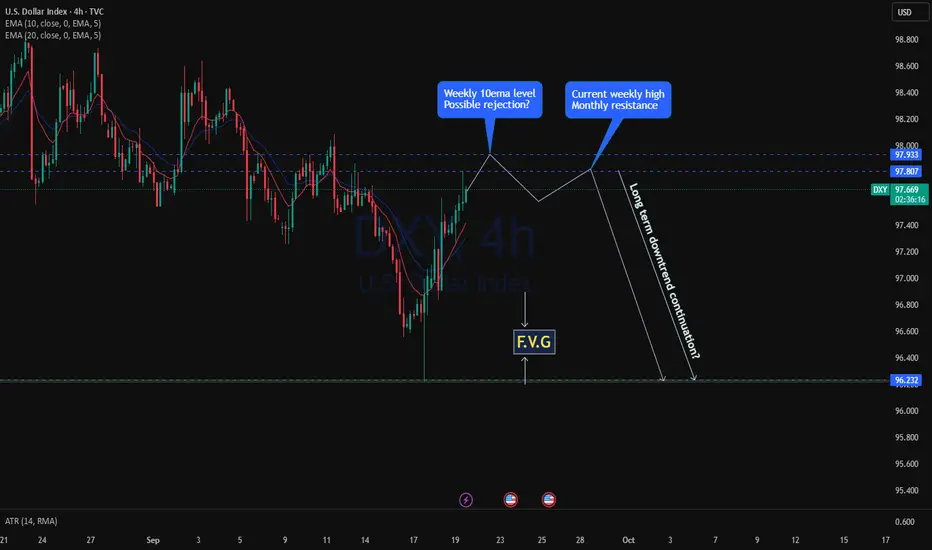
DXY is setting for another dropPre FOMC move on DXY bearish as with 0.25% to 0.5% rate cut decision as significantly impacted dollar index which on press conference, price finally rejected from the lower level 96.20
As with the weekly close coming in few hours, price approaching another key level of resistance, weekly and monthly giving a high probablity to reject back again to the support level as the resistance consist of 3 higher timeframe confulences, monty and weekly resistance alogn with weekly 10ema combining with break of series of lower highs and break of the combinations could lead the price to drop to the support. at 96.20

dxy-1Ddollar index has a bearish gaurd to close it's cycle and sweep the liquidities to provide its fuel to form new HHs...

Head and Shoulders Pattern on U.S. Dollar Index (DXY) – Bearish Overview of the Idea (as shown in the chart)
The chart illustrates a Head and Shoulders (H&S) reversal pattern forming on the U.S. Dollar Index (DXY). This classical technical pattern signals a potential trend reversal from bullish to bearish.
Left Shoulder: The first peak followed by a pullback.
Head: A higher peak, forming the top of the pattern.
Right Shoulder: A lower peak compared to the head, roughly equal to the left shoulder.
Neckline: A support line connecting the lows between the shoulders. Once broken, it indicates potential bearish continuation.
The chart highlights:
A breakout below the neckline.
A retest of the neckline (common in H&S setups, where old support becomes resistance).
A projected downside target aligned with the height of the head-to-neckline move.
Detailed Analysis
1. Pattern Identification
The H&S is clear: higher high (Head) flanked by two lower highs (Shoulders).
The neckline is slightly ascending, but once broken, it signals sellers stepping in.
2. Breakout Confirmation
Price broke below the neckline, confirming the bearish pattern.
The retest at ~97.62 shows rejection, strengthening the bearish outlook.
3. Bearish Projection
Technical rule: the expected downside target is approximately equal to the distance from the head to the neckline, projected downwards from the breakout point.
The chart projects a move toward 97.25, which aligns with the marked support zone.
Timing
The projection points to Monday, 15/09/25, suggesting this bearish move may unfold in the upcoming trading sessions.
Walkthrough Thought Process
Think of the market like a battle between buyers and sellers:
The buyers pushed price higher (Head), but then failed to sustain strength at the right shoulder.
When price breaks the neckline, it shows sellers are gaining control.
The retest confirms that what was once support (neckline) has now become resistance.
This setup gives traders confidence to enter a short (sell) trade, targeting the projected downside.
Trade Idea
Entry : After retest rejection around 97.62.
Target (TP) : 97.25 (support zone based on H&S projection).
Stop Loss (SL) : Above the right shoulder at 97.80 (to protect if pattern fails).

DXYDXY has got a potential to give us correction and push up if FOMC will be dropping the Dollar.
Disclosure: We are part of Trade Nation's Influencer program and receive a monthly fee for using their TradingView charts in our analysis.

Dollar Index (DXY) – Watching Both Sides LiquidityOn the daily timeframe, we can clearly identify liquidity resting on both sides of the chart:
Relative equal lows acting as sell-side liquidity.
Low-resistance highs representing buy-side liquidity.
From my perspective, the main draw on liquidity remains the sell-side lows. However, before targeting that area, price may first reach higher to grab the buy-side liquidity. Once this liquidity is collected, I expect a potential shift in momentum and a move to the downside.
💌It is my honor to share your comments with me💌
🔎 DYOR
💡Wait for the update!

DXY Weekly Fundamental factors: The US domestic economy and the imposition of additional tariffs on consumer goods from China and Russia, as well as the confidence building of global opinion that the US will not start a war, all of these factors can help the index grow.
Technical factors: The oversold situation and the gap between the Keysin and Tensin lines increased, as a result, there is a possibility of price growth.
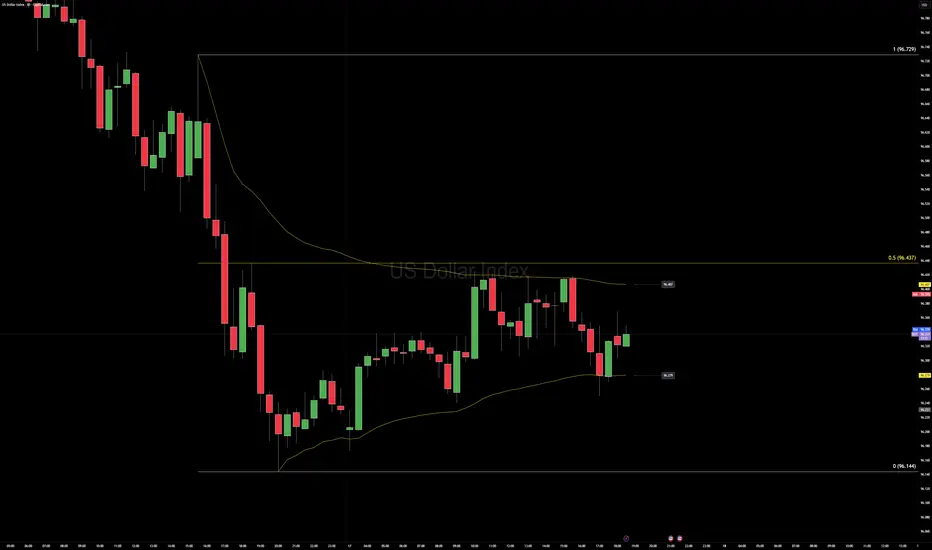
Dollar Index (DXY) – Pre-FOMC Rangebound PlayPrice is boxed between 96.20 and 96.40 as market makers build volume on both sides ahead of the Fed.
Key Levels
• 96.40 – top of the current node, first spot for squeeze fuel.
• 96.20 – base of the range, stop pockets just beneath.
Until the statement drops, expect tight, whipsaw action—classic pre-FOMC positioning. Patience over prediction.
The dark situation of the Dollar Index never endsThis week is the most important week of 2025, and the dollar’s situation is not good at all. It’s unclear what will happen by the end of the week with all the news coming out, and there’s a high chance that all our analyses — whether on coins, gold, or currency pairs — could turn out to be fake. ✅


Dollar Weekly WrapThe dollar ripped to fresh lows early in the week on the FOMC spark and is now set to close with a heavy bearish rejection candle.
Next week’s macro stack:
Tue – U.S. PMI flash
Thu – Q2 GDP final and Durable Goods
Fri – Personal Income/Spending and PCE
Price sits just below a five-week liquidity shelf around the 98.00 area.
Technically the market is oversold near the lower range, so high probability to target next week 98ich highs and lower on cross pairs. lets see how it will play out!

Dollar Bloodbath = Risk On Assets Rally?Dollar Fundamentals:
The dollar posted modest gains on Friday due to higher T-note yields, which have strengthened the dollar’s interest rate differentials.
The University of Michigan US Sep consumer sentiment index fell more than expected to a 4-month low causing the weakening of the dollar.
Limiting the upside in the dollar are the increased expectations for Fed easing through year-end. The dollar is also being undercut by concerns over Fed independence, which could prompt foreign investors to dump dollar assets as President Trump attempts to fire Fed Governor Cook, and by Stephen Miran’s intention to be a Fed Governor.
What Can We Expect Going Forward?
- Due To High Resistance Over Multiple Weeks, There Will Be Massive Levels Volatility, Aiming To Trap The Retail Traders
- Next Week Wednesday Will Determine How Volatile Dollar Will Be. Anything More Than A .25 Basis Point Decline Will Cause Turmoil For Dollar.
- This Will Lead Risk-On Assets (e.g. GBPUSD, EURUSD, AUDUSD) Rallying Up Into Premium Arrays
Prices To Keep An Eye On:
- 99.078 (Last Line Of Defence)
- 96.377 Major Sellside Liquidity
- Medium-Term Draw To 95.716 - 94.313 HTF Array
GBPUSD
Fundamentals :
UK gross domestic product remained unchanged in July after growing 0.4% in June, the Office for National Statistics said, as manufacturing output, which makes up 9% of the economy, dropped by 1.3% on the month.
The BoE is widely expected to keep its benchmark Bank Rate unchanged on September 18, after a split decision to lower the rate to 4% in August.
What To Expect Going Into Next Week?
- Increased Volatility
- Trigger HTF Stop Losses
- Unusually High Levels Of Manipulation
Price Points To Keep A Eye On:
- 1.35950 Buyside Liquidity
- 1.36760 - 1.37036 Longer Term Premium Array
- 1.34458 Mean Threshold (Last Line Of Defence)

The Dollar Index situation in the past weekThere’s no doubt that the Dollar Index is still in a downtrend. During this decline — while moving inside a channel — it managed, thanks to the news, to break the channel’s ceiling with relatively weak momentum. The probability of a pullback to the channel’s ceiling or even a return inside the channel is high because the momentum is weak. In any case, we’ll have to see how the dollar starts the coming week. ✅

DXY (US Dollar Index) AnalysisPrice is currently trading near 97.60 – 97.90, which is a strong resistance zone.
I’ll be waiting for bearish confirmation here before expecting downside momentum.
🔻 If sellers hold this level, we could see DXY drop further, aligning with bearish pressure on USD across correlated pairs (EURUSD bullish, GBPUSD bullish, Gold bullish).
Key Levels:
🔴 Resistance: 97.60 / 97.90
🟢 Target Zone: 95.00
📌 Trading Plan:
Wait for rejection at 97.60 – 97.90 before entering.
Look for sell setups targeting 95.00.
Correlation: Bearish DXY supports bullish momentum in major USD pairs.
⚠️ Risk management is key. Always wait for confirmation before taking positions.

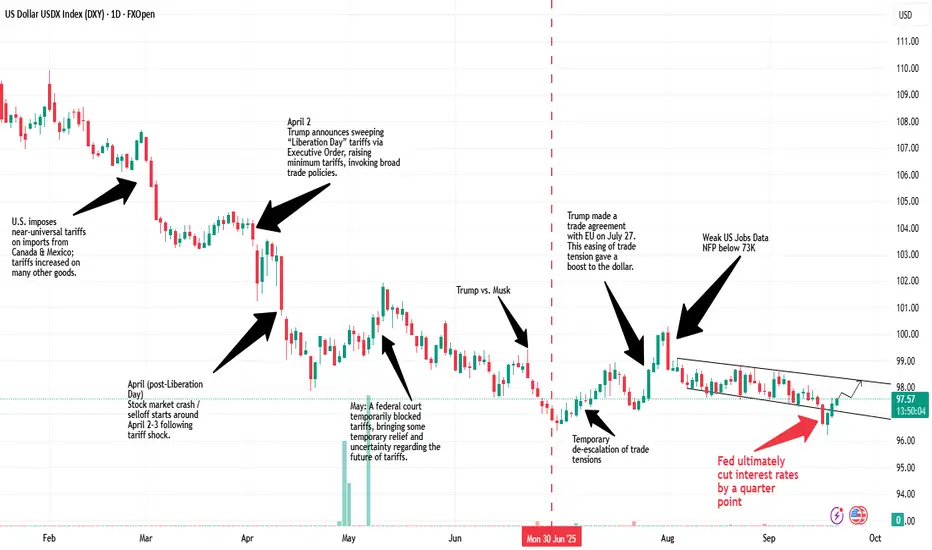
US Dollar Timeline: How Dollar is getting Destroyed Gradually The US Dollar Timeline: 2025
- The Dollar Index (DXY) has consistently weakened this year
- It fell more than 12.5% from the tops of 110 (Jan 2025) to the bottoms of 96.20, tested recently after Fed rate cuts.
DXY week 14/09/2025Even last week we close near to the NWOG, I still see a dxy under the 97 I don’t want to see dxy over the 97,800 I expect a reaction to the down side taking PDL and a retest to continue lower.

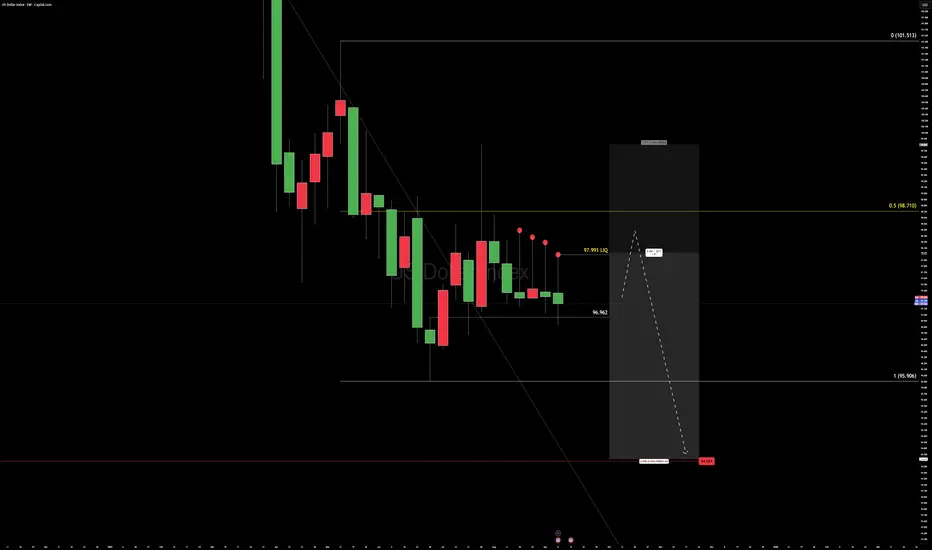
Pre-FOMC Crossfire US DOLLAR INDEXPre-FOMC Dollar War Map
The weekly chart just printed a fourth straight lower high—
a slow grind down while Friday’s close stayed red.
Liquidity is stacked behind us, perfect fuel if the desks want to run stops before the Fed.
Order flow shows massive resting bids around 96.962, the last structural block.
If that line cracks, expect the move to be fast and brutal.
Cross-markets are whispering the opposite:
equities, metals, and crypto are coiled to run if the dollar slips.
The headlines will call it a surprise.
It isn’t. The map was drawn weeks ago.
Focus on levels, not noise.
Trade the reaction, not the prediction.

DXY MONTHLY CHART- EVERYTHING SEEMS QUITE BULLISH!From the monthly timeframe, everything seems quite bullish. As traders are optimistic about dollar growth. Technically, price support bullish rebound as price is seen testing a very nice trendline. I expect a dovish USD
