Smart Money Positioning on US100 – Liquidity Flow ExplainedRepeated failed highs, deep liquidity sweeps, and a tightly trapped range — the US100 is showing textbook smart money behavior.
Let’s decode how liquidity pockets, fake breakouts, and institutional accumulation are shaping the next 600+ point move.
🧭 Market Story – Where We Are Now
The US100 has been in a broad liquidity cycle after a strong rally.
Price is consolidating within a re-accumulation or distribution phase, hinting that smart money is positioning quietly before expansion.
🔹 Key Liquidity Zones
🟩 Breakout Level – 25,600
The make-or-break point.
Holding above 25,600 = bullish continuation potential.
Losing it = likely sweep back into liquidity below.
🔵 Liquidity Pocket – 26,150 → 26,350
This zone is loaded with stop liquidity.
Multiple failed breakouts = engineered liquidity traps.
A decisive breakout with volume could unleash a sharp institutional expansion toward 26,600–26,800.
🔴 Weekly Low Zone – 24,660 → 24,610
Where the market performed a major liquidity sweep before reversing.
Strong reaction = signs of accumulation.
A revisit here could form the final liquidity grab before the next rally.
🧩 Structure Breakdown
Sweep of Lows → Reaction — liquidity collected below prior swing lows.
Box Phase → Accumulation or Distribution — institutions building orders.
Trendline Rejections → Liquidity Creation — every “failed attempt” tells a story.
Compression Phase → Expansion Loading — pressure building before the breakout.
⚖️ Possible Scenarios
🚀 Bullish Breakout
Price holds above 25,600
Clean break above 26,150–26,350 liquidity pocket
Expansion move likely toward 26,600–26,800
🩸 Bearish Liquidity Trap
Rejection from 25,600 → 24,823 / 24,660 zone
Final liquidity sweep before strong reversal
Watch for aggressive bullish recovery candles
💡 Institutional Insight
Each failed breakout isn’t weakness — it’s intent.
Smart money builds liquidity where retail enters wrong.
When both sides’ liquidity is consumed, true direction begins.
👉 Liquidity is not just a zone — it’s market psychology visualized.
🧠 Educational Takeaway
The US100 demonstrates the full liquidity cycle at work:
Sweep → Trap → Accumulate → Expand.
Every fakeout clears inefficiency and builds the fuel for the next impulse.
Don’t chase — track where liquidity builds and follow the flow.
📊 Final Thoughts
The index is coiling between 25,600 and 26,350 — volatility is loading.
Above → Expansion Phase (trend continuation)
Below → Liquidity Sweep Phase (bullish trap setup)
Patience > Prediction.
Let the liquidity tell the truth — not emotions.
💬 Your Turn:
Do you expect a clean breakout or another trap before lift-off?
Share your bias below — let’s discuss how liquidity might play it out!
Trade ideas

US NAS 100 BIG FALLPreferably suitable for scalping and accurate as long as you watch carefully the price action with the drawn areas.
With your likes and comments, you give me enough energy to provide the best analysis on an ongoing basis.
And if you needed any analysis that was not on the page, you can ask me with a comment or a personal message.
Enjoy Trading ;)

US100 REBOUND AHEAD|LONG|
✅US100 is approaching a defined demand level where discount pricing aligns with bullish order flow. A potential rebound may deliver price toward the imbalance above. Time Frame 5H.
LONG🚀
✅Like and subscribe to never miss a new idea!✅

US NAS 100Preferably suitable for scalping and accurate as long as you watch carefully the price action with the drawn areas.
With your likes and comments, you give me enough energy to provide the best analysis on an ongoing basis.
And if you needed any analysis that was not on the page, you can ask me with a comment or a personal message.
Enjoy Trading ;)

Nasdaq Battle between correction & innovationNASDAQ 100 (NDX)
Nasdaq 100 Index (NDX) currently sits at a crucial inflection point, defined by the overwhelming dominance of the technology sector's structural growth against a backdrop of increasing macroeconomic and technical vulnerability. After a historic rally driven by Artificial Intelligence (AI) euphoria, the market is undergoing a necessary and sharp correction, testing key support levels established during the latest bullish surge.
The Durable Foundation: AI, Earnings, and Profitability
The core bullish case for the NDX remains robust, fundamentally driven by the "Magnificent Seven" and the pervasive, non-negotiable surge in AI infrastructure spending. Unlike the speculative rallies of previous cycles, today's leaders are characterized by deep profitability, substantial cash flow, and diverse revenue streams.
Recent corporate earnings reaffirm this strength, with the technology sector posting strong double digit growth. This profitability suggests that investment in AI is being funded through internal cash flow, making the rally more sustainable than the debt fuelled expansion seen two decades ago. The long term trajectory is further supported by an accommodative Federal Reserve pivot, which is now in rate cutting mode a supportive contrast to the tightening cycle that ended the 2000 rally. The secular trend of technological innovation is accelerating, transforming AI from a growth narrative into an essential business imperative.
Macroeconomic and Sentiment Headwinds
Despite underlying corporate strength, recent market action signals a decisive sentiment shift rooted in macro uncertainty and high valuations. The index has experienced its steepest weekly decline since March, indicating heavy profit taking and a collective "reality check" among traders.
Several factors are contributing to this sentiment reversal:
1. Concentration Risk: The sheer weight of the largest components now represents an extraordinary percentage of the overall market capitalization, making the NDX acutely sensitive to volatility in just a few key names.
2. Labor Market Cooling: Data showing a significant spike in job cuts (particularly in the tech and warehousing sectors) has unsettled investors, suggesting that economic cooling is accelerating faster than anticipated.
3. Consumer Confidence: A sharp drop in consumer sentiment reflects heightened anxiety related to economic uncertainty and political instability, which historically dampens forward looking market optimism.
4. Valuation Concerns: While not at 2000 extremes, valuations remain elevated, shifting the market’s focus entirely from multiple expansion to demanding flawless execution and continuous earnings growth.
Technical Outlook: The Critical 25,000 Support Test
From a technical perspective, the NDX has been in a clear, rising trend channel over the medium to long term, confirming a persistent buy the dip mentality. However, the recent sell off has introduced significant short term caution.
The index is currently testing a non negotiable support zone around 25,000. This level is psychologically important and corresponds to a previous major breakout point. A decisive breakdown below this support could trigger a cascading sell off as automated stop loss orders are activated, potentially paving the way toward the next major supports at 24,500 and, more critically, 23,980.
Key Technical Levels:
• Immediate Support: 25,000
• Secondary Supports: 24,500, then 23,980
• Immediate Resistance: 25,200, followed by 25,500 and 25,700
Conclusion: Navigating the Volatility
Nasdaq 100 remains an index of unparalleled innovation and long term potential, yet its short term path is fraught with risk. The outlook hinges on the NDX's ability to hold the critical 25,000 support level. A bounce from this zone would confirm the resilience of the dip buyers and maintain the medium term bullish structure. Failure to hold this level, however, would signal a deeper technical correction is underway, shifting the focus to the lower support zones as the market cleanses its excessive exuberance. Traders should remain nimble, respecting the clear shift in short term momentum while maintaining conviction in the long term, secular growth of the technology giants.

Prepare for explosive move potential in US100
Market context
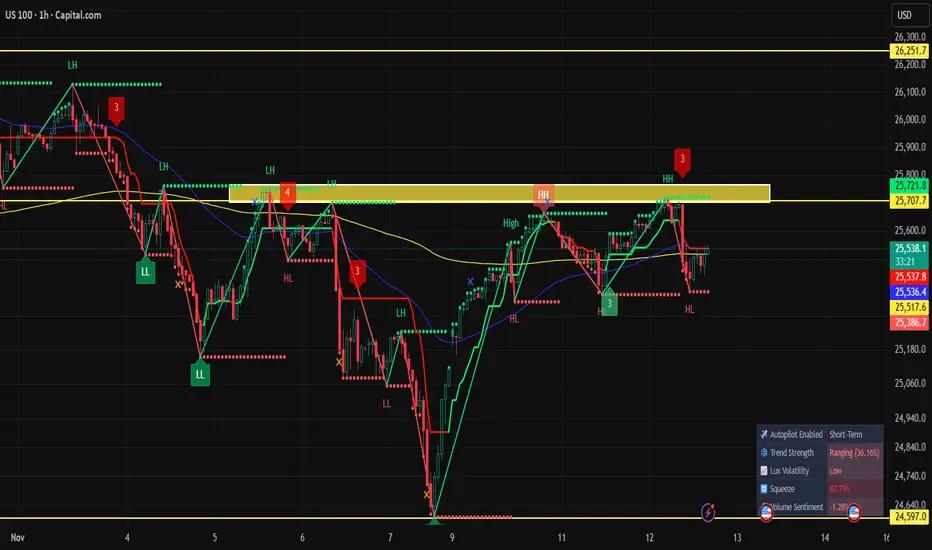
US100 has reversed the entire dump and is now coiling directly under a major supply band. Every pullback since the V-shaped bottom has formed a higher low and none of them have broken structure. Sellers keep defending the same yellow zone around 25700–25780 but each rejection has lost impact. That’s absorption.
The MAs aren’t rejecting price anymore. They’re flattening and starting to curl which usually shows the downtrend is done and the market is transitioning. Price is sitting in a tight range under supply with controlled candles instead of aggressive sell-offs. That’s exactly what you expect before a volatility expansion.
The squeeze being elevated here is the final piece. Low volatility coil under supply + higher lows + squeeze primed = pressure building. When the squeeze releases from this type of structure, it usually fires toward the side that’s been applying pressure. Buyers are the ones stepping in sooner each time, so the pressure is clearly up.
Clean liquidity is sitting above the recent HH inside and just above that yellow band. Everything on this chart points to that liquidity being taken first before anything else happens.
Key zones on US100
Support and demand
Major demand from the V reversal at 24600–24700
Intraday demand at 25100–25200
Most recent higher low structure around 25500
Resistance and supply
Main supply block (yellow zone) at 25700–25780
Liquidity sitting above the HH inside that band
Higher timeframe resistance at 26250
Structure
Higher lows stepping into fixed supply
Very low volatility coil
Squeeze primed
No LL since the reversal
Liquidity parked above price
Long setup through supply
This is the cleanest idea because the pattern is exactly what you want before an upside release: coiling, higher lows, weakening supply, squeeze loaded and obvious stops above.
What I need to see
A strong 1H close above the yellow supply block. Not a wick, an actual body close above roughly 25780. That confirms buyers finally cracked the ceiling.
Then a retest. Squeeze expansions often break then pull back once into the breakout zone to confirm it as support. That retest tells me it’s a proper breakout, not just a liquidity grab.
Entry
Retest zone for the long: 25730–25780
Trigger: a clean 15M rejection from that zone followed by a bullish close
Stop
Stop goes below the retest low and below the body of the old supply. Anything under 25600 is fine.
If US100 closes a 1H candle back inside the yellow zone after entry, I’m out immediately.
Targets
First target: 25900–26000
Second target: 26250
If the squeeze really opens up, US100 can run straight through those levels.
Short setup only if it becomes a sweep
I only consider a short when the breakout is fake. Coils like this usually break upward, but when they fake out, it’s violent. I want to be ready to flip quickly.
What confirms the sweep short
A spike above the yellow supply grabbing the HH liquidity, then a heavy rejection and a close back inside the zone.
Then US100 must break the most recent higher low on the 15M (around 25500). Without that break in structure, there is no short.
Entry
Short the underside of the yellow block on the retest or take the first clean 15M lower high after the structure break.
Stop
Above the sweep wick. If price trades above it again, the idea is dead.
Targets
First target: 25100–25200
Second target: 24800 area (origin of the V reversal)
Management and invalidation
Long idea
Valid as long as the last HL (around 25500) holds.
Lose that and I drop the long idea and prepare for the sweep short instead.
I am not trading the chop inside the range.
Short idea
Only valid after a sweep + break of structure.
Without both, I do not touch the short side because coils like this don’t normally break down first.
Summary
US100 isn’t showing weakness at all. It’s coiling under a ceiling with the squeeze loaded, volatility dying off and higher lows stepping into the same supply over and over. Sellers are defending one level and failing to push it down. That usually means the market wants the liquidity above the highs in the yellow zone. I’m looking to trade the break and retest long as my main setup. If it sweeps the highs, snaps back inside and breaks structure, I flip into the short. Otherwise I leave the range alone.
US NAS 100Preferably suitable for scalping and accurate as long as you watch carefully the price action with the drawn areas.
With your likes and comments, you give me enough energy to provide the best analysis on an ongoing basis.
And if you needed any analysis that was not on the page, you can ask me with a comment or a personal message.
Enjoy Trading ;)

Tech Sector Pauses|USNAS100 Awaits Direction Between 25430–25700USNAS100 | Overview
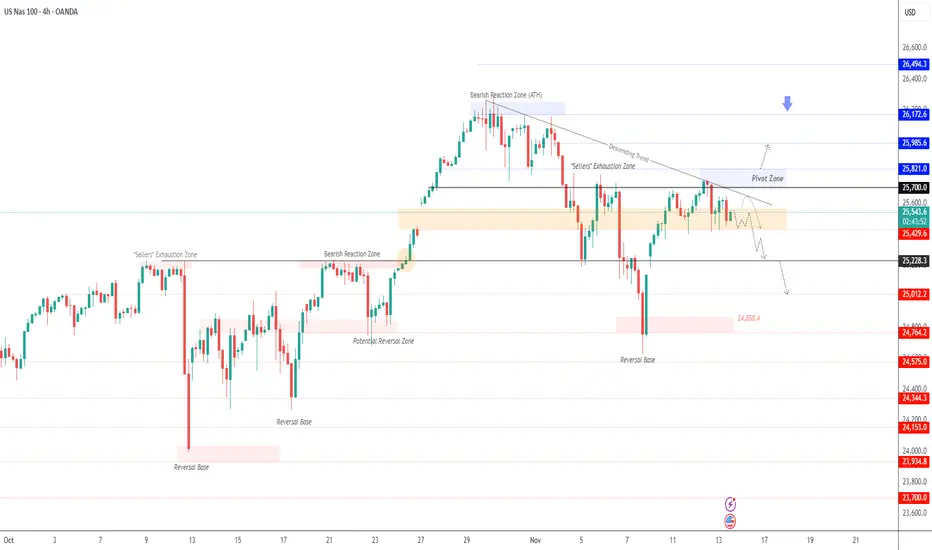
The price is currently consolidating between 25430 and 25570, showing a slight bearish bias as momentum weakens near resistance.
As long as the index trades below 25570 and 25700, the outlook remains bearish, with downside potential toward 25430 and 25220.
A confirmed break below 25220 would accelerate losses toward 25010.
However, if the price closes a 4H candle above 25700, it would signal a bullish reversal, opening the path toward 25820 and 25985.
Pivot Line: 25570
Resistance: 25700 · 25820 · 25985
Support: 25430 · 25230 · 25010
US NAS 100With your likes and comments, you give me enough energy to provide the best analysis on an ongoing basis.
And if you needed any analysis that was not on the page, you can ask me with a comment or a personal message.
Enjoy Trading ;)

Nasdaq Diverges From Dow Gains — Will It Follow?From a daily perspective, the Nasdaq is testing the upper bound of a parallel channel that has been respected since the August 2025. Price action previously broke to the mid-zone of the duplicated channel near 26,300, declined to the lower border of the original pattern near 24,650, and has since rebounded toward the upper edge around 25,700.
The scenarios from here are as follows:
• Bullish case: A confirmed hold above 25,700 could redirect gains toward 26,300, after which another bullish projection targets the upper boundary of the duplicated channel near 26,800–27,000.
• Bearish case: A drop back below 25,200 could pull prices toward 24,650, with further downside potential extending below the August–November support zone toward 23,900, 23,500, and, in extreme cases, 22,700.
As the longest U.S. government shutdown in history comes to an end, the Dow has extended its gains toward new records near 48,500, while the Nasdaq and S&P 500 remain in a neutral hold, raising questions about the sustainability of further highs in 2025.
Written by Razan Hilal, CMT

Nasdaq - The most important structure!💰Nasdaq ( TVC:NDQ ) perfectly respects structure:
🔎Analysis summary:
Over the course of the past couple of months, the Nasdaq has been rallying an expected +50%. Still, until the Nasdaq will retest the upper channel resistance trendline, this rally won't be over. Therefore, we can still see a rally of another +10% in the very near future.
📝Levels to watch:
$25,000 and $30,000
SwingTraderPhil
SwingTrading.Simplified. | Investing.Simplified. | #LONGTERMVISION

Nasdaq 100 Rebounds as Traders Anticipate End of the US ShutdownNasdaq 100 Rebounds as Traders Anticipate End of the US Shutdown
As the chart shows, the Nasdaq 100 index has started the week on a positive note amid growing expectations that the longest government shutdown in US history may soon come to an end.
According to Reuters, a bill has been introduced in the Senate proposing amendments to extend government funding until 30 January. The news acted as a bullish catalyst for equity markets. Still, the question remains – is the risk truly behind us?
Technical Analysis of the Nasdaq 100
Analysing the hourly chart of the Nasdaq 100 on 4 November, we:
→ Drew an ascending channel;
→ Noted signs of momentum exhaustion, as mentioned in our previous headline.
Since then, price action has evolved as follows:
→ The lower boundary of the channel provided support (1), prompting a brief rebound;
→ The 25,770 level acted as resistance (2) on two occasions, strengthening the bears’ confidence to push for a downside breakout — which ultimately succeeded.
The index’s subsequent movements have now more clearly outlined the formation of a descending channel (shown in red).
From the demand-side perspective:
→ After a false bearish breakout below 24,680 (showing characteristics of a Liquidity Grab pattern), the market staged an aggressive rally from point B;
→ Today’s session opened with a bullish gap, and the price has moved above the red median line.
From the supply-side perspective:
→ The 25,500 level, where sellers gained control during the previous channel breakout, may now act as resistance;
→ If the A→B move is viewed as an impulse, today’s rally appears to be a corrective rebound consistent with Fibonacci proportions — suggesting that downward momentum could resume within the red channel.
This article represents the opinion of the Companies operating under the FXOpen brand only. It is not to be construed as an offer, solicitation, or recommendation with respect to products and services provided by the Companies operating under the FXOpen brand, nor is it to be considered financial advice.

NAS100 Trade Set Up Nov 10 2025Price has shifted to bullish structure on the 1h so i will wait for price to sweep SSL or tap into bullish 1h FVG before looking for buys to target higher BSL

NAS100 Trade Set Up Nov 12 2025Price trading above PDH and has a daily gab above to fill but first i would want to see a sweep of London lows/SSL before looking for 1m-5m IFVG/CISD to continue higher to sweep BSL and fill the daily imbalance

US NAS 100Preferably suitable for scalping and accurate as long as you watch carefully the price action with the drawn areas.
With your likes and comments, you give me enough energy to provide the best analysis on an ongoing basis.
And if you needed any analysis that was not on the page, you can ask me with a comment or a personal message.
Enjoy Trading ;)

US100 – Bullish Reversal Setup-H4: Turning bullish with a new high at 25,667.
Pullback: Formed a lower high, now H1 shifting bullish again.
Plan: Looking for buys above 25,542, SL below last H1 LH.
Adjustment: If another H1 LH forms and breaks upward, trail SL for tighter risk.
-Fundamental: Shutdown-end hopes , supporting the bullish scenario.

Will NAS100 Sustain Its Bullish Momentum After the Pullback?NAS100 🚀 Bullish Swing Setup | SuperTrend Pullback & Layered Entry Strategy
🎯 TRADE IDEA: NAS100 (US100) BULLISH SWING
Capitalize on a structured pullback in the NASDAQ 100! This plan leverages a proven indicator confluence for a high-probability long opportunity.
📊 ANALYSIS & CONFIRMATION:
Trend: Primary Bullish Trend is intact. ✅
Trigger: Price is pulling back into a demand zone, offering a favorable risk-to-reward entry.
Indicator: The SuperTrend ATR Line is acting as dynamic support on the 4H/Daily timeframe. A bounce from this level confirms our bullish bias.
⚡ STRATEGY: "THE THIEF" LAYERED ENTRY
This method uses multiple limit orders to average into a position, perfect for volatile markets like the NASDAQ.
Entry Zone: Look for entries between 25,200 - 25,600
Layer Example:
🟢 Limit Order 1: 25,600
🟢 Limit Order 2: 25,400
🟢 Limit Order 3: 25,200
👉 You can adjust the number of layers and prices based on your capital and risk appetite.
❗ RISK MANAGEMENT:
Stop Loss (SL): A decisive break below 24,800 would invalidate the bullish structure.
⚠️ IMPORTANT NOTE: This is MY protective stop. Dear Thief OG's 👑, you MUST adjust your position size and SL based on your personal risk management strategy. Protect your capital first!
🎯 PROFIT TARGETS:
Primary Target: 25,600 (Initial resistance & profit-taking zone).
Key Reasoning: We anticipate a reaction here due to:
Moving Average resistance.
Potential overbought conditions on lower timeframes.
A "trap" for late buyers.
👉 Smart Move: Consider taking partial profits at 25,600 and trailing your stop for the remainder. Escape the trap with your profits! 💰
⚠️ REMINDER: Dear Thief OG's 👑, your Take Profit (TP) is your own decision. Secure gains based on your trading plan and market behavior.
🔍 RELATED ASSETS & MARKET CORRELATION:
Watching these related instruments can provide confirmation and a broader market view.
TVC:DXY (U.S. Dollar Index): 🟡 NEGATIVE CORRELATION
A weakening Dollar ( TVC:DXY DOWN) is generally bullish for Nasdaq. If the Dollar is falling, it adds confidence to this long thesis.
USTECH (CFD on Nasdaq 100): 🟢 DIRECT CORRELATION
Moves in sync with NAS100. Perfect for cross-verifying price action and volume.
NASDAQ:AAPL , NASDAQ:MSFT , NASDAQ:TSLA (Mega-Caps): 🟢 HIGH IMPACT
These heavily weighted Nasdaq components drive the index. Bullish momentum in these stocks supports a rising NAS100.
FOREXCOM:SPX500 (S&P 500): 🟢 POSITIVE CORRELATION
A strong S&P 500 often lifts the Nasdaq. Monitor for overall U.S. market strength.
💬 Let me know your thoughts in the comments!
What's your entry strategy for the NAS100 this week?
#NAS100 #US100 #TradingView #SwingTrading #Bullish #SuperTrend #TradingStrategy #IndexTrading #LayeredEntry #ThiefStrategy

Daq buyWhat is up ma friends? Happy Government reopen! Price flushed straight into a demand pocket after a steady selloff. The long triggers right as the candle sweeps the previous lows and snaps back. classic liquidity grab followed by an immediate reclaim.

US100 Support Ahead!
HI,Traders !
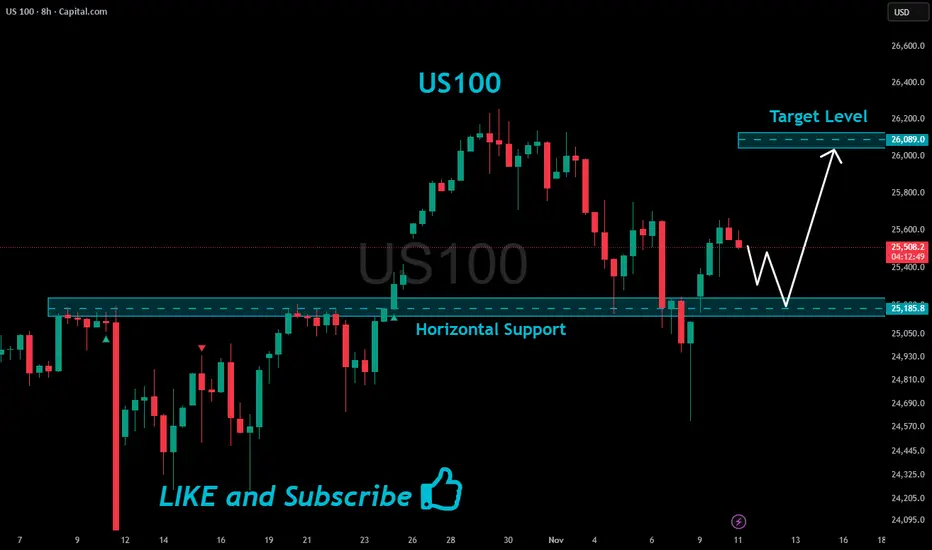
#US100 is making a local
Bearish correction but
We are bullish biased mid-term
So after the pair hits the horizontal
Support of 25185.8 we will be
Expecting a local bullish rebound !
Comment and subscribe to help us grow !
Nasdaq Short: Peak Confirmed; Bear Market ConfirmedIt is now clear that the bull market ended on 30th Oct and that we have already seen the first completed wave down for Nasdaq that unfolded in clear 5-wave structure. The sub-waves also showed clear 5-wave structure themselves.
We are currently in a wave 2 retracement that is facing the first real support-turned-resistance. However, take note that wave 2 can technically go all the way up to the start of wave 1 without invalidating the idea. So look out for reversal signal or confirmation before you short.

US100 Resistance Ahead!
HI,Traders !
US100 is making a
Nice bullish correction
After a sharp local flash-crash
But a local horizontal resistance
Level is ahead at 25185.8
So after the retest we will
Be expecting a local
Bearish correction !
Comment and subscribe to help us grow !

NASDAQ NAS100 Under Pressure – Watching for a Break of StructureThe NASDAQ is currently showing signs of weakness on the 4-hour chart. Sellers are gradually stepping in, and we can see US100 bearish momentum starting to take control. The market is under pressure, and price action is hinting at potential continuation to the downside.
I’ll be watching closely for a NAS100 break below the current range low — if price retests that level and fails to reclaim it, that would confirm a bearish market structure shift 🔻. Such a setup could provide a high-probability short opportunity as momentum accelerates to the downside.
⚠️ This is not financial advice — purely for educational and analytical purposes.

US100 (NASDAQ 100) – Short TradeSetup Type: Short Position
Entry: Around 25,650 (Resistance zone)
Stop Loss: 25,787
Target: 24,850
Analysis:
Price is retesting a key resistance zone after a strong impulsive move upward. A rejection from this level could indicate the start of a short-term correction. If bearish confirmation appears (e.g., lower high formation or bearish engulfing candle), short positions could be valid toward 24,850 support.
Bias: Bearish below 25,787
Invalidation: Break and close above 25,787
Hashtags:
#US100 #NASDAQ100 #PriceAction #TradingSetup #BearishSetup #TechnicalAnalysis #TradingView #SmartMoney #ShortTrade #Indices
