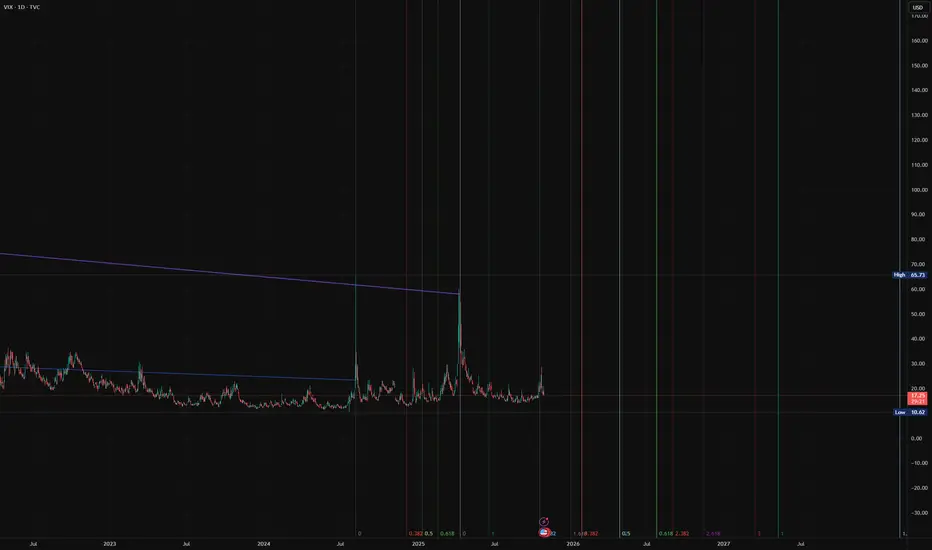
A scary fractal from 2020 Price is seeming to repeat what it did just before the covid crash. Seems like another massive VIX spike is coming soon.
About Volatility Index
VIX is a trademarked ticker symbol for the CBOE Volatility Index, a popular measure of the implied volatility of S&P 500 index options; the VIX is calculated by the Chicago Board Options Exchange (CBOE). Often referred to as the fear index or the fear gauge, the VIX represents one measure of the market's expectation of stock market volatility over the next 30-day period.

VIXTrading forex based on strong fundamentals is beneficial because it allows investors to make informed decisions grounded in real economic data rather than speculation. By analyzing key indicators like interest rates, inflation, GDP growth, employment, and geopolitical stability, a trader can anticip

Market is awfully bullishThe market in general is very bullish with many indices moving up higher and higher, but the price of gold has also been moving up higher which historically this doesn't end well. This could also mean that many allocation models have funds and liquidity being put into them. The bullish momentum can

VIX will spike soon with Gold / Silver crashingThis am Gold and Silver have been coming down hard, and will likely keep tanking as supply cannot be met breaking trust in the supply chain. It's happened every other time.
Maybe nothing, but VIX is very nicely positioned now. May use UVIX as a proxy.
Best of luck!

the dead cat bounce in stocks?This channel is not providing individualized trading or investment advice, nor is it a banking service, brokerage service, trading service, investment service or money management service

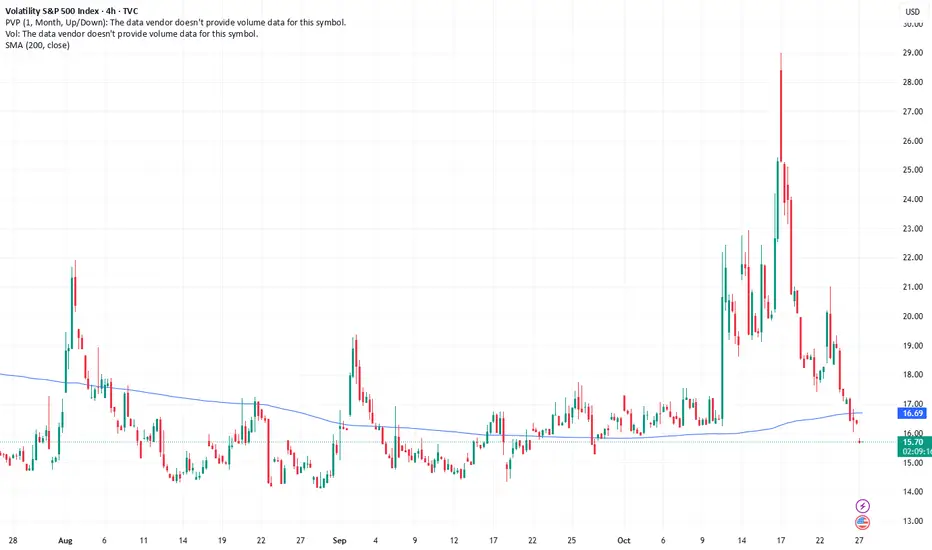
VIX set for downside as equity markets maintain stability Current Price: $16.37
Direction: SHORT
Targets:
- T1 = $15.75
- T2 = $14.50
Stop Levels:
- S1 = $17.60
- S2 = $18.50
**Wisdom of Professional Traders:**
This analysis draws on the expertise of thousands of market participants who closely watch the Cboe Volatility Index (VIX) fo
VIX fib based time extension on past high vol patterns.This is a rough estimate, but it looks about the same as all of the previous times. The chart is public so feel free to copy and publish. You have my full permission. Here's a link - sharing is on, and most layers are hidden (and on BTCUSD since that's usually what I trade)
VIX breakout ? (aka SPY breakdown ?)Observations (not recommendations):
- Market looks toppish here
- everyone in "wait and see" mode, but wait what to the upside ?
- flip-side: any negative news could trigger next hiccup.
- VIX just touched support and bounced up.
Actions:
- Bought some VXX and TAIL on short leashes (tight stops).
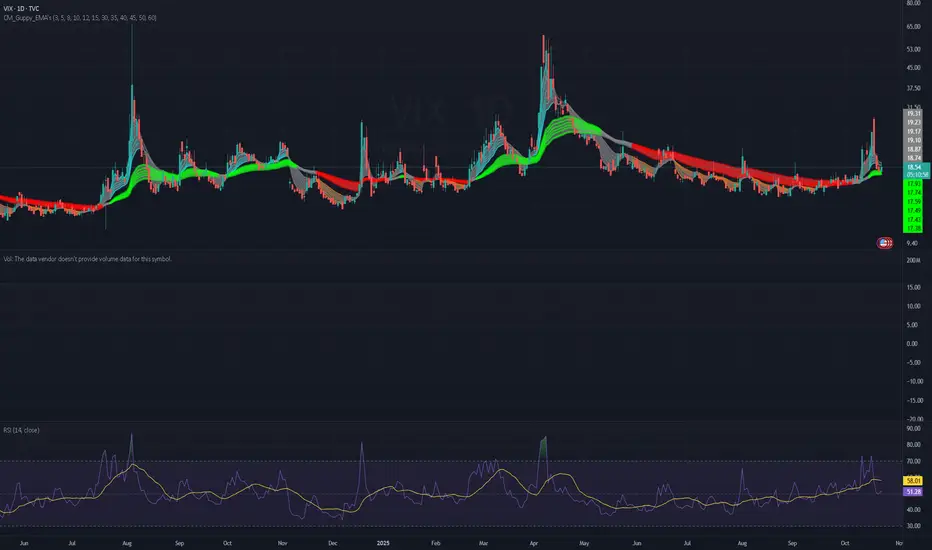
VIX OCT 2025The VIX has rebounded sharply from the 18–20 support zone, showing clear institutional absorption. Price is now approaching a key weekly resistance at 30–35, which also aligns with a gap that could act as a short-term magnet.
If volatility expands further, the next upside targets are 35 (gap fill)

Fear is Rising in the MarketVIX (Volatility aka Fear Index) rose more than 25.5% since last week
However, S&P is just down around 2.0% from its all time high (6764.5)
Are markets preparing for a crash????

See all ideas
Displays a symbol's price movements over previous years to identify recurring trends.
Frequently Asked Questions
Volatility Index reached its highest quote on Mar 18, 2020 — 79.60 USD. See more data on the Volatility Index chart.
The lowest ever quote of Volatility Index is 13.21 USD. It was reached on Jul 18, 2023. See more data on the Volatility Index chart.
Volatility Index is just a number that lets you track performance of the instruments comprising the index, so you can't invest in it directly. But you can buy Volatility Index futures or funds or invest in its components.