TLM GROK: Since no specific asset or market data is provided in your request, I’ll walk through a general analysis and prediction process based on a hypothetical scenario involving a stock trade, putting myself in your shoes to ensure clarity. Let’s assume we’re analyzing a tech stock, XYZ Corp, based o

tlm target final🔹 TLM Price 0.0046 → 0.15 USD
Stage Price Range (USD) Description
1 0.0045 – 0.0050 Short-term consolidation, liquidity accumulation
2 0.0050 – 0.0070 Initial breakout, attracting early buyers
3 0.0070 – 0.0100 Mid-term resistance, monitor volume and trend
4 0.0100 – 0.0200 Strong bullish zone, p

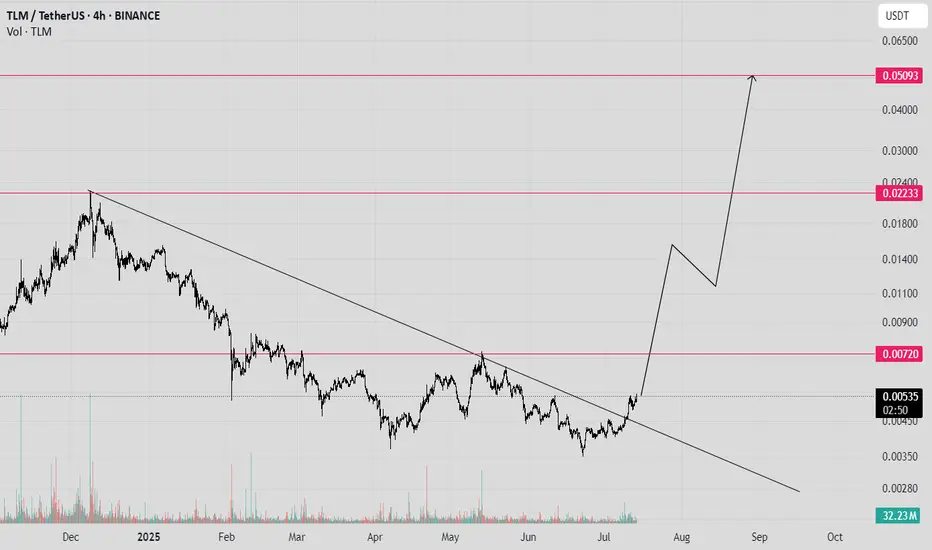
TLM Ready for Breakout or Breakdown?Yello Paradisers, are you ready for what could be the final squeeze before TLM makes its next big move? After weeks of bleeding inside this descending channel, the price is now pressing hard against the upper boundary and a decision is coming fast.
💎#TLMUSDT has bounced from a clear support zone a

Tlm 10X soonAlien Worlds
Alien Worlds is an NFT metaverse running on the Ethereum, Binance Smart Chain and WAX blockchains
Long-running trend breakout
Time to fly
I wish everyone abundant profits.
Like and follow
for more.
TLM 2800% SoonAlien Worlds
TLM
"Alien Worlds is an NFT metaverse running on the Ethereum, Binance Smart Chain and WAX blockchains."
A sleeping giant
It didn't get its chance because it was listed at the end of the previous bull market.
It's been in a downtrend for over a year.
The day before yesterday, this
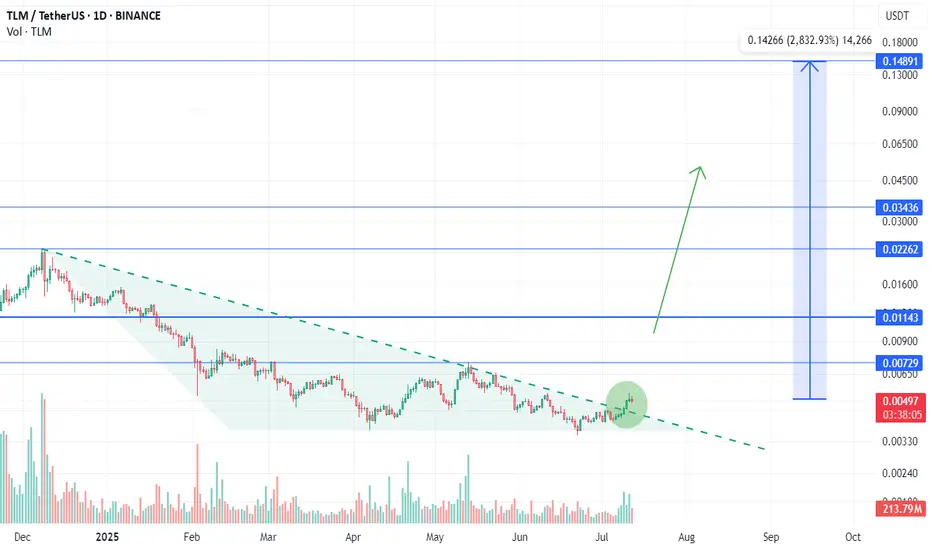
TLMUSDT 1D AnalysisTLM ~ 1D Analysis
#TLM This trade is very high risk, buy from here if you still have confidence in this coin with a short term target of at least 15%++

$TLM GOING TO MORE ZEROSIt's going to more zeros.
I warned you before that TLM is adding more zeros. Do not go towards such assets, do not buy them, do not hold them.

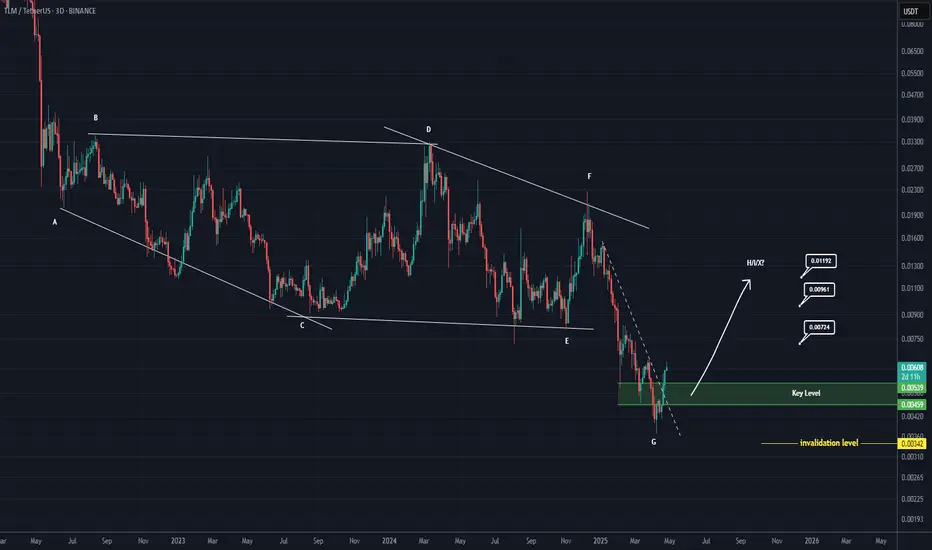
TLM Looks Bullish (3D)It seems that a diametric has completed on the chart, or Wave G of a symmetrical pattern has ended, or the price is attempting to form a bullish X-wave.
There is a key zone on the chart that the price has reclaimed, marked in green.
As long as this zone holds, the price can move toward the targets
TLM Bearish Flag Formation – Short Opportunity Ahead?#TLM is currently forming a Bearish Flag pattern on the 4H timeframe – a classic continuation setup indicating potential downside.
🔍 Key Observations:
Price is consolidating within the golden zone of the Fibonacci retracement.
We're closely watching for confirmation signals before entering a shor

Excited to see friends who are interested in cryptoBINANCE:TLMUSDT
"Today, I'm sharing a bit about a crypto idea that I've bought specifically for a position hold, within a timeframe of 3 days to 3 months."

See all ideas
Summarizing what the indicators are suggesting.
Oscillators
Neutral
SellBuy
Strong sellStrong buy
Strong sellSellNeutralBuyStrong buy
Oscillators
Neutral
SellBuy
Strong sellStrong buy
Strong sellSellNeutralBuyStrong buy
Summary
Neutral
SellBuy
Strong sellStrong buy
Strong sellSellNeutralBuyStrong buy
Summary
Neutral
SellBuy
Strong sellStrong buy
Strong sellSellNeutralBuyStrong buy
Summary
Neutral
SellBuy
Strong sellStrong buy
Strong sellSellNeutralBuyStrong buy
Moving Averages
Neutral
SellBuy
Strong sellStrong buy
Strong sellSellNeutralBuyStrong buy
Moving Averages
Neutral
SellBuy
Strong sellStrong buy
Strong sellSellNeutralBuyStrong buy
Displays a symbol's price movements over previous years to identify recurring trends.