London setup London will create the low of the day & NY session will be a continuation of London session today with greater portion of displacement.
Gold Futures
No trades
Market insights
$GC, Gold: In Wave 5 upCSE:GC , Gold: I count it as having finished (IV) waves and we're in 5 of Wave (V). This wave can take us to $4900. A substantial correction follows after that, if this count is correct. However, the 5th wave can extend so we'll see how the technical indicators appear after reaching the 5th wave target.
I presently have a 3.1% portfolio allocation to gold through GLD.

GC UpdateIndicators and trend looks bearish for Monday.
I flipped my GLD calls in the morning, a bit early because I had a meeting to attend. It was a good day to be early than late though, lol.
No position. Not sure if it will go down enough to make any money off puts.


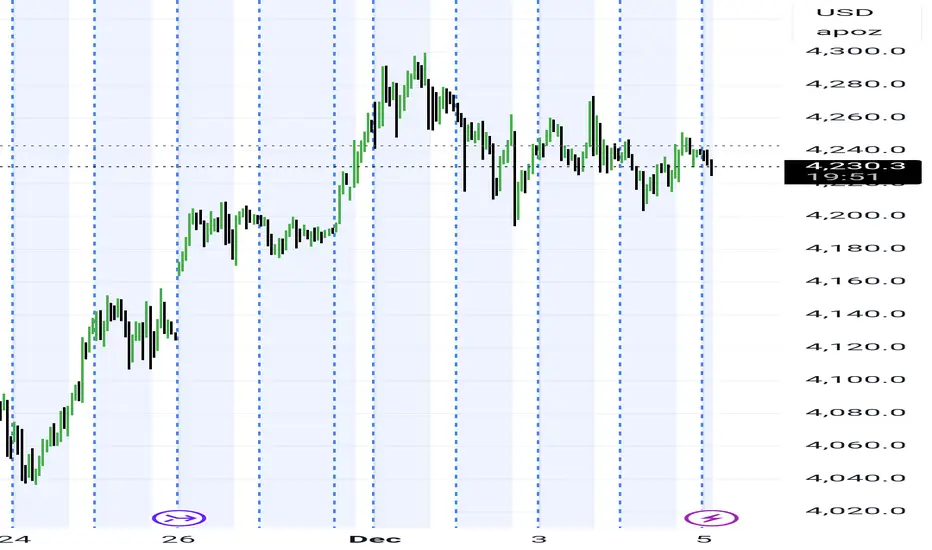
Gold Context: The 4290 Probe & Weekly Balance OutlookFOREXCOM:XAUUSD COMEX_MINI:MGCG2026 COMEX:GC1!
Traders. Weekly wrap-up and context outlook for the next auction.
Market Context (The Rejection):
Gold rejected the 4290 level, falling just short of the 4300 psychological magnet.
• Interpretation: While the day ended with a rejection (excess), we must not ignore that the auction did facilitate trade at these levels. This extension above our 3-day balance indicates intent.
• The Profile: The rally displays characteristics of short covering (squeezing weak shorts) rather than aggressive new buying. The rejection simply indicates the price was "too high" for the current timeframe, but the level remains a valid target for a revisit.
Structure & Outlook (Next Week):
We are monitoring the Weekly Balance zone roughly between 4220 – 4260.
• The Bull Case (Acceptance): If we see continued short covering transition into New Money (OTF) buying above this balance, we look for acceptance at these higher prices. This would open the door to trade through 4300.
• The Bear Case (Liquidation): There is a probability of long liquidation if the auction fails to hold the balance, but I am cautious/skeptical of the downside potential right now.
Plan:
Watch for acceptance vs. rejection relative to the 4220–4260 balance. We need "New Money" to sustain the break of 4300.
Talk to you for the next update.
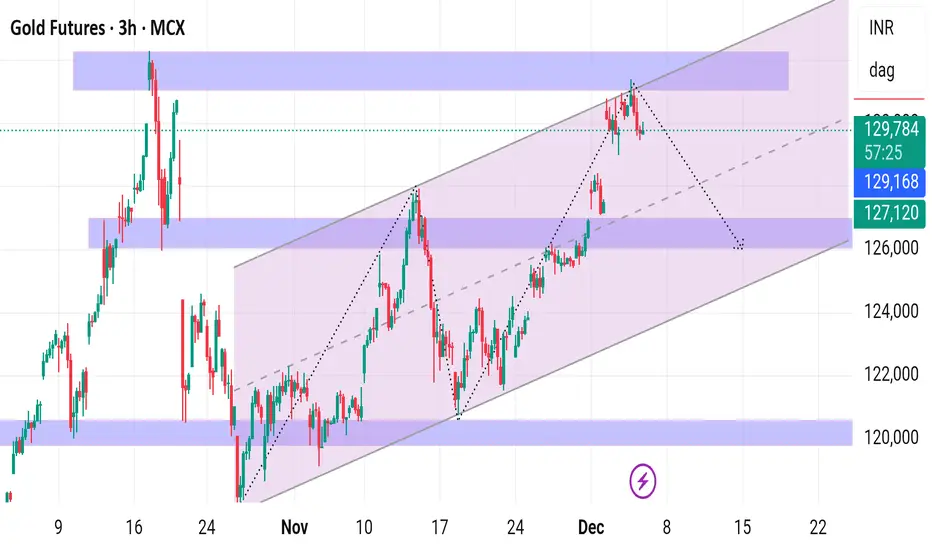
Gold with technical analysis and its key support and resistance Gold with technical analysis and its key support and resistance
Gold is in a rising parallel channel on the 3‑hour chart, currently reacting lower from the upper boundary, so short‑term bias is for a pullback within an overall uptrend.
Key levels to watch are supports near 129,175–127,120 and resistance around 131,200–131,500 and the channel top.
## Trend structure
- Price has been respecting a well‑defined ascending channel since early November, with higher highs and higher lows confirming an uptrend on this timeframe.
- The latest swing has reached the upper band of this channel and shows rejection candles, indicating supply pressure and possible short‑term exhaustion of buyers.
## Support zones
- Immediate intraday support is near the mid‑channel and prior breakout area around 129,100–129,200; a hold here keeps the uptrend structure intact.
- Deeper support sits at 127,100–127,200, aligning with the channel lower boundary and previous demand zone; a sustained break below this area would signal a potential trend change or larger correction towards 125,000 and then 122,000.
## Resistance zones
- The first and most important resistance is the recent high and channel top region near 131,200–131,500, where repeated rejections suggest strong sellers.
- If price can close firmly above this band, the channel’s upper projection opens room for further upside, with next resistance coming from measured channel extension and recent technical levels around 133,000–133,500.
## Trading view
- As long as price stays inside the rising channel and above 127,100–127,200, the primary trend remains bullish and dips into support can be treated as buy‑on‑dip opportunities with tight risk control.
- A breakdown below the lower channel with volume would favor a shift to sell‑on‑rise, targeting the lower horizontal supports mentioned, while any fresh breakout above 131,500 would invalidate the short‑term bearish pullback idea and resume the up‑leg.
Gold MCX Future - Weekly Analysis - 1 to 5 Dec., 2025MCX:GOLD1!
Gold MCX Futures — Chart Pathik Weekly Levels for 01 to 05 Dec. 2025
(If these levels add value to your trades, a quick boost or comment goes a long way in supporting this free content and keeping our trading community thriving!)
Gold Futures are trading near 129,893, pulling back from early-week highs and hovering just below the Weekly Neutral Zone at 130,220, signalling a balanced tug-of-war between continuation bulls and mean-reversion bears. Price remains above key weekly long reference levels, keeping the broader structure constructive but vulnerable to deeper dips if supports fail.
Weekly Bullish Structure
Weekly long bias remains active as long as price holds above the W Long Entry zone at 128,641 and the W Add Long Position level at 128,126, where prior demand and breakout structure align.
Upside targets sit at 132,919 (W Long Target 1) and 134,587 (W Long Target 2), marking zones for positional booking if buyers regain control above the Neutral Zone.
Control: Positional longs can trail or define risk below the W Long Exit at 129,066 and more structurally below 128,126, where bullish weekly structure starts to weaken.
Weekly Bearish Structure
If price breaks and sustains below 128,126, focus shifts to the W Short Entry band around 127,610–127,518, where fresh selling pressure and failed retests of broken support can set up downside continuation.
Weekly downside targets lie at 127,521 (W Short Target 1) and 125,853 (W Short Target 2), providing zones for profit booking on swing shorts.
Control: Bears need to stay cautious on any sharp reclaim back above 129,066–130,220, where failed breakdowns can quickly flip back into a squeeze towards the weekly long targets.
Neutral & Trading Plan Context
130,220 acts as the Weekly Neutral pivot—while gold trades between roughly 129,066 and 130,220, expect range-bound swings suitable for tactical intraday/swing trades rather than aggressive weekly trend plays.
Every level is designed to give structure for both positional and intraday traders—plan entries around these zones, manage exits at targets, and let the chart work for you, not your emotions.
Boost or comment if these weekly levels support your preparation—help Chart Pathik keep delivering structured, high-quality analysis to more MCX traders!

Gold — continuing the correctionInitially, we may draw one more small wave up, slightly above 4,350 — but it’s not necessary. Then we will move down into the 3,900 range (slightly lower). After that we’ll see — overall, the outlook points to a deeper correction.

GC UpdateGold and silver appear to be stalled out right now, waiting for MFI to hit oversold.
Sucks they hit the sell button right before open, I was carrying EWZ (Brazil) calls overnight. Their market opens before the US, it was up big then reversed when futures went down. Brazil stock market tends to move with commodities.
Unfortunately you can't sell options premarket. Made a small profit though.

GOLD 17.12.2025Today’s market was quite choppy, especially Gold. I let price develop during the first part of the session, and it became clear that institutions were seeking liquidity, which was found around the previous day’s POC. From that area, price reacted aggressively and pushed toward the upper zone, where it started trading into a non-fair value area formed two days ago.
This area had relatively strong volume, and during the second part of the session, price was met with aggressive sellers. On the CVD, we can see that during the pullback buyers remained active, forming an interesting accumulation within the downtrend.
With the confluence of the 0.618 Fibonacci level and the moving average, price reacted nicely, resulting in a clean and disciplined 3R trade.

How to Trade Breakouts in TradingViewBreakout trading is a strategy that aims to capture strong price movements when markets break through key support or resistance levels, often signaling the start of a new trend or continuation move.
What You'll Learn:
Understanding breakouts as price movements beyond established support or resistance levels
How breakouts can occur at horizontal levels, trendlines, or chart patterns like triangles, rectangles, and flags
Why consolidation patterns often precede strong breakout moves
Recognizing the difference between false breakouts and confirmed breakouts
How to use candle closes beyond key levels as confirmation rather than relying on quick spikes
The critical role of volume in validating breakouts and separating real moves from fakeouts
Why expanding ATR during a breakout confirms increasing volatility and momentum
Understanding the break and close entry method for conservative breakout trades
How to scale into positions by entering partially on the break and adding on continuation
Using the pullback entry strategy to trade retests of broken levels as new support or resistance
Setting stop losses using ATR-based methods or placing them beyond consolidation patterns
Calculating profit targets with measured move techniques by projecting pattern heights
How to mark key levels in TradingView using the horizontal line tool from the left toolbar
Drawing trendlines and connecting swing points for pattern recognition
Accessing built-in pattern recognition tools through the Indicators menu
Practical examples using futures charts across multiple timeframes
This tutorial is designed for futures traders, day traders, and swing traders who want to capitalize on momentum moves and volatility expansion using technical breakout strategies.
The methods discussed may help you identify high-probability breakout setups, manage entries with proper confirmation, and set risk-appropriate stops and targets across multiple markets and timeframes.
Learn more about futures trading with TradingView: optimusfutures.com
Disclaimer
There is a substantial risk of loss in futures trading. Past performance is not indicative of future results. Please trade only with risk capital. We are not responsible for any third-party links, comments, or content shared on TradingView. Any opinions, links, or messages posted by users on TradingView do not represent our views or recommendations. Please exercise your own judgment and due diligence when engaging with any external content or user commentary.
This video represents the opinion of Optimus Futures and is intended for educational purposes only. Chart interpretations are presented solely to illustrate objective technical concepts and should not be viewed as predictive of future market behavior. In our opinion, charts are analytical tools, not forecasting instruments.

FVG RejectionCaught this trade during the Tokyo session. An FVG was formed that took out a swing low. The FVG was retested and rejected. I entered at the fractal BOS and targeted Sell Side Liquidity (SSL). My SL was out above the FVG.

This is a follow up on yesterday's videoThis is December 17th and there have been changes in the market since that time that led to 2 bar reversals which are tools that tell us we can go long or short depending on the 2 bar reversal. We looked at it oil which I think has a good reversal here and we'll protect it with a small stop or we can wait if you don't like it don't take the trade but keep your eye on it because oil finished in ABCd pattern going lower so it may be time for it to reverse and go higher from here. And we looked at a few other markets as well.

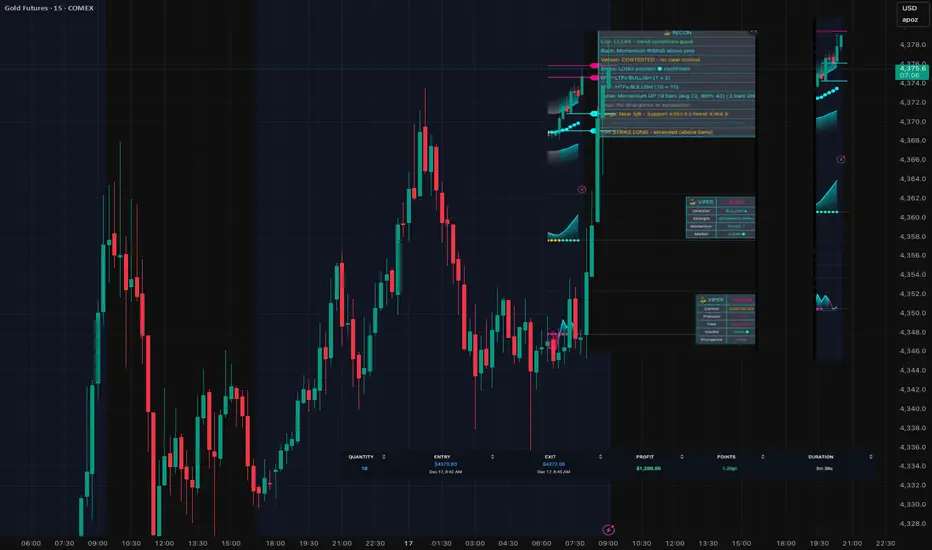
SignalViper Suite — Quick Scalp on Gold FuturesSignalViper Suite — Quick Scalp on Gold Futures (GC)
3-minute trade.
$1,200 profit.
Here's the setup:
RECON showed full alignment:
• Coil: CLEAR — no chop
• Strike: LONG confirmed
• Rush: Momentum RISING
• MTF: All timeframes bullish
• Fangs: Near key S/R levels
The missing piece? Venom was showing CONTESTED — buyers and sellers fighting for control.
I waited.
Next bar, Venom flipped to BUYERS.
That was my trigger. Entry: 4370.80 Exit: 4372.00 Duration: 3 minutes
Result: +1.20 pts on my Apex Trader Fund account. No guessing. No FOMO. Just waited for all 8 indicators to align, then executed. That's what confluence looks like.
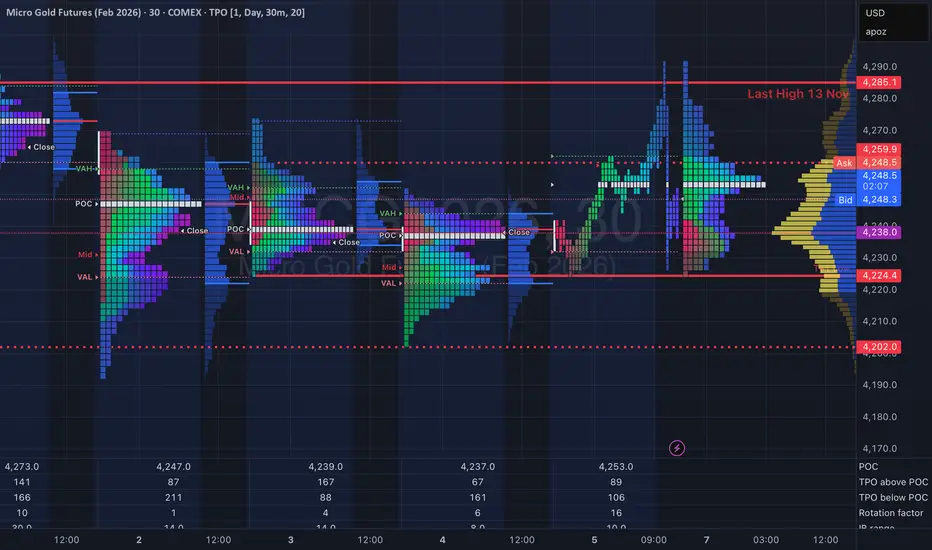
Gold Context: Mechanical Balance & The Poor HighFOREXCOM:XAUUSD COMEX_MINI:MGCG2026 COMEX:GC1!
Analysis
1. Market Context (Mechanical Balance)
The auction has entered a phase of Mechanical Balance . By maintaining trade above 4300 for a week, the market is signaling acceptance of higher prices, but the momentum has paused.
* The Behavior: The test of yesterday’s Midpoint/POC and the "mild" activity confirms that Short-Term Timeframe traders are currently dominant. They are trading off visual references rather than creating new value.
2. Structure (The Poor High)
We have a structural anomaly at the 4380/90 area : a Poor High .
* Implication: A poor high lacks "excess" (a buying tail), which indicates the auction did not finish properly. Selling wasn't aggressive; buying simply dried up. This leaves "unfinished business" to the upside.
* The Nuance: While the destination is likely higher to repair this poor high, the market may lack the immediate energy to do so without an inventory adjustment first.
3. Short-Term Scenario (Liquidation)
The mild, mechanical trade increases the odds of Long Liquidation .
* The Flush: A rotation back toward the 4300 shelf would test the lower limits of this balance.
* The Opportunity: If we flush to 4300 and find responsive buying, it re-energizes the market to finally go up and repair the 4380/90 poor high.
Plan & Execution
* Bias: Neutral-to-Bullish (awaiting repair).
* Observation: Watch the 4300 test. Do we get a "look below and fail" (bullish) or acceptance lower? The poor high remains a magnet for the future.
Talk to you for the next update.

Gold Update 17DEC2025: Ending Diagonal Almost Done Market volatility dries up as price approaches the all-time high
Out of the three scenarios posted last time, the first one is playing out
Price is shaping an Ending Diagonal in the final wave up, which should at least retest the record high around $4,400 to complete a full five-wave sequence
Meanwhile, RSI did not build the same bullish momentum and is showing early signs of bearish divergence against price
This confirms that the current move is likely the final wave up and also warns of a possible reversal after price retests the record high
Minor support is located at the previous low around $3,901
Typically, the valley of the larger wave 4 contains the first drop in the event of a reversal
This major support is located near the $3,300 level
Let’s see how price behaves around the all-time high first

Buying GCGC closed bullish on 4H. Bearish 1H low was tagged as sweep of liquidityThere are 15M and 30M bullish engulfing candles. Going for 4H high which should provide 2,5R

FVG REjectionCaught this trade during the pre-market moves when a swing low was taken out by a Bearish FVG. The FVG was respected and then rejected. Showed entry after the fractal BOS. Trade Idea was profitable.

GOLD - 16.12.2025Today, price formed a bullish divergence between CVD and price. As expected, we saw a strong positive reaction, with price moving through the entire Value Area formed during the previous session.
However, once price reached the upper side, we witnessed an aggressive rejection from the area where the previous day’s VAH was located.

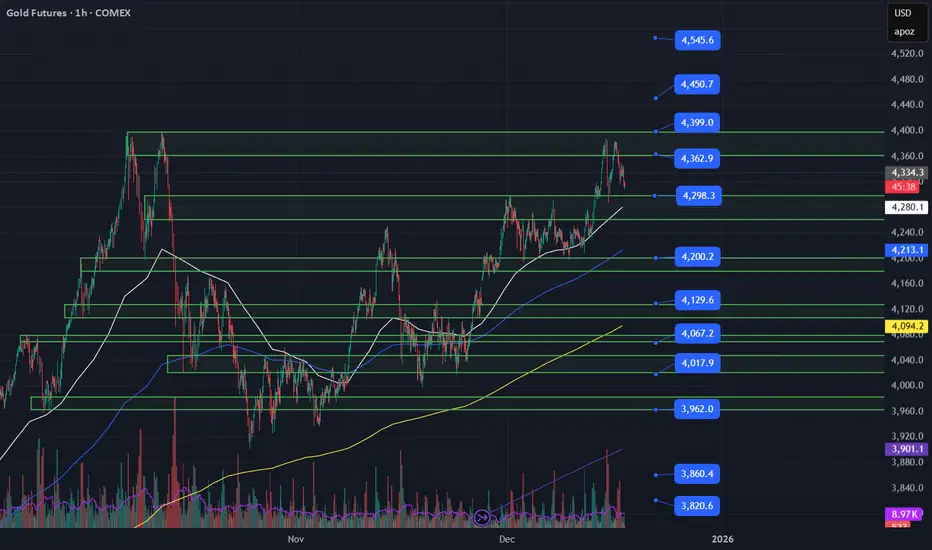
Gold Bulls Are In Control and Looking For Entries On PullbacksGold looks bullish a price broke out of a recent range last week and is holding above my moving averages. I would look for buying opportunities on pullbacks into the 4300, 4280(8MA) level to target 4360, 4400, 4450. A hold below 4280 and I'd be scalping short for the 21MA(4200) and would be watching how price reacts there. A hold or failed break would be another good long entry and a hold below would be a spot to press shorts for 4130, 4095(50MA).
#GC_F, AMEX:GLD , #Gold, #XAUUSD
GC | Wk 51T.A explained -
BackSide (BS)
FrontSide (FS)
Inverse BS (Inv.BS)
Inverse FS (Inv.FS)
BS & FS levels are expected support when dashed lines, tested when dotted and resistance when solid lines.
The inverse is true for the Inv. BS Inv. FS levels, they are resistance as dashed lines, tested as dotted and support as solid lines.
Monthly timeframe is color pink
weekly grey
daily is red
4hr is orange
1hr is yellow
15min is blue
5min is green if they are shown.
strength favors the higher timeframe.
2x dotted levels are origin levels where trends have or will originate. When trends break, price will target the origin of the trend. its math, when the trend breaks, the vertex breaks too so the higher timeframe level/trend that breaks, the more volatility there could be as strength in the orders flow in to fuel the move.

E-mini Gold Futures poised for breakout above key resistance
Current Price: $4300.10
Direction: LONG
Confidence Level: 72%
Targets:
- T1 = $4350
- T2 = $4450
Stop Levels:
- S1 = $4300
- S2 = $4250
**Wisdom of Professional Traders:**
By combining insights from many professional traders across multiple platforms, I'm seeing a clear preference toward upside continuation in E-mini Gold Futures. Traders are framing this as a buy‑the‑dip or breakout opportunity, with $4,300 functioning as the critical support zone and $4,350 as the trigger level for a bullish push higher. The crowd wisdom suggests that as long as price stays above $4,300, the odds are skewed in favor of gains, particularly with gold's role as an inflation hedge and safe‑haven play remaining central in current market conditions.
**Key Insights:**
Here's what's driving my bullish take: Many traders are noting that gold has held an uptrend structure for the past month, with higher highs and higher lows intact. The MACD has just flashed a bullish crossover, and RSI sits comfortably below overbought, leaving room for further upside. Multiple pros point to $4,350 as short‑term resistance — but they expect this level to break if momentum continues, opening the way toward the $4,450–$4,500 area.
What caught my attention is the repeated emphasis on macro tailwinds. Ongoing signs of US dollar weakness, combined with only moderate resistance overhead, create the conditions for a sustained advance. Social sentiment on X also aligns with this view, showing a majority of bullish mentions compared to very few bearish takes in the last 24 hours.
**Recent Performance:**
Over the past week, E-mini Gold Futures have climbed about 2%, bouncing off the $4,300 level three separate times. Last Friday saw a close near $4,328, modestly above the 20‑day EMA, with volume ticking above its 20‑day average — a sign of growing participation. This stability at support reinforces the willingness of buyers to step in on minor dips, keeping the broader trend intact.
**Expert Analysis:**
Several professional traders highlight that gold is still well‑supported by central bank demand, with continued net purchases for over a year. Technical voices are stressing the importance of the $4,300 zone as the main defense line, while breakout traders are watching $4,350 closely for confirmation of momentum. A few swing trading specialists on YouTube are openly targeting $4,450–$4,500 this week if price closes strongly above the breakout zone. Their collective logic: the absence of strong nearby supply zones after $4,350 gives the market room to run.
**News Impact:**
Macro headlines this week are skewing supportive for gold. Traders are watching the US core CPI release, which, if hot, could accelerate safe‑haven flows into gold, and the Fed Chair’s upcoming speech, where a dovish tone would likely weaken the dollar further. On top of that, geopolitical tensions and upcoming Eurozone GDP revisions may also boost demand. All of these factors serve as catalysts that could amplify an already favorable technical setup.
**Trading Recommendation:**
Here’s my take — I’d enter a long position now or on a confirmed breakout above $4,350, using $4,300 as a protective stop zone and $4,250 as a wider secondary stop for risk control. First target sits at $4,350, but I’d look to capture the move toward $4,450 if momentum and volume confirm. Position sizing should stay within 2% of account equity, given macro event risk this week. The combined technical strength, favorable sentiment, and supportive macro backdrop make this a solid short‑term opportunity in E-mini Gold Futures.

GC weekly trading plan for Dec 15-19On weekly chart gold closed bullish and above previous week high. Looking for continuation of this bullish move towards all time highs.
