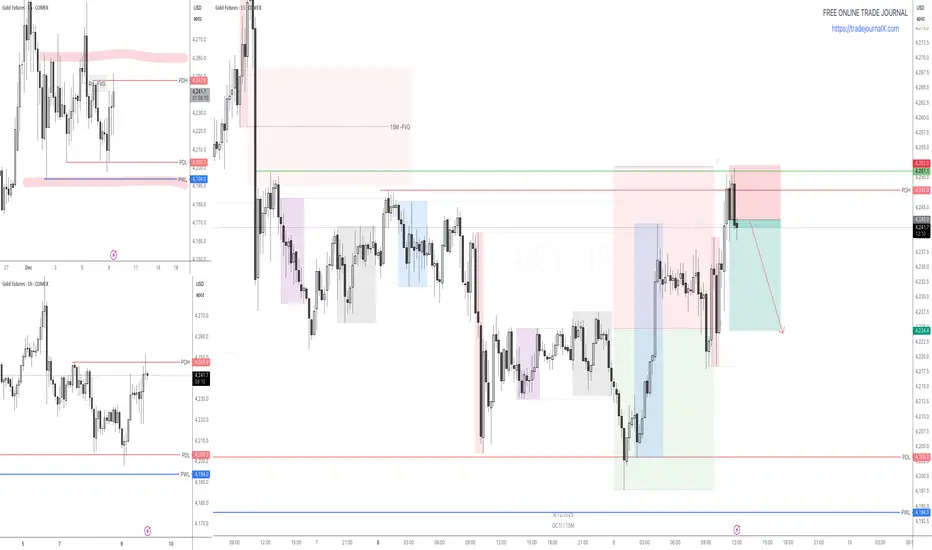
GOLD - 16.12.2025Today, price formed a bullish divergence between CVD and price. As expected, we saw a strong positive reaction, with price moving through the entire Value Area formed during the previous session.
However, once price reached the upper side, we witnessed an aggressive rejection from the area where the previous day’s VAH was located.
Gold Futures
No trades
Market insights

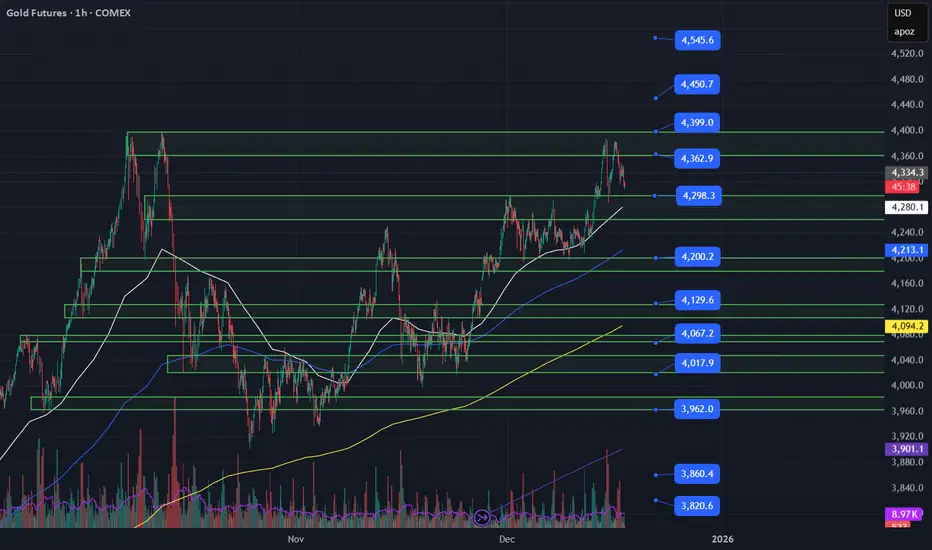
Gold Bulls Are In Control and Looking For Entries On PullbacksGold looks bullish a price broke out of a recent range last week and is holding above my moving averages. I would look for buying opportunities on pullbacks into the 4300, 4280(8MA) level to target 4360, 4400, 4450. A hold below 4280 and I'd be scalping short for the 21MA(4200) and would be watching how price reacts there. A hold or failed break would be another good long entry and a hold below would be a spot to press shorts for 4130, 4095(50MA).
#GC_F, AMEX:GLD , #Gold, #XAUUSD
E-mini Gold Futures poised for breakout above key resistance
Current Price: $4300.10
Direction: LONG
Confidence Level: 72%
Targets:
- T1 = $4350
- T2 = $4450
Stop Levels:
- S1 = $4300
- S2 = $4250
**Wisdom of Professional Traders:**
By combining insights from many professional traders across multiple platforms, I'm seeing a clear preference toward upside continuation in E-mini Gold Futures. Traders are framing this as a buy‑the‑dip or breakout opportunity, with $4,300 functioning as the critical support zone and $4,350 as the trigger level for a bullish push higher. The crowd wisdom suggests that as long as price stays above $4,300, the odds are skewed in favor of gains, particularly with gold's role as an inflation hedge and safe‑haven play remaining central in current market conditions.
**Key Insights:**
Here's what's driving my bullish take: Many traders are noting that gold has held an uptrend structure for the past month, with higher highs and higher lows intact. The MACD has just flashed a bullish crossover, and RSI sits comfortably below overbought, leaving room for further upside. Multiple pros point to $4,350 as short‑term resistance — but they expect this level to break if momentum continues, opening the way toward the $4,450–$4,500 area.
What caught my attention is the repeated emphasis on macro tailwinds. Ongoing signs of US dollar weakness, combined with only moderate resistance overhead, create the conditions for a sustained advance. Social sentiment on X also aligns with this view, showing a majority of bullish mentions compared to very few bearish takes in the last 24 hours.
**Recent Performance:**
Over the past week, E-mini Gold Futures have climbed about 2%, bouncing off the $4,300 level three separate times. Last Friday saw a close near $4,328, modestly above the 20‑day EMA, with volume ticking above its 20‑day average — a sign of growing participation. This stability at support reinforces the willingness of buyers to step in on minor dips, keeping the broader trend intact.
**Expert Analysis:**
Several professional traders highlight that gold is still well‑supported by central bank demand, with continued net purchases for over a year. Technical voices are stressing the importance of the $4,300 zone as the main defense line, while breakout traders are watching $4,350 closely for confirmation of momentum. A few swing trading specialists on YouTube are openly targeting $4,450–$4,500 this week if price closes strongly above the breakout zone. Their collective logic: the absence of strong nearby supply zones after $4,350 gives the market room to run.
**News Impact:**
Macro headlines this week are skewing supportive for gold. Traders are watching the US core CPI release, which, if hot, could accelerate safe‑haven flows into gold, and the Fed Chair’s upcoming speech, where a dovish tone would likely weaken the dollar further. On top of that, geopolitical tensions and upcoming Eurozone GDP revisions may also boost demand. All of these factors serve as catalysts that could amplify an already favorable technical setup.
**Trading Recommendation:**
Here’s my take — I’d enter a long position now or on a confirmed breakout above $4,350, using $4,300 as a protective stop zone and $4,250 as a wider secondary stop for risk control. First target sits at $4,350, but I’d look to capture the move toward $4,450 if momentum and volume confirm. Position sizing should stay within 2% of account equity, given macro event risk this week. The combined technical strength, favorable sentiment, and supportive macro backdrop make this a solid short‑term opportunity in E-mini Gold Futures.

GC weekly trading plan for Dec 15-19On weekly chart gold closed bullish and above previous week high. Looking for continuation of this bullish move towards all time highs.

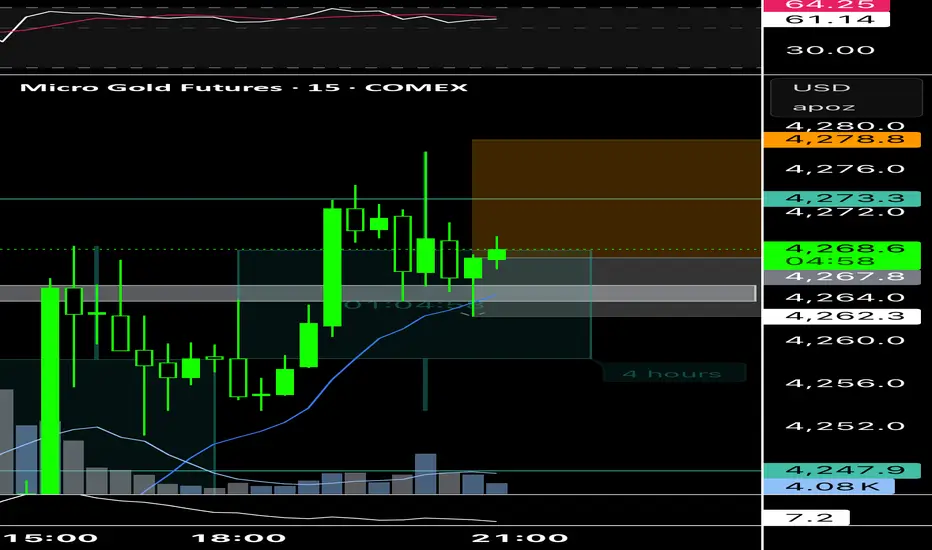
Gold Long: There are Pure Strategy For 15M ScalpersMarket Today are Very Strong and he almost Complet the trend but Just Little more are rest

Will GOLD create a new ALL TIME HIGH before the year is over?COMEX:GC1!
Becoming Profitable in the Auction, is a choice only chosen by the 'PROFITABLE'...
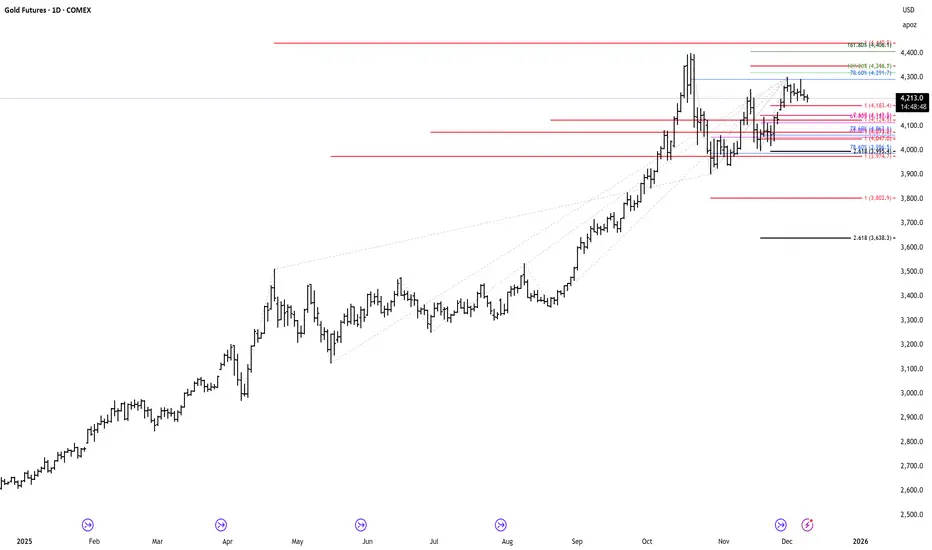
As of December 14, 2025, the GC1 gold futures contract has risen by approximately 63.9% to 65.6% so far this year. This has been a 'RECORD-BREAKING YEAR' in the metals markets for GOLD. Truly this year is going down in the history books to come. First we hit $3K then $4K and now were here around $4.3K per troy ounce. AMAZING!!! Now this is the KEY question, will the BULL MARKET CONTINUE? Late October we had a strong correction to the downside for about -11.2% and since then we have gained back around +10.2% back headed for Octobers ATH. The ATH price has yet to be broken sitting at $4,435 per troy ounce. Will buyers push and break this HIGH before the year is over, or will sellers hold them off and push lower in the auction? Lmk in the comments...
Continued Success,
TreyHighPwr

Gold MCX Future - Intraday Technical Analysis - 15 Dec., 25MCX:GOLD1!
Gold MCX Futures — Chart Pathik Intraday Levels for 15-Dec-2025
(If these levels add value to your trades, a quick boost or comment goes a long way in supporting this free content and keeping our trading community thriving!)
Gold Futures are trading near 133,622, bouncing from a sharp selloff and now testing the zero line at 133,622 along with the Add Long Position band at 133,769, making this zone the key intraday decision area between continuation of the rebound and fresh selling. Price is still below the earlier breakdown zone, so confirmation around these levels is essential before committing either way.
Bullish Structure
Longs activate above the Long Entry level at 134,122 once price sustains above the zero line and Add Long Pos. band with higher lows.
Targets: 135,469 (Long Target 1 / main booking zone) and 136,610 (Long Target 2 / extended upside if buyers fully reclaim control).
Control: Place stops or trail risk near 133,416–133,126 (Short Entry and Long Exit) to keep downside defined if the bounce fails and the prior downtrend resumes.
Bearish Structure
Shorts remain attractive if price fails in the 133,769–134,122 band and rolls back under the zero line at 133,622.
Fresh shorts open below the Short Entry at 133,416, with downside focus on 131,775 (Short Target 1) and 130,634 (Short Target 2) if selling pressure extends.
Neutral Zone
133,622 is today’s inflection—expect choppy, stop-hunting action while gold oscillates between roughly 133,416 and 133,769 without decisive 15‑minute closes beyond either side.
Every setup is designed for structure, plan, and logic—let the chart work for you, not your emotions.
Boost or comment if these levels help your preparation—help Chart Pathik keep delivering quality analysis to more intraday traders!

GC | Week 50 | 1hr chart T.A explained -
BackSide (BS)
FrontSide (FS)
Inverse BS (Inv.BS)
Inverse FS (Inv.FS)
BS & FS levels are expected support when dashed lines, tested when dotted and resistance when solid lines.
The inverse is true for the Inv. BS Inv. FS levels, they are resistance as dashed lines, tested as dotted and support as solid lines.
Monthly timeframe is color pink
weekly grey
daily is red
4hr is orange
1hr is yellow
15min is blue
5min is green if they are shown.
strength favors the higher timeframe.
2x dotted levels are origin levels where trends have or will originate. When trends break, price will target the origin of the trend. its math, when the trend breaks, the vertex breaks too so the higher timeframe level/trend that breaks, the more volatility there could be as strength in the orders flow in to fuel the move.

GOLD 12.12.2025Gold was very bullish today following the FED conference that took place the day before. Price moved close to the ATH zone. Personally, I didn’t actively look for a trade during this bullish move, because the day before price had consolidated right below the 0.786 level, which gave me the idea that price could break higher.
After the pullback, we can see that price reacted from the 0.618 zone, where we also had the previous day’s VAH, resulting in a nice reaction of over 40+ pips.

Multi Top - Multi Bottom. Go Next Your Golden Shift4300 to brace a bag (supply area). 4375 extension - to make it back.
GC daily trade plan for Dec 12Gold broke out of Daily consolidation range and closed above it as well as above previous Weekly high. This morning PWH held and might send price higher towards ATH.
I will be looking to buy gold today.

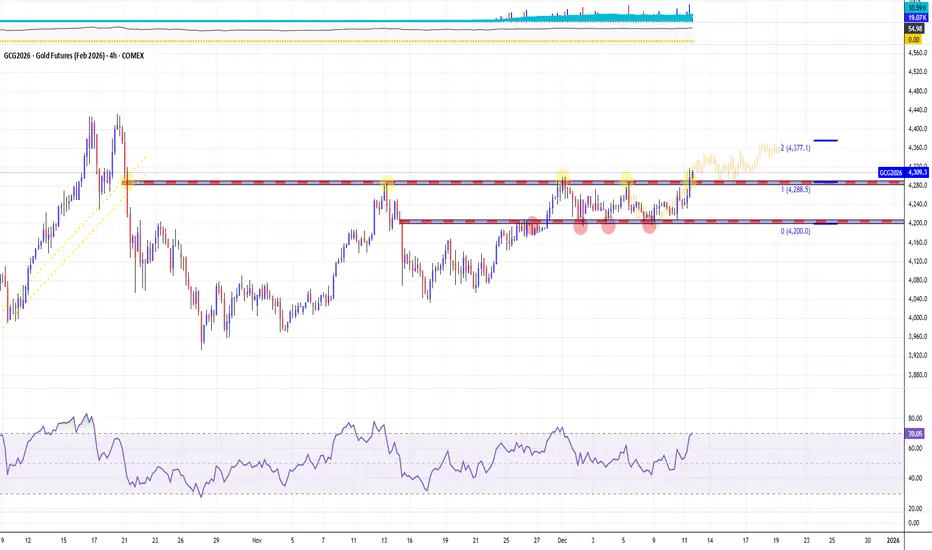
Gold Short-Term Correction vs. Long-Term Bullish Thesis
Key Structural Analysis
The "Big Triangle" (or Consolidation): Price has been consolidating for a long period, forming a large symmetrical or ascending triangle pattern. This pattern represents a period of quiet accumulation and decreasing volatility—the "calm before the storm."
The Final Correction: The recent price action (the Double Top/Neckline break on your 1H chart) is the final, sharp correction that occurred above the triangle's key support trendline. This move is designed to:
the Breakout Level: Re-test the top boundary of the previous triangle/consolidation range, turning old resistance into new, strong support.
Shake Out Weak Buyers: Force short-term traders out of their long positions before the major move.
Breakout Imminent: With the correction completed (or nearing its completion), the price is now coiled and positioned for the final bullish breakout above the most recent peak.
Trade Thesis: Patience for the Big Move
Risk Area: The current weakness is simply the market testing the patience of traders. Shorts are capitalizing on the Double Top, but their upside is structurally limited by the Big Triangle's support.
The Target : Once the price confirms the breakout from the current correction's high, the measured move will be based on the height of the entire Big Triangle, projecting a massive, long-term target in line with the major bullish fundamentals (rate cuts).


Post-FOMC Context: Policy Divergence & Inventory AdjustmentCOMEX:GC1! FOREXCOM:XAUUSD COMEX_MINI:MGCG2026
Analysis
1. Macro Context (The Currency Auction)
The structural bid for the USD remains valid due to clear Policy Divergence .
* The Fed: The "Hawkish Cut" (25bps) coupled with the signal for a "slower pace" (only one cut projected for 2026) confirms a pivot to a "pause" to verify data.
* The ECB: Conversely, Europe is cutting into economic weakness.
* Implication: This widening rate spread creates a fundamental floor. The recent drop in DXY displays the characteristics of a Liquidation Break (inventory adjustment) rather than a structural reversal. The market flushed weak, crowded longs, but value has not migrated lower.
2. Gold Auction Analysis (Emotional Structure)
The post-FOMC rally in Gold displays the hallmarks of an Emotional Trade .
* Structure: The vertical move has left behind Low Volume Nodes (LVNs) and single prints. This indicates the auction was driven by mechanical short covering rather than initiative buying, leaving a "poor" or "thin" structure.
* The Test: We are trading into Higher Time Frame (HTF) resistance.
* Scenario A: For a credible attempt at ATH, we require New Money (OTF) to step in and backfill these LVNs—converting the thin structure into accepted value.
* Scenario B: Without sustained OTF participation, the probability favors a rotation back to value to repair the poor structure. Emotional rallies often fade once the short covering inventory is depleted.
3. ES Context (Liquidity Window)
The "Hawkish" pause signal removes the "easy money" narrative for 2026. If 10Y yields break higher, the ES auction is vulnerable to its own liquidation break as participants adjust to the new rate path.
Plan & Execution
* Gold: Caution on the long side at these highs. The structure is fragile. Monitoring for a fade back to value versus genuine acceptance.
* DXY: Expect two-way trade as the liquidation stabilizes and inventory balances.
Talk to you for the next update.
Buy GCGC tested my level of interest according my morning analysis. Buying gold based on 15M engulfing candle

Selling GCBased on my morning analysis selling GC from Daily range high to the middle of the range. Going for 1:2 RR
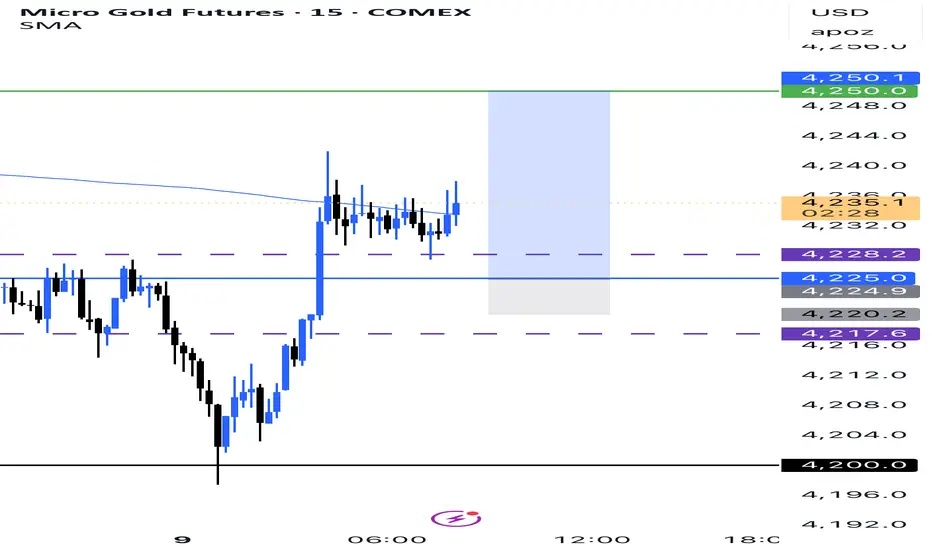
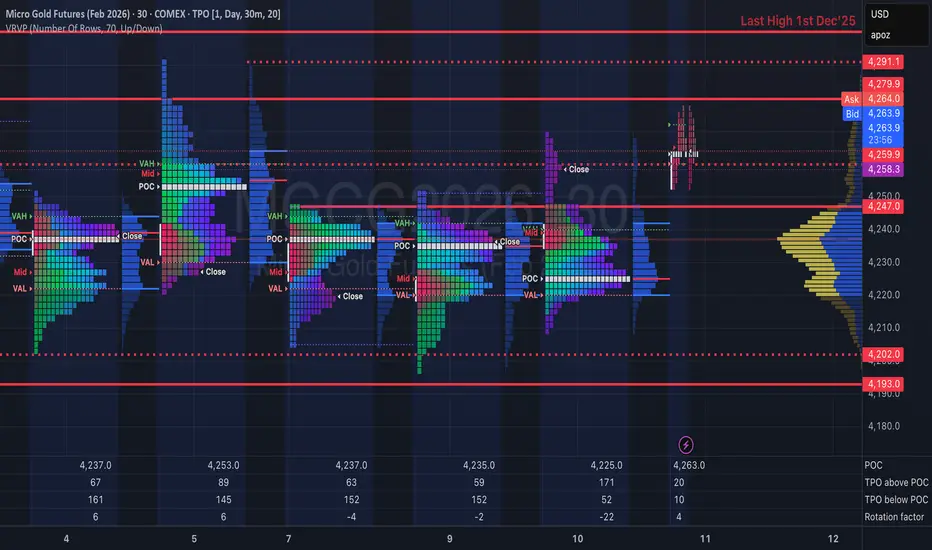
Gold Context: Reclaiming 4227 & Follow-Through FlowsFOREXCOM:XAUUSD COMEX_MINI:MGCG2026 COMEX:GC1!
Traders. Pre-US Open update on the developing structure.
Market Context (Reclaiming Value):
Gold has successfully rotated back above 4227, reclaiming Friday's trading range.
• The Flow: We observed initial short covering that found genuine follow-through. This indicates that the market is not just covering shorts but finding acceptance at these higher prices.
• Structural Shift: By trading back inside Friday's range, the auction has negated the immediate bearish pressure seen at the lows.
Structure & Outlook:
• The Pivot (4227): This level is now our key reference. As long as Gold facilitates trade above 4227, the bias remains constructive (Long).
• The Target: The immediate destination for this rotation is 4250.
• Condition: We need to see the US Open maintain this bid and not fall back below the 4227 shelf.
Plan & Execution:
• Bias: Long / Constructive.
• Invalidation: A failure to hold 4227 would put the auction back into a weak position.
Talk to you for the next update.

Gold Futures - Daily view !Gold Futures - Daily view ! -Short term balancing and cluster zone to monitor !
Dec 9 Daily trade plan for GCGold is ranging recently. Looking for trades from range lows or highs. For today Previous Day low, Daily equal lows and Previous Week low seem like a target. I will be looking to sell into these lows or buy after lows are sweapt

Gold Bulls Are Making Hard Work of New HighsI remain sceptical of gold’s latest bounce and continue to look for signs of a swing high. A less-dovish — or relatively hawkish — Fed cut this week could be the catalyst for a stronger US dollar and lower gold. Either way, it’s hard to imagine gold breaking back above its record high without a meaningful dip first.
Matt Simpson, Market Analyst at City Index.
