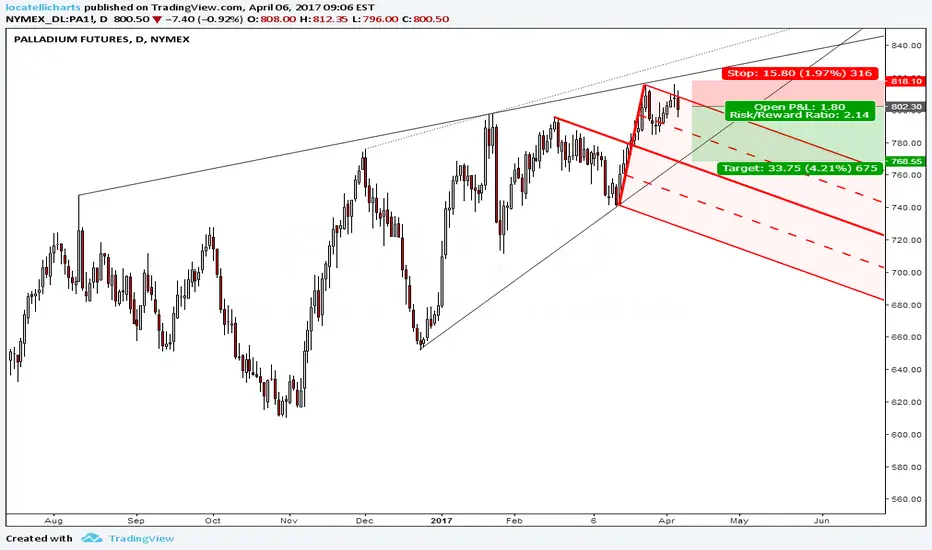
Palladium: Watching for the Moment to ShortPalladium Futures have been the second strongest performing future in 2017 so far . Yet my analysis is providing me several reasons to begin watching closely for an opportunity to short.
I am still a neophyte in Elliott Wave analysis but it seems very possible that we are nearing the end of an three wave correction which began January 2016. In this scenario Wave (C) has recently reached 1.618 * Wave (A), and is taking the form of what seems to be an ending diagonal triangle which looks close to completion.
Palladium has retraced and is currently trading at the .786 of the drop from the All-Time High which began in 2014
Two bearish patterns -- shark and bat -- are close to their completion points. A capitulation over the top of the ending diagonal triangle which is apparently typical of the pattern would likely drive the price to these levels.
There is bearish divergence in the weekly RSI and AO
It is important to wait for the confirmation of this analysis before going short, especially if there may be one more push up. Speculators are currently 72% long and the higher this number the better I will feel going against them (although using the COT is something I am still learning about as well!). I will continue analysis on the daily time frame and perhaps the 4 hour to try and get a more precise entry.
If you have any comments or feedback on this idea or your own analysis of Palladium please share!
Palladium Futures
No trades
Trade ideas

Palladium daily chart with levelsNearing low of the day right now. Monitoring the signs of ev. further weakness. Update of

Palladium Up?June Palladium is looking for more upside. Using 785 as support, but there is an underlining downtrend present. Upside target 813.65 and if it can break the double top, 832. If this fails and 785 breaks, downside target trendline at 772 and possibly 770. PA must clear 801 and stay above that to make any headway.

Chart with Median LIne Not bad risk/reward ratio & nice pattern pull back on watch. Caution: trend is not Your friend here.
Palladium forming Bullish CypherJune Palladium is forming a bullish Cypher as it looks like we may see a triple top progression higher. RSI broke last week and Open Interest is starting to rise again. Next upside target 798 resistance and triple top, with target 804 forming 113% FIB. If fail, this might turn to bullish Gartley.

Palladium Bearish FlagJune Palladium created a bearish flag today from rise off of morning star doji Friday. Looking for confirmation tonight if this indeed a proper flag, or bounce to 766.30 resistance.

Palladium Finally FellJune Palladium finally took a nose dive today. Projecting a fall to 730 area. May fall further to the uptrend line, or rebound to fill out bullish Cypher.

Palladium Hit a WallJune Palladium rose overnight, then got hit with sells to end bearish. We still have a bullish flag with the last candle higher than other candles. We will see Monday if this is a continued channel, up market, or a down trend. The circled area shows a similar setup to what is happening now.

Palladium Bullish FlagPalladium created a bullish flag today and bounced off trend. Could triple top, which might indicate a continuation. Long term outlook could be 816.8 for Cypher C position. Cypher extension into the 840 range.

Palladium HammeredJune Palladium hammered today rejecting lower lows. We will see if it holds and a continued uptrend can happen. A bullish butterfly is in affect.

PalladiumPalladium produced a double top on Thursday and dropped. 772.85 is now support for June. H&S that was projected fell apart. Open interest continues to rise. See Palladium continuing upward after correction.
March Projection

Palladium: Multiple Bearish PatternsSo far Palladium has completed bearish 2618, AB=CD and Gartley Set-ups. The Gartley just triggered like 20 minutes ago and am pretty bummed I missed it. But there will be many more opportunities! Next I will be watching for a breakout of the wedge, or the formation of another bearish pattern.
Let me know your view!

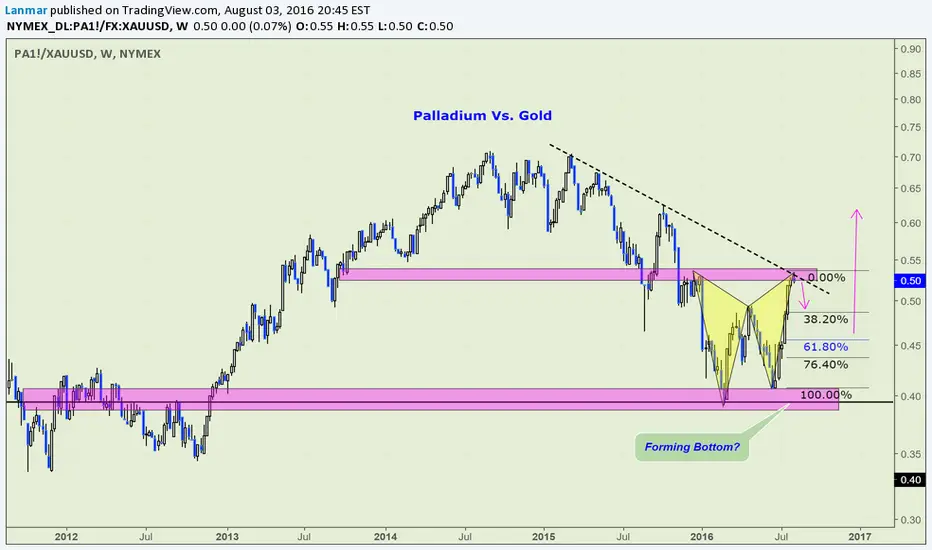
Palladium Vs. Gold I do not have much doubt that palladium topped against gold in the short term. Though, longer term, things look interesting for palladium against gold and silver - possibly a stronger run higher (or smaller run lower) than both metals.. I am currently short palladium with no position in gold or silver.
Pallidium Head and shouldersPalladium has made the top of the last shoulder. Has tried three times to move higher, but has come under resistance. Major resistance is at 773.25 from back at position A of the Cypher pattern. Possible down day tonight and into tomorrow. Target down is 740. Full H&D target 700.


PalladiumPalladium had a small up day today. Waiting to see if this flags bearish or bullish. Using the head and shoulders that might continue, suggesting bearish flag tomorrow and down Thursday and into Friday. Otherwise this market will continue to creep up. June Palladium in the same situation.

PalladiumVery interesting market Palladium. Can make a lot of money fast, or loose it all. Been watching this for a couple of weeks now. If you don't know, Palladium is used in catalytic converters. Since the drop in oil prices for 2016, the car industry have seen an uptrend. 2017 may shape out that same way as there is too much anxiety that the OPEC agreement won't amount to much. Since Palladium is scarce, this market may continue to rise. March and June Palladium have been building out a head and shoulders pattern. Right now there is a bullish flag forming.
Unlike other markets, this market produces textbook signals. At least so far. The grid is based on a $2000 dollar move. If you had the courage and money to play this market since September 30, you would have reaped $54,000 per contract.


Palladium potential H&SWhile I'm generally bulled up on metals but palladium could be running into a right shoulder

Palladium Continuation of UPTRENDCould reach 785 tonight, good continuation pattern, palladium has had an impulse then corrected itself now for another impulse.

Palladium - DailyI'm long PALL (etf) from 61.20.
White count, while valid, is suspect given the deep wave 4 (below the 61.8% extension). I've added the blue count--a variation of sub-divisions in wave (3) with much higher targets.
Given the rally stalled at the 100% extension off the lows, then failed to hold the 61.8% extension, I'm not sure the full impulse will play out to (5) or whether some kind of corrective move higher might be operative. Regardless, holding long for now with no complaints.

