SI | wk 50 | 1hr chartT.A explained -
BackSide (BS)
FrontSide (FS)
Inverse BS (Inv.BS)
Inverse FS (Inv.FS)
BS & FS levels are expected support when dashed lines, tested when dotted and resistance when solid lines.
The inverse is true for the Inv. BS Inv. FS levels, they are resistance as dashed lines, tested as dotted
Silver Futures
No trades
Related commodities


Silver Futures - SI - Daily viewSilver Futures - SI - Daily view - Hanging around short term extensions !!!

Silver pump vs the Algo - Who will win?COMEX:SI1! COMEX_MINI:SIL1! TVC:SILVER
The algorithm has reached a terminal exhaustion state at the 4.0 Standard Deviation Macro-Extension effectively completing the parabolic expansion cycle initiated from the 2024 lows.
The current price action represents a 'Distribution Node' at the 60.00

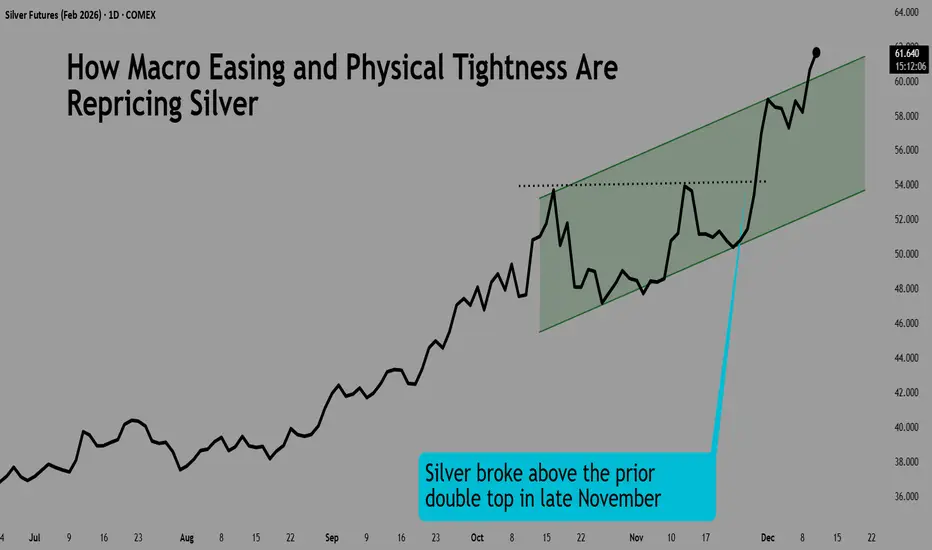
How Macro Easing and Physical Tightness Are Repricing SilverSilver prices have surged to unprecedented highs as 2025 draws to a close. In early December, silver pushed above USD 58 per ounce, marking a nominal all-time high (surpassing the 1980 and 2011 peaks) and nearly doubling in value from the start of the year.
This extraordinary rally underscores s
I was bullish silver at the BEST optimal time possible! I know how to spot lower risk entry points, where the GREATEST gains, in the SHORTEST amount of time, is most likely.
I was bullish silver at the BEST optimal time possible!
Now most are jumping onboard at a LESS optimal time...
Opportunity :: LONG Silver (Micro)As they say, data says it all.
Silver is systematically rising in a channel on the back of global news and issues.
Data suggests no weakness and upward targets of 189,000 and 202,000.
Good entry point could be near 179,000. This level is 5 EMA support too. Break down or closing below this leve

SILVER: Still Bullish! Buy The Dip!In this Weekly Market Forecast, we will analyze the XAGUSD (SILVER) for the week of Dec. 15 - 19th.
Silver .... still strong! With a weakened USD due to an interest rate cut by the Fed, there are no headwinds to offer resistance.
Be mindful that this market is overextended, and a pullback is pen

Si1! - A "Short" Silver Heads-UpWhat we see on these two charts are two different Andrews Pitchforks.
- same time window
- different time period
- different pitchfork placement
The left chart maps the pendulum swings.
The right chart maps the real swings.
LEFT CHART
The market has almost reached the maximum stretch point, arriv

SILVER TARGET topping 59/64 I would watch 61.80 The chart posted is My work in silver BUBBLE aka dec jan 1980 somethings just get better than this ! Best of trades WAVETIMER

See all ideas
Summarizing what the indicators are suggesting.
Neutral
SellBuy
Strong sellStrong buy
Strong sellSellNeutralBuyStrong buy
Neutral
SellBuy
Strong sellStrong buy
Strong sellSellNeutralBuyStrong buy
Neutral
SellBuy
Strong sellStrong buy
Strong sellSellNeutralBuyStrong buy
A representation of what an asset is worth today and what the market thinks it will be worth in the future.
Frequently Asked Questions
The current price of Silver Futures is 310.0 JPY — it has fallen −0.32% in the past 24 hours. Watch Silver Futures price in more detail on the chart.
The volume of Silver Futures is 2.00. Track more important stats on the Silver Futures chart.
The nearest expiration date for Silver Futures is Oct 27, 2026.
Traders prefer to sell futures contracts when they've already made money on the investment, but still have plenty of time left before the expiration date. Thus, many consider it a good option to sell Silver Futures before Oct 27, 2026.
Open interest is the number of contracts held by traders in active positions — they're not closed or expired. For Silver Futures this number is 59.00. You can use it to track a prevailing market trend and adjust your own strategy: declining open interest for Silver Futures shows that traders are closing their positions, which means a weakening trend.
Buying or selling futures contracts depends on many factors: season, underlying commodity, your own trading strategy. So mostly it's up to you, but if you look for some certain calculations to take into account, you can study technical analysis for Silver Futures. Today its technical rating is strong buy, but remember that market conditions change all the time, so it's always crucial to do your own research. See more of Silver Futures technicals for a more comprehensive analysis.