Silver Futures
No trades
Market insights

SI | Wk 51T.A explained -
BackSide (BS)
FrontSide (FS)
Inverse BS (Inv.BS)
Inverse FS (Inv.FS)
BS & FS levels are expected support when dashed lines, tested when dotted and resistance when solid lines.
The inverse is true for the Inv. BS Inv. FS levels, they are resistance as dashed lines, tested as dotted and support as solid lines.
Monthly timeframe is color pink
weekly grey
daily is red
4hr is orange
1hr is yellow
15min is blue
5min is green if they are shown.
strength favors the higher timeframe.
2x dotted levels are origin levels where trends have or will originate. When trends break, price will target the origin of the trend. its math, when the trend breaks, the vertex breaks too so the higher timeframe level/trend that breaks, the more volatility there could be as strength in the orders flow in to fuel the move.

SI (silver) UpdateSI MFI went oversold Thu night so I bought some calls Friday, flipped them on open today. I think it will melt up until MFI goes overbought, but I didn't re-enter because I don't expect a big pop up overnight.
SLV calls are expensive, but silver can pop up big, so if you time it right there is definitely money to be made. My return was over 100% with Friday's calls (one week of premium).
Timing is key, not playing the melt up. I finally figured out how to post on my phone, so maybe next time I'll post the trade when I enter.

SILVER: Still Bullish! Buy The Dip!In this Weekly Market Forecast, we will analyze the XAGUSD (SILVER) for the week of Dec. 15 - 19th.
Silver .... still strong! With a weakened USD due to an interest rate cut by the Fed, there are no headwinds to offer resistance.
Be mindful that this market is overextended, and a pullback is pending.
There is a +FVG to draw price to it below. That would make a great area to look for dip buying opportunities.
Enjoy!
May profits be upon you.
Leave any questions or comments in the comment section.
I appreciate any feedback from my viewers!
Like and/or subscribe if you want more accurate analysis.
Thank you so much!
Disclaimer:
I do not provide personal investment advice and I am not a qualified licensed investment advisor.
All information found here, including any ideas, opinions, views, predictions, forecasts, commentaries, suggestions, expressed or implied herein, are for informational, entertainment or educational purposes only and should not be construed as personal investment advice. While the information provided is believed to be accurate, it may include errors or inaccuracies.
I will not and cannot be held liable for any actions you take as a result of anything you read here.
Conduct your own due diligence, or consult a licensed financial advisor or broker before making any and all investment decisions. Any investments, trades, speculations, or decisions made on the basis of any information found on this channel, expressed or implied herein, are committed at your own risk, financial or otherwise.

Silver on its way to 89.51 $SI_FWith the depth of the rounded bottom looking for a pause on the #silver futures $SI_F at $89.51 then up to $100 or higher.

Silver OverboughtSilver looks overextended here, with a bear wedge clearly forming, who knows where this thing will land if the structure continues forward as seems likely, which is to the downside

Opportunity :: LONG Silver (Micro)As they say, data says it all.
Silver is systematically rising in a channel on the back of global news and issues.
Data suggests no weakness and upward targets of 189,000 and 202,000.
Good entry point could be near 179,000. This level is 5 EMA support too. Break down or closing below this level needs to be followed closely.

Silver MCX Future - Intraday Technical Analysis - 15 Dec., 2025MCX:SILVER1!
Silver MCX Futures — Chart Pathik Intraday Levels for 15-Dec-2025
(If these levels add value to your trades, a quick boost or comment goes a long way in supporting this free content and keeping our trading community thriving!)
Silver Futures are trading near 192,615, rebounding after a vertical sell-off and now hovering just below the zero line at 192,851 and the Long Exit at 193,361, turning this band into the key intraday decision zone. The market is trying to stabilise after liquidation from the 199,981 region, with both trapped longs and fresh shorts watching this pivot closely.
Bullish Structure
Longs activate above the Long Entry level at 197,207 only after price reclaims 193,361–194,485 (Long Exit plus Short Entry zone) and sustains above the zero line at 192,851.
Targets: 199,981 (Long Target 1 / primary booking zone) and 204,389 (Long Target 2 / extended upside if short-covering accelerates).
Control: Any counter-trend long attempts from near 192,000–192,851 should keep tight risk under 192,000 and ideally 190,000, because a fresh breakdown can quickly reopen lower targets.
Bearish Structure
Shorts remain preferred while price trades below 193,361–194,485 and especially on rejection from this resistance band after the bounce.
Fresh shorts open on rallies into the Short Entry at 194,485, or if the current rebound fails and candles slip back convincingly under the zero line at 192,851.
Targets: 185,721 (Short Target 1 / first profit zone) and 181,313 (Short Target 2 / extended downside if selling pressure resumes).
Neutral Zone
192,851 is today’s inflection—expect whipsaws and stop-hunting behaviour while silver oscillates between roughly 192,000 and 193,361 without decisive 15‑minute closes beyond either edge.
Every setup is designed for structure, plan, and logic—let the chart work for you, not your emotions.
Boost or comment if these levels help your preparation—help Chart Pathik keep delivering quality analysis to more intraday traders!

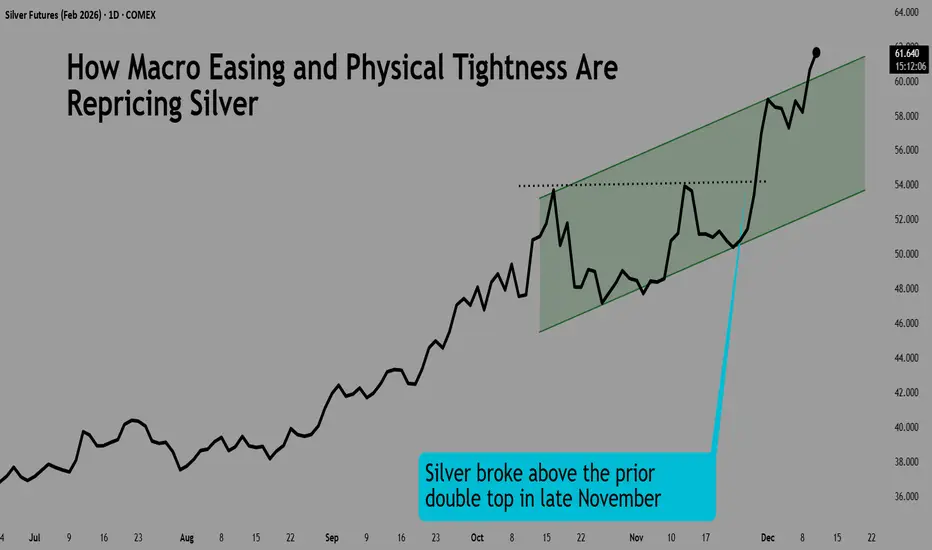
How Macro Easing and Physical Tightness Are Repricing SilverSilver prices have surged to unprecedented highs as 2025 draws to a close. In early December, silver pushed above USD 58 per ounce, marking a nominal all-time high (surpassing the 1980 and 2011 peaks) and nearly doubling in value from the start of the year.
This extraordinary rally underscores silver’s dual nature as both an industrial commodity and a safe-haven asset, driven by a perfect storm of robust demand, persistent supply deficits, and supportive macroeconomic conditions.
Macroeconomic Shifts and a Softer U.S. Dollar
Monetary policy tailwinds have bolstered silver’s ascent.
After keeping interest rates at a restrictive high throughout most of 2025, the Federal Reserve began easing with a 25 bps rate cut in October, and markets widely anticipate another cut at the upcoming December 9–10 meeting.
CME FedWatch shows 86% odds of a December rate reduction as against last month’s 69% probability, following recent weak jobs data, with jobless claims diving to a multi-year low. Analysts believe private investors increased allocations after those cuts, considering silver a higher-beta alternative to gold.
Source: CME FedWatch
ADP’s private data showed a drop of 32,000 roles in November, with wage growth also on a downward trend.
The prospect of Fed easing has weakened the U.S. dollar and lowered bond yields, enhancing the appeal of non-yielding assets like silver.
Earlier this year, traders rushed massive volumes of silver into U.S. vaults earlier in order to avoid tariffs, and while this temporarily ballooned U.S. inventories, it drained liquidity from overseas markets and stoked fears of shortages.
This time around, tariffs risk has increased owing to silver being included in the critical minerals list, making fear an additional driver along with macro dynamics, even as industrial demand is not growing as fast.
Physical Market Tightness and Industrial Demand
Silver’s recent price surge is being driven by an exceptionally tight physical market. Global demand is again set to outpace supply in 2025, marking the fifth consecutive year of deficit. Even with mine output holding steady, the Silver Institute projects a 95-million-ounce shortfall, bringing the cumulative deficit since 2021 to nearly 820 million ounces.
By October, London, the world’s main physical trading hub, saw heavy drawdowns in vault stockpiles as metal was shipped out to meet surging U.S. and Indian demand, leading to a collapse in free-float inventory. Silver lease rates in London spiked above 11%, an extraordinarily high level, reflecting the urgency to obtain physical metal.
Meanwhile, a geographic dislocation emerged. So much silver was shipped into U.S. COMEX warehouses this year (ahead of tariffs) that record inventories accumulated – over 530 million ounces by October.
Source: DataTrack
Since then, with tariff risks alleviated, the metal began shifting to London again, seeing as the spot there was now higher than in the United States as of 04/Dec, COMEX inventories are back to mid-March levels.
Crucially, industrial demand remains a strong pillar beneath the silver market, even if it isn’t growing all that fast. Even though high prices have prompted some thrifting, where less silver is used per device, total industrial usage is still projected to reach roughly 665 million ounces in 2025, 2% below last year’s record.
Green technologies continue to be a major silver driver. For perspective, solar energy alone likely accounted for on the order of 200 Moz of silver demand in 2024, and global EV manufacturing is estimated to add another 90 Moz in 2025. With new mining projects projected to add only about 44 Moz of additional annual supply over the next 5-10 years, these industrial needs ensure that any demand surge hits a supply wall.
While current industrial growth numbers may not look promising, it is more about the inelasticity of demand, which is still being met with persistent deficits. With investor buying on the rise, the chances of supply hiccups only increase.
Investor Flows and Market Positioning Favour Further Gains
By early November, global silver ETP holdings had swollen by roughly 18% YTD, putting total holdings near all-time highs. Importantly, about half of these ETP holdings are stored in London, meaning a large portion of the world’s investment silver became effectively tied up in vaults.
Physical investment demand is robust as well. India, the world’s largest silver importer, saw buoyant buying even at record rupee prices, with continued accumulation of silver on price dips.
The iShares SLV ETF netted inflows of USD 1,227.6 million over the past 3 months.
After starting the year above 100:1, the gold: silver ratio fell to sub-72 by December, the lowest in over a year. This reflects silver vastly outperforming gold in percentage terms, though the ratio remains above long-term averages of about 67, which is expected to be hit by June 2026.
CME QuikStrike shows that the options contract expiring late February has the second largest OI as of today, following the Dec/25 contract.
Source: CME QuikStrike
For SOH6, the strike-wise open interest shows a concentration of much higher call OI at OTM strike levels than for OTM puts.
Overall put-call ratio for this contract is outrightly bullish at 0.54, which is lower than the average of all expiries (0.68).
Source: CME QuikStrike
The last time the gold-silver ratio was this low, after having retreated from a peak, was in December 2020.
During that period of GSR dipping from current levels to the long-term average, silver futures rallied by 21.8%.
The P&L for entering a long futures trade during that period would be as follows:
Contract size : 5,000 troy ounces
Entry : 25.00
Exit : 29.40
Price move : 29.40 − 25.00 = $4.40/oz
Dollar P&L per contract : 4.40 × 5,000 oz = 22,000 USD per contract
Given the lower bound of our ETA on mean reversion is 49 days, selecting a contract that expires in Feb/2026 is useful.
Investors can also utilise CME Micro Silver futures, which offer smaller notional positions and greater flexibility. Each Micro contract is priced in USD per ounce and represents 1,000 ounces of silver, compared to 5,000 ounces for the standard contract.
This content is sponsored.
MARKET DATA
CME Real-time Market Data helps identify trading set-ups and express market views better. If you have futures in your trading portfolio, you can check out on CME Group data plans available that suit your trading needs tradingview.com/cme .
DISCLAIMER
This case study is for educational purposes only and does not constitute investment recommendations or advice. Nor are they used to promote any specific products, or services.
Trading or investment ideas cited here are for illustration only, as an integral part of a case study to demonstrate the fundamental concepts in risk management or trading under the market scenarios being discussed. Please read the FULL DISCLAIMER the link to which is provided in our profile description.
Si1! - A "Short" Silver Heads-UpWhat we see on these two charts are two different Andrews Pitchforks.
- same time window
- different time period
- different pitchfork placement
The left chart maps the pendulum swings.
The right chart maps the real swings.
LEFT CHART
The market has almost reached the maximum stretch point, arriving at the U-MLH. A reversal toward the centerline is very likely, as the market tends to seek balance after such an extreme stretch. Classic mean reversion.
RIGHT CHART
Here we see that silver has reached the centerline - the classic 80% target for a pitchfork trader. From here, the market can break/zoom through the centerline, retest it, and continue upward. In the LEFT chart, this would correspond to a larger stretch toward Warning Line 1. Or the market may turn at the centerline because it has found its balance, which in the LEFT chart would confirm the stretch-and-turn scenario.
Either way, caution is warranted. I would at least take partial profits (50% is always good) and treat myself to an enjoyable Christmas party!
Anyone who would like to learn more about pitchforks, please read my bio here on TradingView.
Happy profits to you Silver Arrows §8-)


The 2025-2026 Silver Rally + 3-Step Rocket Booster Strategy--
Let me tell you
the amount of research i did
just to be able to confidently write
this message to you has been insane and hard.
And i went down a rabbit hole.
I couldn't stop but i had to come out
for fresh air.
This is what i have found... during
this data of research this is
the most fear i have ever felt.
Let me tell you why...
When i began trading around
2017 silver was one of the first
assets i bought on
margin.
I did this during February
around 2018
i lost all my money on this trade
i remember i kept buying silver COMEX:SI1!
and the price kept crashing..
today the margin level for silver
is high!!
At that time i could only
buy like "x2" margin.
At that time this was considered
very volatile
and expensive.
It was so expensive that
you could lose
your money in one bad trade
Today the margin level is super high around
"20x " minimum bro
the amount of fear from the past
has stuck with me
because at the time
i risked all i had it wasn't much
but i had to go all in to
learn how to trade well.
This was a dark peroid of my life
and now full circle
i cant believe it
am back here again
but this time
am truly humbled
and my fear now is way more higher..
if this trade doesn't go well
am done...
am hanging my gloves with this trading stuff
and going to work a job
at a fast food business
atleast i can eat the food for free
in the back.
Even if am mopping floors and taking out
trash.
But now am going to put in something
special the rocket booster
strategy it has 3 steps:
-The price has to be above the 50 EMA
-The price has to be above the 200 EMA
-The price should increase in momentum or gap up
this last step is measured
by the RSI+Stochastic indicator.
This has been one of the most
challenging articles
because it reminds me
to be humble
and sharing it with you is not easy
so am wishing you happy holidays
because sharing this with you is my gift
and am saying thank you for
following me
and trusting me to help you
on your trading
the rocket booster
strategy is the reason
why i have reached this far on
my trading journey...
In other news the oil and gas
companies seem to be trending
up for example companies like NASDAQ:FANG
follow the rocket booster
strategy and looks like a good buying investment
Long term
If you want you can learn more
about oil and gas companies.
Because i believe this is another trend
going on in the back ground.
Rocket boost this content to learn more
thank you for reading.
Happy Holidays and enjoy!
Disclaimer: Trading is risky please learn about
risk management and
profit taking strategies
Also feel free to use a simulation trading account
before you trade with real money.

Silver MCX Futures — Intraday Technical Analysis for 23-Dec-25MCX:SILVER1!
Silver MCX Futures — Chart Pathik Intraday Levels for 23-Dec-2025
(If these levels add value to your trades, a quick boost or comment goes a long way in supporting this free content and keeping our trading community thriving!)
Silver Futures are trading near 212,888, moving sideways just above the zero line at 212,872 after a strong prior rally, making this band the key intraday pivot between continuation higher and a deeper pullback.
Bullish Structure
Longs remain active above the Long Entry band at 212,799–212,879 as long as price holds the Add Long Pos. level at 212,164 on dips.
Targets: 216,196 (Long Target 1 / primary booking zone) and 218,250 (Long Target 2 / extended move if bullish momentum resumes).
Control: Stops or trailing risk can be managed around 211,529–211,006 (Short Entry and Long Exit) to protect against trend failure.
Bearish Structure
Shorts become attractive on persistent rejection from 212,872–213,322 (zero line and Short Exit) with lower highs forming.
Downside focus: 209,548 (Short Target 1 near Day Bias – Buy 209,475) and 207,494 (Short Target 2) if sellers drag price back towards the prior demand zone.
Control: Quick covers are needed if price sustains above 213,322, where bearish structure weakens and a squeeze towards 216,196 can start.
Neutral Zone
212,872 is today’s inflection—expect choppy, stop-hunting action while silver oscillates between roughly 212,164 and 213,322 without decisive 15‑minute closes beyond either edge.
Every setup is designed for structure, plan, and logic—let the chart work for you, not your emotions.
Boost or comment if these levels help your preparation—help Chart Pathik keep delivering quality analysis to more intraday traders!

Chandi Hi Chandi!Chandi is trying to reach till Chand!
Today Silver Future has touched 214583 which is Life time high as of now....
Today after giving a new LTH it is showing the sign of Distribution here.
If Silver Breaks down todays low which is 209000 which is a Support in 1 Hr time Frame it can turn Bearish as also we can see Divergence of RSI is Daily Time Frame.
Once Silver Turns Bearish we can see the level of 180000 in next few weeks.
level of 180000 will be very crucial as if it breaks this level also next stop will be 140000
and if it takes Support from 180000 and shows Bullish Sign here one can invest small qty here well 140000 will be a very good level to invest in Silver.
Lets see!

SI | Week 52 | 1hr chartT.A explained -
BackSide (BS)
FrontSide (FS)
Inverse BS (Inv.BS)
Inverse FS (Inv.FS)
BS & FS levels are expected support when dashed lines, tested when dotted and resistance when solid lines.
The inverse is true for the Inv. BS Inv. FS levels, they are resistance as dashed lines, tested as dotted and support as solid lines.
Monthly timeframe is color pink
weekly grey
daily is red
4hr is orange
1hr is yellow
15min is blue
5min is green if they are shown.
strength favors the higher timeframe.
2x dotted levels are origin levels where trends have or will originate. When trends break, price will target the origin of the trend. its math, when the trend breaks, the vertex breaks too so the higher timeframe level/trend that breaks, the more volatility there could be as strength in the orders flow in to fuel the move.


SILVER TARGET topping 59/64 I would watch 61.80 The chart posted is My work in silver BUBBLE aka dec jan 1980 somethings just get better than this ! Best of trades WAVETIMER

I was bullish silver at the BEST optimal time possible! I know how to spot lower risk entry points, where the GREATEST gains, in the SHORTEST amount of time, is most likely.
I was bullish silver at the BEST optimal time possible!
Now most are jumping onboard at a LESS optimal time...
Silver Futures - SI - Daily viewSilver Futures - SI - Daily view - Hanging around short term extensions !!!

SI | wk 50 | 1hr chartT.A explained -
BackSide (BS)
FrontSide (FS)
Inverse BS (Inv.BS)
Inverse FS (Inv.FS)
BS & FS levels are expected support when dashed lines, tested when dotted and resistance when solid lines.
The inverse is true for the Inv. BS Inv. FS levels, they are resistance as dashed lines, tested as dotted and support as solid lines.
Monthly timeframe is color pink
weekly grey
daily is red
4hr is orange
1hr is yellow
15min is blue
5min is green if they are shown.
strength favors the higher timeframe.
2x dotted levels are origin levels where trends have or will originate. When trends break, price will target the origin of the trend. its math, when the trend breaks, the vertex breaks too so the higher timeframe level/trend that breaks, the more volatility there could be as strength in the orders flow in to fuel the move.

Silver pump vs the Algo - Who will win?COMEX:SI1! COMEX_MINI:SIL1! TVC:SILVER
The algorithm has reached a terminal exhaustion state at the 4.0 Standard Deviation Macro-Extension effectively completing the parabolic expansion cycle initiated from the 2024 lows.
The current price action represents a 'Distribution Node' at the 60.00 psychological event horizon where the Smart Money is actively offloading inventory into late retail buyers before initiating a high-velocity repricing event to the 54.020 algorithmic equilibrium.
Entry: 58.850 (Market Execution / Sell Limit)
Stop loss: 60.150 (1.300 points)
Take profit: 54.020 (4.830 points)
Risk to reward ratio: 3.71R
The Opportunity
The Monthly chart reveals the absolute truth: Price has struck the 4.0 Standard Deviation projection. In the realm of IPDA, this is the 'Statistical Extremity'—a zone where the probability of continued vertical expansion collapses to near zero and the probability of a mean reversion increases exponentially.
The market has left a massive 'Liquidity Void' between 54.00 and 58.00. This is not structural support; it is thin air. The algorithm abhors this vacuum. The 54.020 level identified is not merely a support level; it is the 'Fair Value' origin of the final impulse leg. The market must return here to close the circuit and validate the breakout.
The Entry
Entering short at the 58.850 region capitalizes on the 'bull trap' formed by the failure to displace above 59.50. The 8-hour chart shows a loss of momentum and the formation of a 'Rounded Top' distribution profile.
The algorithm is currently holding price up solely to induce 'Fear of Missing Out' (FOMO) longs. Once the Asian/London liquidity is swept, the floor will be removed, and the price will seek the path of least resistance: down through the vacuum.
The Invalidation
The bearish causal chain is ontologically corrupted if price achieves a daily close above the 60.150 Omega Point.
A breach of this level would imply that the market has entered a 'Hyper-Inflationary' discovery mode, ignoring standard deviation constraints.
This would shift the probability manifold to the Primary Antithetical Chain targeting the 62.00-65.00 vector.
Key Trajectory Waypoints
Target 1: 57.200 | Type: Immediate Structural Low | Probability: 85% | ETA: 24-48 Hours
Target 2: 55.500 | Type: 1.5 SD / Mid-Void | Probability: 70% | ETA: End of Week
Target 3: 54.020 | Type: The Great Rebalance | Probability: 55% | ETA: 1-2 Weeks
The Shadow Reality
A 20% probability exists for the antithetical reality: The Flag Continuation.
In this scenario, the 58.00 level acts as a 'High Tight Flag' support, and the market consolidates sideways to burn time before one final thrust to 61.00.
This reality is confirmed if price refuses to trade below 57.80 for 48 hours.

Silver and Gold Flag and Pole PatternBoth Silver and Gold are forming Flag and pole pattern on charts. If the breakout sustains and prices go higher with support of relatively higher volumes, both commodities can achieve higher prices in near term. The momentum is currently on bulls side in both commodities but silver has more relative strength than gold. So watch both commodities for breakout.

SI (Silver Futures) UpdateSI went oversold on MFI, since SLV options are so expensive, I decided to go long on GLD calls instead on that afternoon drop. Looked like a mistake for most of the evening, lol. Probably still is because SLV calls will have a better return tomorrow.
But, I will follow my rule, never kick yourself when you make money.
This is why I track 3 hr futures on everything.
