December Altcoin Requests Only High Quality Picks This MonthFamily, December is a decision month. We are entering the final phase of the cycle where alts will either expand or get drained of liquidity. Positioning now matters.
📌 Deadline: December 6th, 2025
📌 Slots: 30 Alts.
📌 Criteria:
✔ Solid liquidity and clean structure
✔ Active narrative or ecosystem
Key data points
Previous close
—
Open
—
Day's range
—
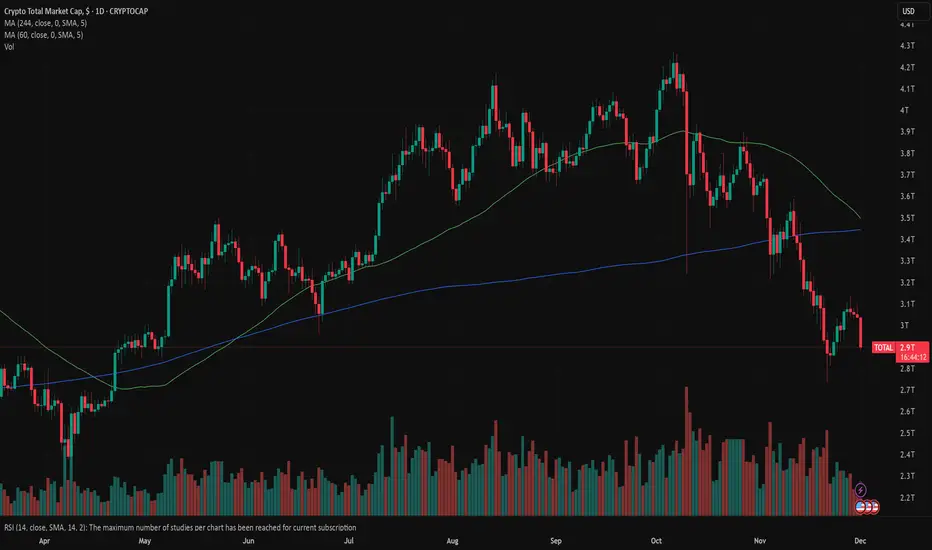
About Crypto Total Market Cap, $
A prepared trader is defined by their ability to see a bigger picture of a market. It applies to crypto traders too — if you agree, we've prepared a chart that will let you see the whole crypto market from a bird's-eye view. It shows total crypto market cap, which is calculated by TradingView by adding up top 125 coins market caps, which, in their turn, are the number of coins times their current price. A growing market cap can indicate investors' interest and their positive evaluation of the current market state. For you it might be a good indicator of where the wind blows and whether digital coins are a good investment tool.

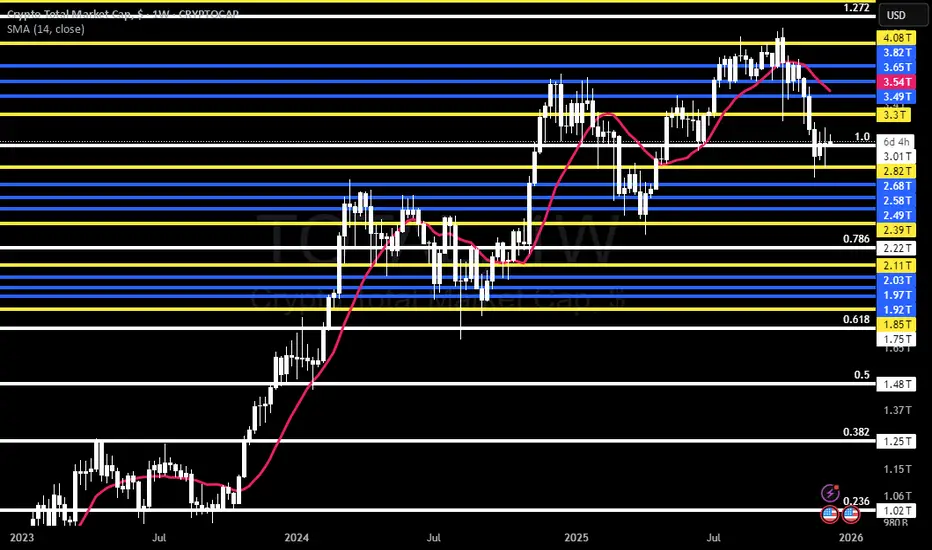
TOTAL - Could Be Time For A Significant Market BounceFollowing on from my previous thread where I revealed my exit before the market slump, TOTAL has done exactly what I said and slumped to the retracement Golden Window 0.618 - 0.786 - on chart .
Now it is printing a lower wick, this is the whipsawing signal that the market may be readying for a rea

MARKETS week ahead: December 7 – 13Last week in the news
September's PCE data was in line with market expectations, which supported investors expectations that the Fed might cut interest rates at December meeting. US equities continued to gain, where the S&P 500 managed to close the week at 6.870. This week gold was not in the spotl

MARKETS week ahead: November 30 – December 6Last week in the news
As US macro data started to be released on a regular basis, investors turned their sentiment to a positive side in expectations that the Fed might cut interest rates by another 25 bps in December. The S&P 500 had its five-days positive streak, closing the week at 6.849. The sa
TOTAL MC crypto Road Map , preparing for big Crash soonThis chart shows the waves and technical analysis something like smart money channels . That shows us the way total market is going to do . you can see the Head and shoulder pattern could form . and I think it will be formed . so after that Big crash it will happen.

Total Market Cap – 4H Analysis (Bearish Bias)Everyone,
My bias remains bearish, so I’ll focus mainly on short setups.
Here’s the quick breakdown:
Market Structure
A bullish MSS has formed, but price is still inside a HTF bearish OB.
This makes the current move a bullish correction within a bearish environment.
Scenario 1 – Bullish Pennant

End of Cryptocurrency CycleTOTAL1 is approaching a critical inflection point as the entire crypto market cap compresses inside a multi-year rising wedge, with price still grinding higher while internal momentum decisively weakens. The structure shows classic late-cycle exhaustion: RSI has been carving a clean series of lower

Bear market? Bull market?I'd like to see TOTAL close above the upwards trend line - otherwise it's not looking good. I don't agree with all those who say "bear market" I mean, they may be right - but there is no confirmation yet until this happens.

Smooth Curves in a Volatile MarketThe week of Monday 21st November 2022, following a descent from its all-time high of £3.01 trillion, the total crypto market cap registered a low of £727.58 billion.
On the week of Monday 27th March 2023, the 14-week Simple Moving Average (SMA) crossed above £1.02 trillion.
On Monday 11th December
TOTAL AnalysisFollowing the recent significant correction, which saw a decline from the $ 3.14T level to $ 2.61T, the Total Crypto Market Cap (TOTAL) appears to have entered a phase of recovery and base-building. The price action observed on the 2-hour chart indicates a classic reversal pattern, strengthening the

See all ideas
Summarizing what the indicators are suggesting.
Oscillators
Neutral
SellBuy
Strong sellStrong buy
Strong sellSellNeutralBuyStrong buy
Oscillators
Neutral
SellBuy
Strong sellStrong buy
Strong sellSellNeutralBuyStrong buy
Summary
Neutral
SellBuy
Strong sellStrong buy
Strong sellSellNeutralBuyStrong buy
Summary
Neutral
SellBuy
Strong sellStrong buy
Strong sellSellNeutralBuyStrong buy
Summary
Neutral
SellBuy
Strong sellStrong buy
Strong sellSellNeutralBuyStrong buy
Moving Averages
Neutral
SellBuy
Strong sellStrong buy
Strong sellSellNeutralBuyStrong buy
Moving Averages
Neutral
SellBuy
Strong sellStrong buy
Strong sellSellNeutralBuyStrong buy
Displays a symbol's price movements over previous years to identify recurring trends.