GOLD vs. TOTAL MARKET CAP. Gold touched the top band of the HTF rising wedge structure and the 0.618 Fib channel... then rejected.
This view appears to be a multi-year high.
So where is Total Market Cap at this point?
At the base of the same structure...
Is one's journey ending and the other's run beginning?
The crypto ma
Key data points
Previous close
—
Open
—
Day's range
—
About Crypto Total Market Cap, $
A prepared trader is defined by their ability to see a bigger picture of a market. It applies to crypto traders too — if you agree, we've prepared a chart that will let you see the whole crypto market from a bird's-eye view. It shows total crypto market cap, which is calculated by TradingView by adding up top 125 coins market caps, which, in their turn, are the number of coins times their current price. A growing market cap can indicate investors' interest and their positive evaluation of the current market state. For you it might be a good indicator of where the wind blows and whether digital coins are a good investment tool.

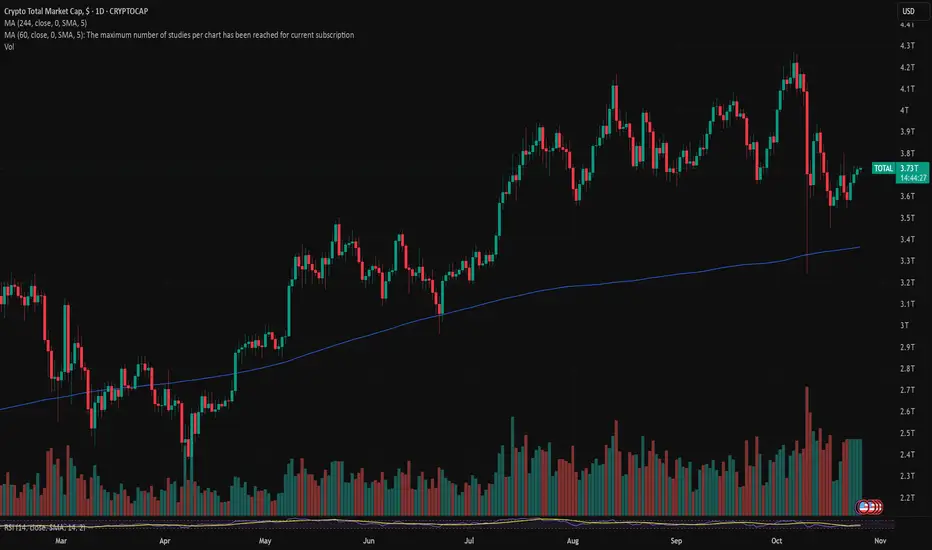
Total , still early As you see we are still playing on ATH on total chart which is only up because of bitcoin , they cycle either not started or it’s dead otherwise it should start to climb soon .

MARKETS week ahead: October 26 – November 1Last week in the news
The US September inflation data lifted market expectations on Fed rate cuts at the next FOMC meeting. This also shaped market sentiment, bringing the S&P 500 to its newest all time highest level for this year, at 6.807. At the same time, decreased investors' fears moved the pr
Total Crypto Market Cap – End of Cycle or Extended Phase?📊 Today let’s talk about the total crypto market capitalization.
Scrolling through the charts today, we were both surprised — and a bit shocked 😅 — to see that the current market drop perfectly aligns with the end of the cycle we calculated three years ago!
👉 Back in November 2022, we released a s
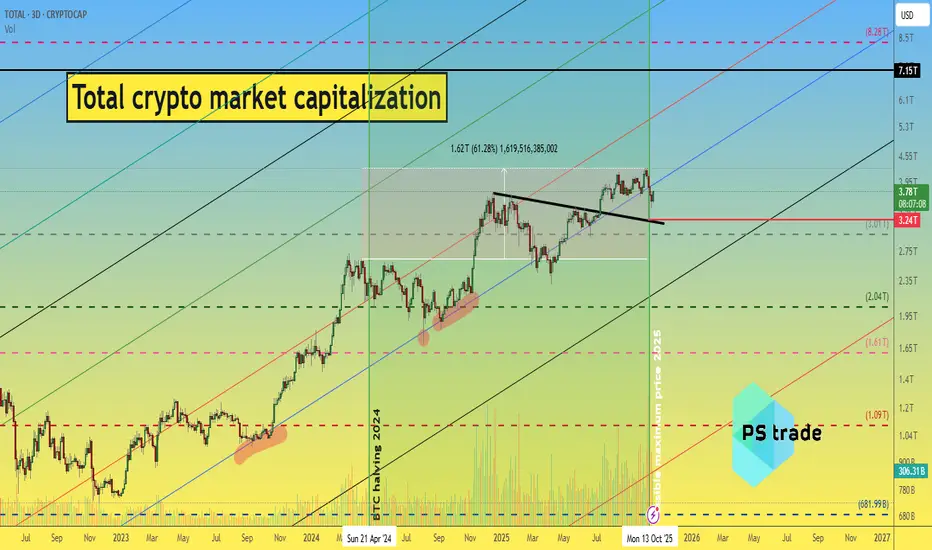
Total is getting close to a major technical crossroads.Total is still moving within the blue channel, now approaching resistance.
If the FED and BOJ events don’t go as expected, we’ll likely head lower within the channel.
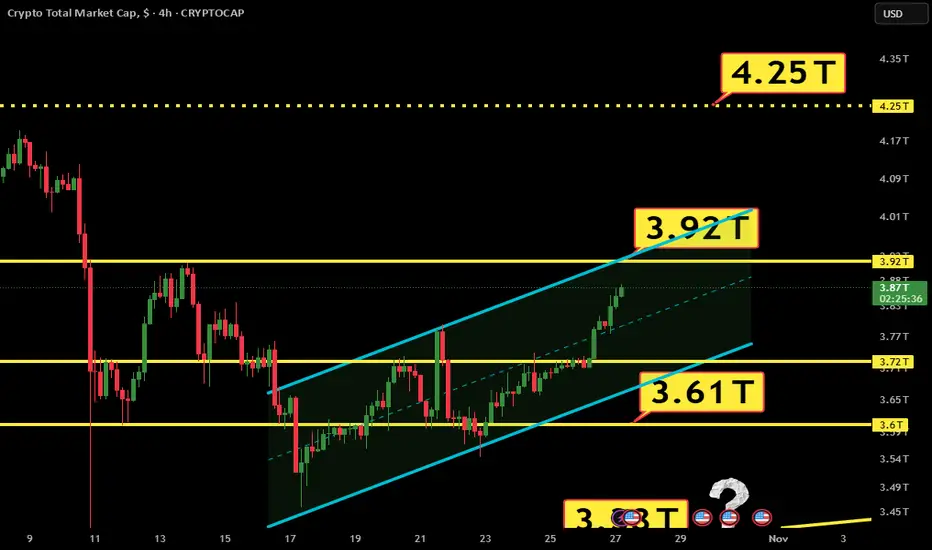
But if resistance breaks to the upside, the path toward 4.25 opens wide.
MARKETS week ahead: October 20 - 26Last week in the news
Fear was a predominant sentiment on financial markets during the previous week. The price of gold is clearly pointing to this for the last nine weeks. Gold reached another all time highest level on Friday at $4.380, but swiftly reverted back toward the $4.250K. The US equity m

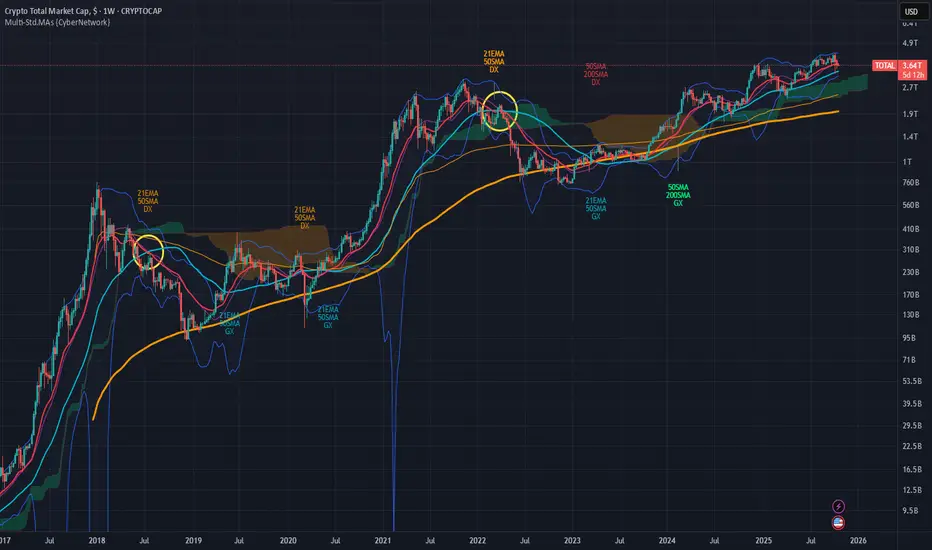
Crypto Bull Market End Indicator.Bull market ends when the RED 21 EMA crosses below the green 50 SMA line on the weekly chart of the Crypto TOTAL Market Cap.
Buying BTC and ETH (and KAS as well after this cycle) aggressively only when price has returned to around the thick orange 200 SMA line, and especially whenever it falls belo
what will happen the next 6 months its not a financial advice, just a theory
like it or not im posting it for myself

Riding the Crypto TOTAL Market Cap WavesHey stars ✨ — just popping in with a little dose of chart magic and market wisdom 🌙💫
I’ve been watching the TOTAL Crypto Market Cap chart (yes, the big picture one!) and something beautiful is forming — a rising channel pattern on the weekly timeframe. It’s like the market is climbing a staircase o

9.92 Trillion marketcap will be the start of the great bearthis is not a prediction on time just a white swan that will eventually come to pass as the future of earth is crypto currency😍

See all ideas
Summarizing what the indicators are suggesting.
Oscillators
Neutral
SellBuy
Strong sellStrong buy
Strong sellSellNeutralBuyStrong buy
Oscillators
Neutral
SellBuy
Strong sellStrong buy
Strong sellSellNeutralBuyStrong buy
Summary
Neutral
SellBuy
Strong sellStrong buy
Strong sellSellNeutralBuyStrong buy
Summary
Neutral
SellBuy
Strong sellStrong buy
Strong sellSellNeutralBuyStrong buy
Summary
Neutral
SellBuy
Strong sellStrong buy
Strong sellSellNeutralBuyStrong buy
Moving Averages
Neutral
SellBuy
Strong sellStrong buy
Strong sellSellNeutralBuyStrong buy
Moving Averages
Neutral
SellBuy
Strong sellStrong buy
Strong sellSellNeutralBuyStrong buy
Displays a symbol's price movements over previous years to identify recurring trends.