Total MCap- BULLISHWe are still looking looking bullish on the TMCap.
The ecosystem has been warmed up for the upcoming season.
Alts are waking up
Btc need some cooling ..
Trade ideas

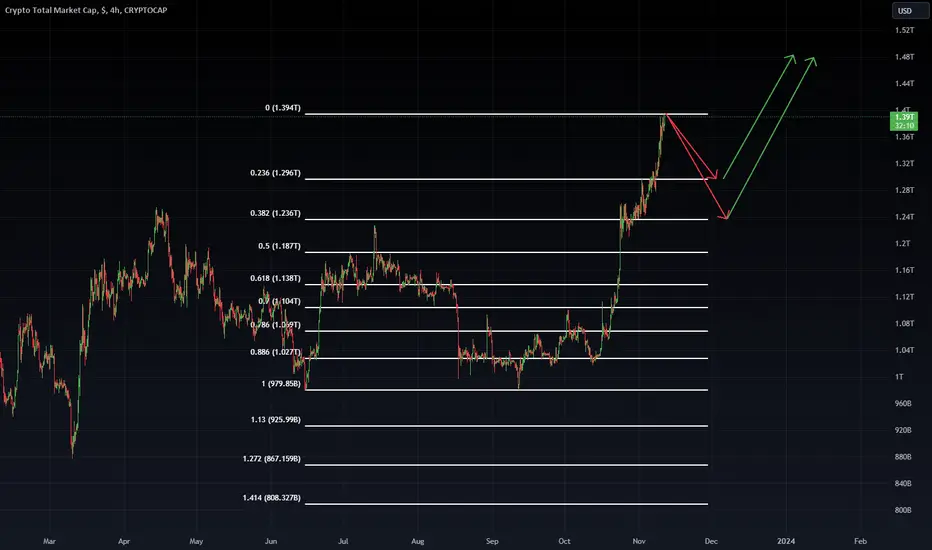
Crypto Total Market Capafter many weeks of up move crypto need a pull back there is a lot of untested LVL first major one comes around 1.154 this analysis gets invalid if total pushes above 1.33.

TOTAL MACRO ANALYSISTOTAL CRYPTO MARKET CAP;
-Has exploded since it entered into Ichimoku Cloud.
-Typically, we see prices reach the opposite side of the cloud.
-That area also lines up with the yellow neckline as resistance.
-I think we pump the remainder of the year for the most part.
-Could see a sell-off after the end of the year.
-I would think dips on the new year are for buying before the BTC halving
Please follow me here for more crypto analysis and a safer way to read charts to minimize risk.
**This idea is not financial advice, its just my 2 cents.
Thanks for your time!
~Cosmicbag

I'm still a bear!I noticed that we have reached the resistance of the upper boundary of the downtrend. I expect that from the current high we will begin our journey to new lows.
Regards,
Eugene

35 percent more market push bitcoin going to hit 57000 minimum35 percent more market push bitcoin going to hit 57000 minimum


total 1 target my target for total , is 1.8-2.2 , i have confidence that 2022 yearly open will be achieved at 2.2T . anytime between dec and feb2024 this target will be achieved imo .
this is not a financial advice
please follow me : www.tradingview.com
i am sharing my ideas there
thank you


🚨 Bye Bye Crypto! .... AGAIN 🚨Here is a list of all the ridiculous nonsense narrative that the the "pros" and media pump:
First they say: “Nobody knows what will happen”
Followed by the clown talk:
"Buy the dip" 🤡 🤡 🤡
"LFG"
"Santa rally" 🤡 🤡 🤡
"The tortoise and the hare"
"V-bottom recovery"
"Focus on the long term"
"It’s priced in" 🤡 🤡 🤡
"Stay invested" 🤡 🤡 🤡
"Transitory inflation" 🤡 🤡 🤡
"Tesla is the future" 🤡 🤡
"Bitcoin is the future " 🤡 🤡 🤡
"Elon is a genius" 🤡 🤡 🤡
"The ruble is strong" 🤡 🤡 🤡
"China opening back up"
"AI"
"GameStop" 🤡 🤡 🤡
"A little macro / a little micro"
"Smart money buys bonds"
"Tom Brady"
"Matt Damon"
"A little earnings play"
"This is why it’s important to watch earnings" - TV verbatim.

are we in a retracement rally?my current thesis is that its a retracement rally... once we hit my target ill be a bear... if it smashes through to the upside all my thoughts are invalid and back to the drawing board...

Crypto Marketcap Ascending Triangle -MicroStrategy huge purchaseFacts:
In last 30 mays, 26 875 BTC was mined.
In same period, MicroStrategy has purchased 16 130 BTC.
Purchased amount equates to 60.0% of total Bitcoins mined in given time period.
Price action:
On above chart we can see that supply is drying up, hence higher lows.
Also, while expecting higher prices, nobody is willing to buy higher, resulting in same highs.
This combinations forms an ascending triangle, which is usually a bullish pattern.
Conclusion:
While smart money is buying big, dumb money is waiting for the dip to outsmart the smart money. Everyone wants the price to go higher without buying higher.
Eventually, when supply is exhausted, shorts will be liquidated, and dumb money will end up buying higher.
Trend is your friend, until the end. Only then he is your enemy.

Market volume analysis
The market volume is also in the Ardar Block area
If it can reject the resistance I have already drawn and there are ahead of the analysis
Can act exactly like 2019 and 2020
Note that the market has increased by 718 percent over the years and has reached $ 3 trillion.
If you say it can also be a volume this time, I can estimate the market volume in 2024 - 2025 - 2026 years between $ 8 and $ 10 trillion.
You may be surprised now, but those who are more than 5 years old in the market are not surprised and can also get a volume

Crypto Total Marketcap, where is the local top?Crypto Total Marketcap pumped up to 1.55 Trillion, up about 50% since October.
Mentioned 1.6 trillion as first major resistance where i think CRYPTOCAP:BTC could stall and give some room for alts or just plunge down and drag them along.


Crypto TOTAL Market Cap is about to DUMPThis chart represents the total market cap of Cryptocurrencies. Bullish momentum in this chart means money is coming in cryptocurrencies and vice versa.
Currently, TOTAL is at Weekly Supply Zone and Forming Rising Wedge which is a Bearish Traditional Chart Pattern.
RSI is showing Bearish Divergence on H4 and Daily.
If it breaks the trendline support of Rising Wedge, I will be looking to Short on BTC and other alts with the mentioned targets.
Hit the boost button if you like my idea.

Crypto Total CapI think we're at the end of the road for a little while. We could see a swing from here to around 0.283. I will not look for Short, but I will keep my risk low when taking Long trades.