$TOTAL UPDATECRYPTOCAP:TOTAL is currently at support. I think the recent pullback we have received was a leverage liquidation event.
I am currently going to be looking for longs in todays market. We could still expect a deeper dip to around 108k BTC.
To protect capital I am adding to my spot portfolio.
Trade ideas

Some clear targets for what I'm looking at in the bull marketI've put together the levels that I'm keen on, along with the btc halving dates as a way for people to measure and come to their own conclusions on a time analysis

MARKETS week ahead: August 18 – 24Last week in the news
The U.S. July inflation showed that the U.S. economy is for the moment ready to absorb implemented trade tariffs without their significant impact on inflation. The relieving conclusion pushed the market sentiment to higher grounds, where the S&P 500 managed to reach a new all time highest level, still, ending the week at 6.449. Based on the same grounds, but also on easing geopolitical tension, the price of gold passed through a price correction, closing the week at $3.335. On the other hand, a mixed data related to increased US retail sales in combination with Michigan consumer sentiment, pushed the 10Y US benchmark yields back to 4,3% level. BTC had its new, shiny moment at $123,5K, but without buying of the US government for its strategic reserves, the price retraced back to $117K.
Posted US macro data showed some results which might be treated as a bit contradictory, as per analysts. The July inflation was holding at 0,2% m/m, and was in line with market expectations. It also showed that the US economy at this moment is ready to absorb the effects of implemented tariffs. However, on the other hand, retail sales in July increased by 0,5% m/m, implying a possibility of future increased inflation level coming from domestic demand. This sentiment was reflected in University of Michigan inflation expectations which were increased to 4,9% from previous 4,5% for a year and to 3,9% from previous 3,4% for the five year period.
US Treasury Secretary Scott Bessent said in an interview for Fox Business that the U.S. government will not purchase new BTCs for its Strategic Bitcoin Reserve. Instead, the plan is to keep existing Bitcoin holdings and to build the reserve only through seized assets and cease selling any of the Bitcoin currently held. It is estimated that existing BTC holdings are currently valued between $15 and $20 billion, and were acquired through criminal forfeitures. This stance marks a shift from earlier speculation that the government might expand its crypto holdings via market purchases, suggesting instead a more passive, forfeiture-driven reserve strategy.
News reported that Warren Buffett's Berkshire Hathaway has sold another portion of Bank of America shares of 26,3 million, decreasing its stake in shareholding structure to 8,1%. Analysts commented that this move will not have any significant impact on the value of BoA shares. The fund also sold 20 million shares of Apple in the Q2, continuing a multi-quarter trend of trimming its Apple position, though Apple remains its biggest equity holding. On the other hand, news reported that these sales followed broader strategic rebalancing, considering that the fund initiated or increased its stakes in companies like UnitedHealth, Chevron, Dominos Pizza and others.
China’s industrial production and retail sales growth both slowed significantly in July, with factory output rising only 5.7%—its weakest pace since November 2024—and retail sales climbing just 3.7%, the slowest gain since December 2024. Weakness also extended to fixed-asset and property investment, which lagged expectations, alongside a rise in unemployment—painting a subdued picture of domestic demand despite some policy support. Analysts warn this slowdown could drag GDP growth below the official 5% target in the coming quarters, likely prompting Beijing to consider further stimulus measures.
CRYPTO MARKET
Quite a mixed trading week on the crypto market. The minute BTC managed to reach a fresh, new all time highest level, the comment from the US Treasury Secretary Scott Bessent spoiled another BTC victory. In his interview, Bessent noted that the US government will not buy new Bitcoin for its Strategic Bitcoin Reserve but will rely solely on seized assets to grow it. Existing holdings, valued at $15–$20 billion, will be retained, signaling a shift to a passive, forfeiture-based strategy. The crypto market corrected its valuation, however, managed to end the week with a small gain of 1%, adding modest $35B to its cap. Daily trading volumes remained elevated, trading around $321B on a daily basis. Total crypto market capitalization increase from the beginning of this year currently stands at +21%, with a total funds inflow of $693B.
Although BTC managed to achieve a new ATH, still, the coin is ending the week with an weekly increase of 0,6% and inflow of $13B to its market cap. For the second week in a row ETH managed to outperform BTC, as the coin closed the week with a gain of 3,5% and inflow of almost $19B to its market cap. This week ADA should be specially mentioned, as this coin gained a significant 13,5% w/w. Positive weekly closing also had LINK, with an increase in value of 6,2%, BNB was traded higher by 3,8%, while Tron surged by 3,8%. Solana also had a relatively solid trading week, with a positive close of 3,6%, increasing its market cap by $3,5B. Other major coins closed the week in negative territory, like XRP, with a drop in value of 4,7% and outflow of $9B. It should be noted that a vast number of altcoins finished the week in negative territory.
Increased activity was also reflected in circulating coins. XRP managed to add 0,2% of new coins to the market. ADA had one of rare moments, where its number of circulating coins surged by even 0,5% w/w. This week Filecoin was also the one with a significant increase in coins in circulation by 0,8%.
Crypto futures market
Mixed trading from the spot market was also reflected in the value of crypto futures contracts. BTC short term futures were last traded with a small weekly change of around 0,9%, while longer term futures managed to gain between 1,7% and 2,18% on a weekly basis. Futures maturing in December this year were last traded at $120.905, and those maturing a year later closed the week at $127.330.
ETH futures closed the week by around 7,9% higher from the previous week's closing prices. This increase refers to all maturities. Futures maturing in December 2025 were last traded at $4.533 and those maturing in December 2026 closed the week at $4.863.

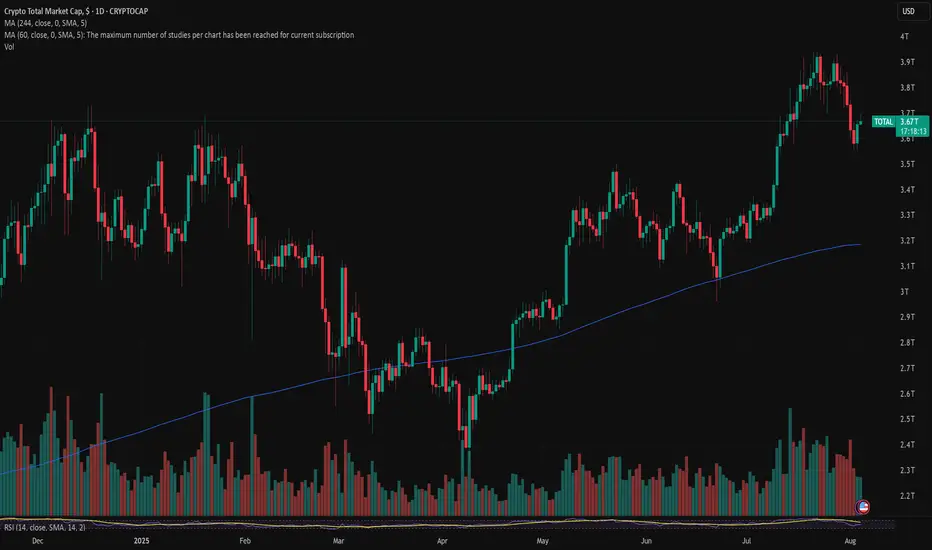
Total Crypto Market Cap**** Yousef Sharafi ****
In the weekly time frame, an Cup and Handle pattern is visible on the chart.
Follow me here for more analysis

Crypto Market Slows Down For A Pullback Within A Bullish TrendGood morning Crypto traders! Cryptocurrencies are coming slightly lower on the intraday basis due to stock market decline yesterday, but we still see them approaching support, so still be aware of a bounce and recovery at the end of the week or maybe next week because of an upcoming weekend. Crypto TOTAL market cap chart can be trading in wave »y« of a complex w-x-y correction in wave 4, unless it's a flat correction, but support is the same at 3.6T – 3.5T area, from where we may see a bullish continuation within wave 5.

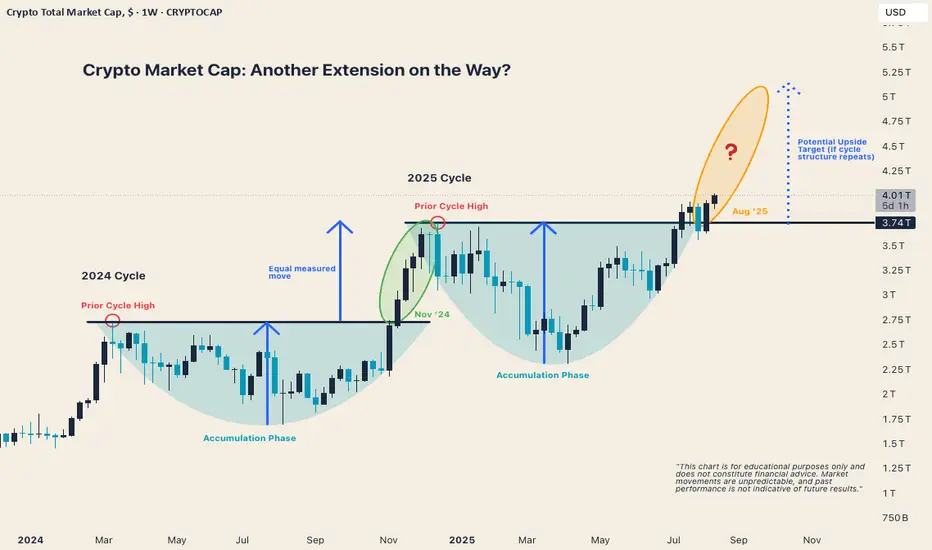
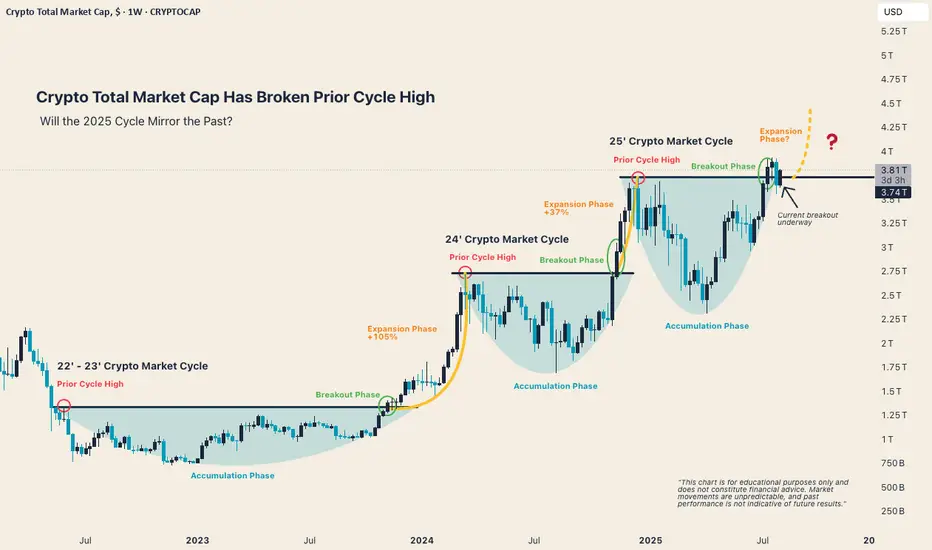
Crypto Market Cap: Another Equal Measured Move in Play?In 2024, the market delivered a textbook equal measured move after breaking out above the prior cycle highs.
Now, in August 2025, we’re breaking out again above the 2025 prior cycle highs. If this structure repeats, the potential upside could target around $5 trillion in total crypto market cap.
This setup doesn’t guarantee the same result, but it’s a compelling pattern to watch closely.
This chart is for educational purposes only and does not constitute financial advice.
Total crypto market camp is about to double This chart goes back years, do your own research but charts don’t lie.

MARKETS week ahead: August 11 – 17Last week in the news
Although there is a positive sentiment on financial markets, still, a level of precaution among investors could be also observed. Markets used the previous week to both digest the latest US macro data and to prepare for the July inflation report coming in the week ahead. The US equity markets finished the week in a positive territory, with S&P 500 reaching the level of 6.389. On the same ground, the 10Y US benchmark yields corrected a bit last week's push toward the 4,20%, by ending this week at 4,28%. The price of gold was under the impact of “misinformation” of Swiss officials that the 39% imposed tariffs on Swiss goods also refer to gold imported from this country. Gold reached the level of $3.398. The US Presidential order that 401 (k) pension plans could include cryptocurrencies, pushed the BTC to higher grounds, ending the week above the $116K.
During the previous week there has not been much of currently significant US macro data scheduled for a release, in which sense, investors have used it to set the trading for the week ahead, when US July inflation data are set to be released. At the same time, news that occupied US equity markets came from Apple, whose shares rose by 13% within a week. Namely, its CEO, Tim Cook, met last week with the U.S. President in the Oval Office, to discuss the plans of Apple to invest $600B over the next four years in the U.S. Analysts have interpreted the move as an effort to appease the U.S. President, who has repeatedly called for IPhones to be manufactured domestically. Tim Cook commented that IPhone will not be assembled in the US for a while.
Another news that attracted market attention was that the U.S. President Donald Trump has signed an executive order permitting cryptocurrency investments in 401(k) retirement plans, potentially unlocking billions of dollars for the asset class. The order also extends to private equity investments, significantly expanding the range of assets retirement plan providers can allocate funds to. Analysts are noting that this move could not only boost crypto prices but also deepen the integration of digital assets into the mainstream financial system.
The US Federal Appeals Court currently reviews challenges to implemented tariff policy, by the U.S. Administration. As per former House Speaker Paul Ryan, the Supreme Court might invalidate duties imposed under the International Emergency Economic Powers Act of 1977. Commenting on this news, the US President warned U.S. courts against blocking his tariff policy, highlighting its “positive impact” on the stock market and cautioning that such interference could trigger a severe economic downturn, comparing it with the one that occurred in 1929. In the U.S.
As Reuters is reporting, global equity funds faced significant selling pressure last week, with investors pulling out a net $7.82 billion amid U.S. tariff announcements and signs of economic weakness fuelling risk aversion. Meanwhile, money market funds saw their largest weekly inflows since January, attracting $135.37 billion as investors sought safer assets. Despite heavy outflows from U.S. equity funds, European and Asian equities, along with sector funds in communication services, industrials, and tech, saw notable inflows. Additionally, global bond funds attracted nearly $21 billion, led by strong demand for short-term, euro-denominated, and high-yield bonds.
CRYPTO MARKET
Another positive news hit the crypto market, when the U.S. President signed an executive order, which permits crypto investments for the U.S. pension 401(k) plan. Analysts are noting its significance, considering the high amount of funds which are held in these funds, part of which could be distributed also in the crypto currencies. Such a move would certainly increase the prices of BTC and some altcoins, through increased demand for these coins. This news mostly pushed altcoins to higher grounds during the previous week. Total market capitalization was increased by 8% on a weekly basis, adding total $274B to its market cap. Daily trading volumes were modestly increased to the level of $314B on a daily basis. Total crypto market capitalization increase from the beginning of this year currently stands at +20%, with a total funds inflow of $658B.
Although BTC gained during the previous week, still the coin was left in the shadow of altcoins. The star of the week certainly was ETH, with an increase in value of 23%, certainly not recently seen for this coin. ETH attracted $97B of new funds, surpassing BTC, which attracted $73B and an increase in value of 3,2% w/w. XRP is also a coin with a significant weekly gain of 14,2% and a cap increase of $24B. Market favorite Solana had a surge in value of 13% or $11,5B. DOGE also had a strong shift in value of 24%, while Stellar, Uniswap, Theta also had a surge of more than 20%. ADA, Monero, Filecoin surged by around 15% each, while the majority of other altcoins gained around 10% on a weekly basis. Overall, an extremely good week for altcoins.
As for coins in circulation, there has not been much change compared to the previous week. Stellar had a surge in value, but it also increased the number of coins on the market by 0,2%. This week was another week with IOTAs coin surge by 0,8%. Solana increased its number of coins by 0,2%.
Crypto futures market
Following spot market developments, crypto futures significantly gained in value during the previous week. As ETH managed to pass the $4K mark, so the crypto futures followed, surging by almost 16% on a weekly basis. ETH futures maturing in December this year closed the week at $4.197, and those maturing in December 2026 were last traded at $4.509.
BTC futures gained almost 3% for all maturities. Futures with maturity in December this year closed the week at $119.875, and those maturing in December next year reached the last price at $126.940. Just as a reminder, the historically highest price reached for this maturity was $129.355.

From ETH Season to ALTS Season – The Key Interception is now🚀🔄 Transitioning from Ethereum Season to ALTS Season – The Key Intersection 💡📈
BTC ➡️ ETH ➡️ ALTS
Hey traders, this weekend feels like the first true retail weekend in a long time — and the charts are telling an interesting story.
We’ve seen Bitcoin lead the charge, followed by Ethereum’s dominance, and now we may be entering the next phase: ALT season.
Here’s the sequence:
1️⃣ Bitcoin dominance was in an ascending channel. The moment it re-entered the channel, Ethereum season began.
2️⃣ Now, Bitcoin dominance has lost that crucial lower support. That break signals the likely start of ALT season.
3️⃣ Ethereum is still strong, but Cardano (ADA) and Arbitrum (ARB) are looking like prime candidates to wake up next.
📊 Macro notes:
Bitcoin is breaking out on the 15-min chart, while ARB has broken key resistances.
ADA remains a late mover, but its fundamentals and ecosystem position it well for potential upside.
The BTC/S&P 500 ratio is also pointing upward, making crypto more appealing than equities in this moment.
💡 Risk Management Reminder:
As I often say, Κινδύνευε φρονίμως– risk wisely. Even in bullish conditions, I keep hedged positions. Just like mixing hot and cold water in a bath, combining longs with protective shorts keeps you from getting burned if the market turns.
This is likely the intersection point where Ethereum’s run transitions into an altcoin wave — but as always, nothing is guaranteed. Keep an eye on BTC dominance and sector rotation for confirmation.
BTC ➡️ ETH ➡️ ALTS
One Love,
The FXPROFESSOR 💙

$totalprobably something like that. Even if total rips more towards 5T I believe the meat of the move is already done. most likely never bear market again but corrections 30-40% can be happen. BTC to 85-75K then ALT season?
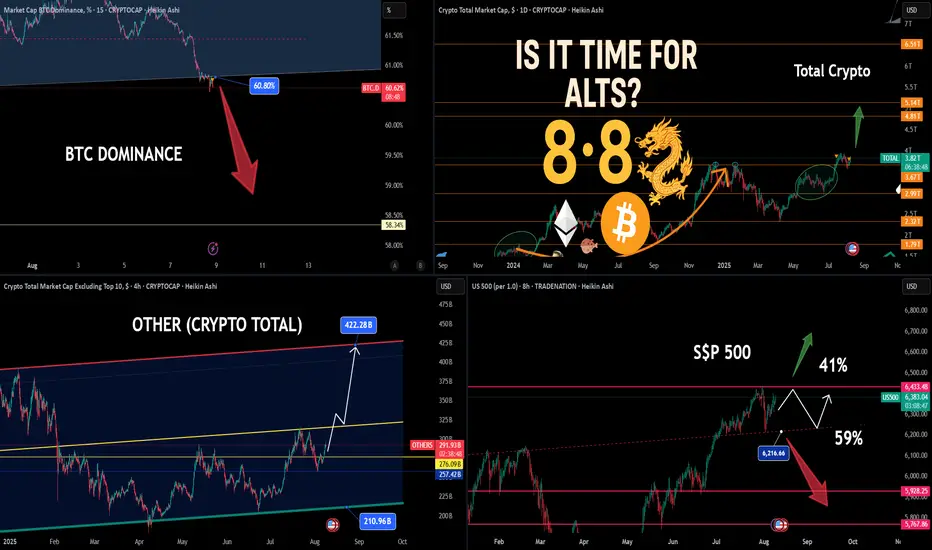
8-8 Double Luck — Time for Alts!🐉🍀 8-8 Double Luck — Time for Alts! 🚀📊
8-8-2025 — Double fortune in Chinese culture, and an angel’s number for alignment and abundance. The market setup is lining up for something interesting.
BTC Dominance (BTC.D)
📉 Slipped under 60.80% — now major resistance.
As long as it stays here, the odds tilt toward altcoin outperformance (if BTC holds or rises).
BTC Above Key Level
🔑 BTC remains above 115,800 support — bullish structure intact.
Total Crypto Market
📈 Watching for follow-through toward higher targets if BTC.D weakness persists.
“Other” Crypto Market (Excluding Top 10)
📊 Breakout path toward $422B possible if momentum continues.
S&P 500 (SPX)
📉 Still in range after rejection at resistance.
Two possible paths:
✅ Break higher (41% probability)
❌ Pullback toward lower support (59% probability)
Summary:
BTC > 115,800 ✅
BTC.D < 60.80% ✅
ETH already tagged $4K.
Alt window is open — for now.
One Love,
The FXPROFESSOR 💙
Disclosure: I am happy to be part of the Trade Nation's Influencer program and receive a monthly fee for using their TradingView charts in my analysis. Awesome broker, where the trader really comes first! 🌟🤝📈
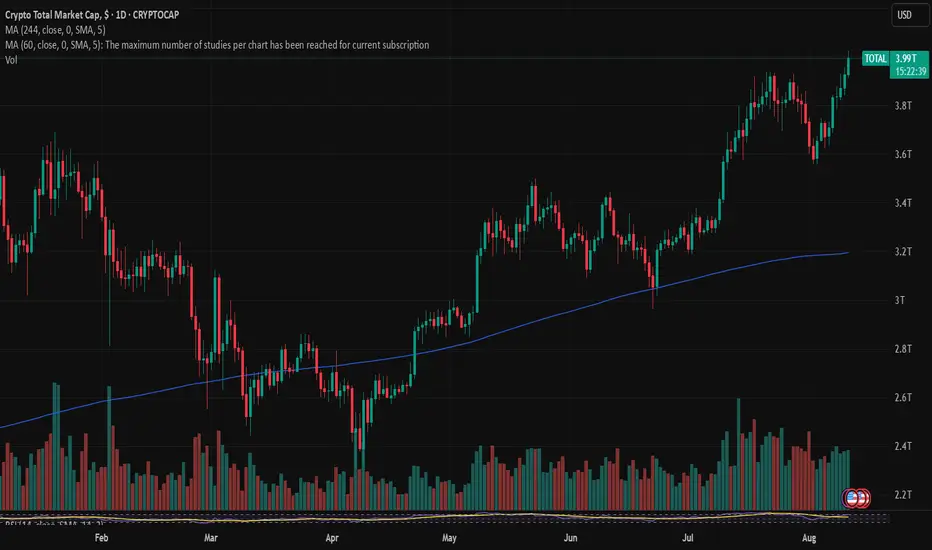
Crypto Total Market Cap Has Broken Its Prior Cycle HighEach of the past two crypto market cycles saw a clean breakout above prior highs, followed by significant expansion phases:
2023: ~105% rally post-breakout
2024: ~37% rally post-breakout
2025: Now underway?
We’ve entered the breakout phase again. If history is any indicator, this is the moment where things often accelerate.
While we don’t trade based on hope or symmetry, understanding how markets have behaved around these moments can provide valuable context for positioning, risk, and timing.
📊 Educational chart below
💬 Curious to hear your thoughts
MARKETS week ahead: August 4 – 10Last week in the news
US macroeconomic data took center stage during the previous week, with major correction occurring on Friday, after the NFP July data were released. Investors fear of economic consequences of implementing trade tariffs pushed US equity markets to downside. The S&P 500 lost 1,5% on Friday, closing the week at the level of 6.238. On the same grounds the price of gold strongly gained 2,2% on Friday, reaching the last price at $3.362. Strong reaction also came from US Treasury yields, where the 10Y US benchmark dropped to the level of 4,22%. This time the crypto market was also affected, where BTCs price dropped sharply, closing the week around the $113K level.
The FOMC meeting was held during the previous week, without changes in the level of interest rates. As per Fed's view, the economy is growing at a solid pace, while they acknowledged increasing risks originating from implemented trade tariffs on inflation and potential slowdown in the future economic growth. There were no comments regarding potential rate cuts in September, except that the Fed will continue further to balance interest rates based on “the incoming data, the evolving outlook and the balance of risks”, as noted by Fed Chair Powell.
A macro data heavy week in the US included data on JOLTs in June of 7,437M, modestly below market forecast of 7,55M. The PCE Price Index in June was relatively steady with 0,3% for the month and 2,6% for the year, which was in line with market expectation. However, what shocked the market on Friday were posted non-farm payrolls data for July of only 73K, although the market estimate was standing at 110K. During Saturday, news was published that the US president Trump requested immediate release of a duty of a Commissioner of labor statistics, due to posts of inaccurate labor data and its frequent revisions. The US President also questioned the accuracy of the July NFP figure of 73K.
During the previous weekend the U.S. finalized the trade-tariffs deal with the European Union. Details of the deal are officially published at the website of the European Commission, and include, among other, tariffs of 15% on imports from the EU, establishment of tariff-rate quotas for imports of steel, aluminium and copper from the EU, cutting the current 50% current tariffs. EU companies will also invest at least $600B in different sectors in the US by 2029.
Interesting news for crypto enthusiasts was posted by Cointelegraph, noting that on July 4, 2025, eight dormant Bitcoin wallets from the Satoshi era collectively moved 80.000 BTC, with each wallet transferring 10.000 BTC. The Satoshi era, generally defined as the period from 2009 to 2011, was when Bitcoin could still be mined or transacted using standard computer processors. The sudden activation of these long-inactive wallets has sparked intense speculation, with some suggesting that emerging quantum computing threats may have prompted the transfers. Still, analysts with a knowledge of blockchain technology commented that coins were not transferred directly to cryptocurrency exchanges but instead moved to newly created SegWit addresses — a move that likely indicates a security upgrade.
CRYPTO MARKET
As the crypto market became part of mainstream markets, it needed to manage both ups and downs of the investors' sentiment, which was usually related to traditional markets. This occurred during the Friday trading session, when investors' fear of future consequences of implemented trade tariffs turned to the negative side. Total crypto market capitalization decreased by 6% on a weekly basis, losing a total $216B. Daily trading volumes were relatively flat on a weekly basis, moving around $304B on a daily basis. Total crypto market capitalization increase from the beginning of this year currently stands at +12%, with a total funds inflow of $384B.
This week BTC was leading the market cap drop, with an decrease in value of 4% w/w and outflow of almost $96B in funds. ETH also had a drop in value of 7,2%, with total funds outflow of $32B. The third coin by total market cap, XRP, was traded around 10% lower, closing the week with total fund outflow of $18,6B. Another coin with a significant drop in the market cap was Solana, of almost 13% w/w, and funds outflow of $13B. Both DOGE and ADA were on a losing side, where DOGE was traded 17,1% lower, losing $6,13B in the market cap, while ADA dropped by 14,6% with an outflow of $4,3B. The majority of other altcoins finished the week with a loss in value between 14% and 18%.
This week there has not been too much activity when circulating coins are in question. Algorand had an increase of coins on the market by 0,2% w/w, while Stellar's number of coins surged by 0,3%. This week Filecoin had a modest increase of 0,1% on a weekly basis, same as ZCash and DOGE.
Crypto futures market
The general drop in the value of crypto coins on the spot market was also reflected to some extent also in the futures market. BTC futures were traded lower by more than 3% for all maturities, while ETH futures had a weekly drop in value of more than 4%. However, it is important that the general levels of the value of futures remain at higher grounds.
BTC futures maturing in December this year closed the week at $116.390, and those maturing in December next year were last traded at $123.490. A similar situation is with ETH futures, which managed to hold grounds above the $3K. Futures maturing in December 2025 closed the week at $3.631, and those maturing a year later were last traded at $3.894.
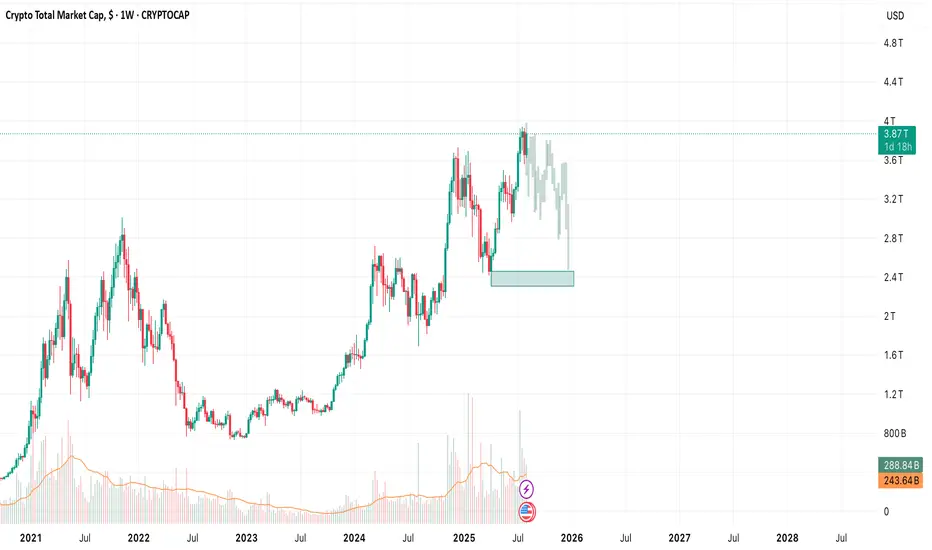
Crypto Total Market CapThe market is correcting at a very fast pace. The correction pattern could be 5-3-5. The following supports are important
TOTAL - Gonna Hold My Coins, Wait & See...This is my own experiment, gonna buy the most underrated top 30 coin, the most hated one. Put $5k on it right now and wait until this happens. Maybe this wont work but we will see!

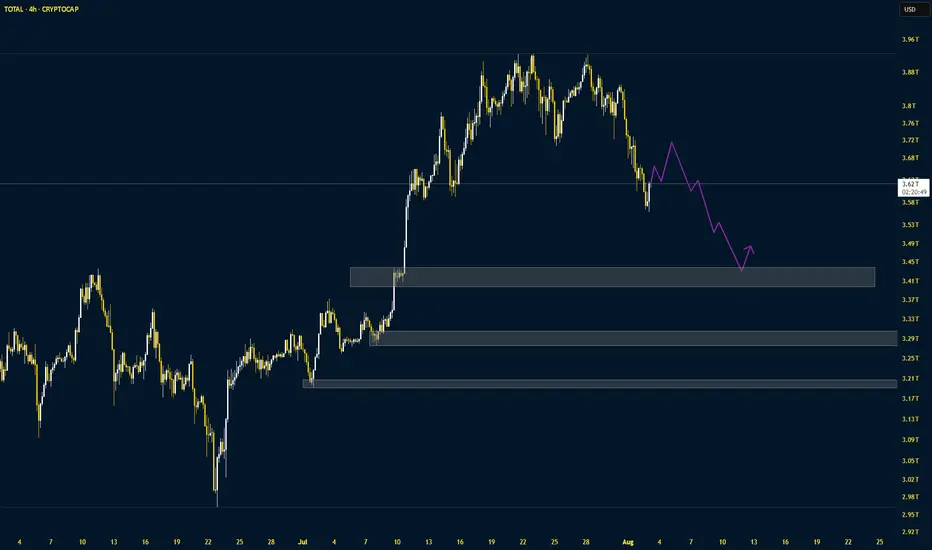
Short Term Crypto Total Market CapHere are the 2 scenarios which I can imagine for the short-term move of the crypto market with respective invalidation levels and trade ideas.

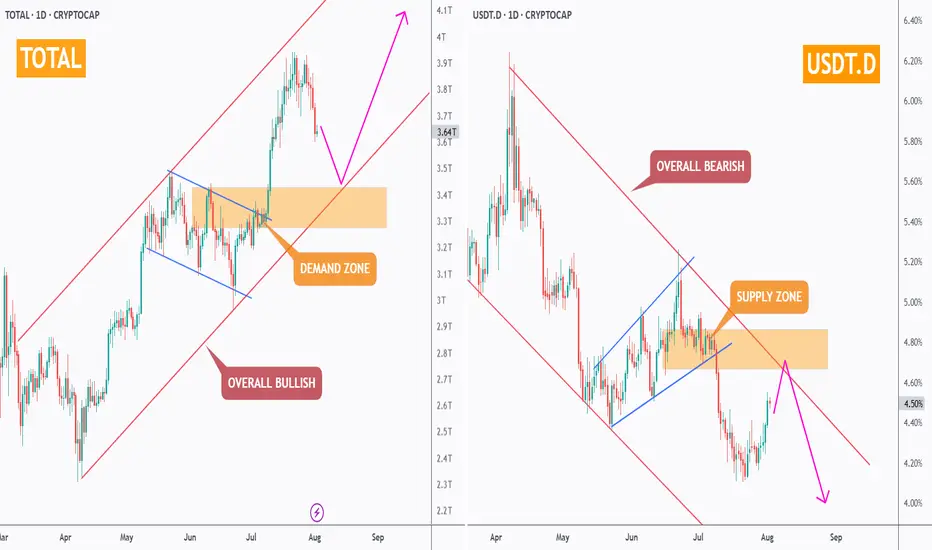
Don’t Panic — It’s Just a Healthy Crypto Correction!While the crypto market has seen some red this week, the bigger picture remains intact. Let’s zoom out and make sense of the current correction.
🔸 TOTAL Market Cap (left chart)
The structure remains overall bullish, trading inside the red rising channel.
After a solid rally, the market is currently pulling back toward a strong demand zone – perfectly aligned with the lower trendline. This area is likely to act as a major support, from which the next bullish impulse could kick off.
🔸 USDT Dominance (right chart)
USDT.D remains overall bearish, trading inside the red falling channel.
It’s currently pushing higher toward a well-defined supply zone, which also intersects with the upper red trendline. As long as this area holds, we expect sellers to take over again — giving altcoins the space they need to bounce back.
📌 In simple terms:
The market is in a healthy correction. Don’t let short-term dips shake your long-term view. The trend is still your friend.
➡️ As always, speak with your financial advisor and do your own research before making any investment decisions.
📚 Always follow your trading plan => including entry, risk management, and trade execution.
Good luck!
All strategies are good, if managed properly.
~ Richard Nasr
Looks like $ investors switch possible - Crypto rules??Hello fellow traders,
Just looking at the chart of total market cap and based on trend line weekly focus- this is it- a point at which crypto market might start to recover and go for 2 x what it has in total, heading for 5t?? Let me know in your comments what do you think? Also, many investors might start diversifying their portfolio since Fridays 'crash' hence I wouldn't be really surprised if next week brings some $ into crypto !
It's just my idea don't copy think and do your own stuff

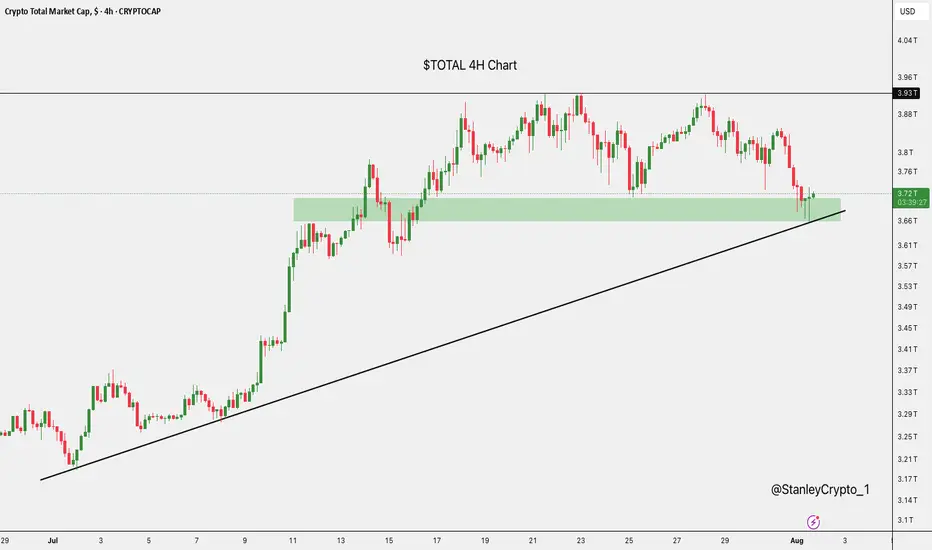
$TOTAL at Key SupportThe crypto market cap has just bounced off a strong support zone around $3.67T, right where it aligns with the rising trendline.
This area has held firm before, and it's doing the same now.
If it continues to hold, we could see a nice recovery.
But if it breaks down, there’s a risk of more downside ahead.
Money Flow - 2### Money Flow Spread from DJI to Cryptocurrency: A Fibonacci Perspective
The financial markets operate in an interconnected ecosystem where capital flows between asset classes based on macroeconomic trends, investor sentiment, and risk appetite. One such dynamic involves the movement of funds from traditional markets like the **Dow Jones Industrial Average (DJI)**—a barometer of blue-chip stocks—to emerging asset classes such as **cryptocurrencies**. This phenomenon can often be analyzed using **Fibonacci retracements and extensions**, which serve as powerful tools for identifying key support, resistance, and potential price targets during shifts in market momentum.
#### 1. **Market Sentiment and Capital Rotation**
- The DJI represents large-cap equities that are heavily influenced by institutional investors, central bank policies, and global economic conditions. When these factors trigger volatility or uncertainty in traditional markets, investors may seek alternative investments with higher growth potential or hedging properties.
- Cryptocurrencies, known for their decentralized nature and high volatility, attract speculative capital during periods when confidence in traditional assets wanes. For instance:
- During bearish trends in the DJI, characterized by falling prices and increased selling pressure, some investors might reallocate portions of their portfolios into cryptocurrencies like Bitcoin (BTC) or Ethereum (ETH).
- Conversely, bullish trends in the DJI could signal improved risk appetite, prompting a portion of crypto gains to rotate back into equities.
#### 2. **Fibonacci Retracements: Identifying Key Levels**
- Fibonacci retracement levels are derived from the Fibonacci sequence and are widely used in technical analysis to predict areas of support and resistance. These levels (e.g., 23.6%, 38.2%, 50%, 61.8%) help identify potential turning points in price action.
- In the context of money flow from the DJI to cryptocurrencies:
- A significant decline in the DJI could lead to a pullback to Fibonacci retracement levels (e.g., 38.2% or 61.8%). At these junctures, traders may reassess their positions and consider diversifying into cryptocurrencies.
- Similarly, after a sharp rally in cryptocurrencies, prices might retrace to Fibonacci levels before continuing upward. Investors exiting equities due to underperformance might view these retracements as entry points for digital assets.
#### 3. **Fibonacci Extensions: Projecting Price Targets**
- While retracements focus on corrective moves within a trend, Fibonacci extensions project potential price targets beyond the initial move. Common extension levels include 127.2%, 161.8%, and 261.8%.
- In scenarios where money flows out of the DJI and into cryptocurrencies:
- If the DJI experiences a prolonged downtrend, its losses could coincide with outsized gains in cryptocurrencies. Fibonacci extensions can help forecast how far crypto prices might rise amid this influx of capital.
- For example, if Bitcoin breaks above a key resistance level following a surge in inflows from equities, traders might use Fibonacci extensions to estimate future price milestones (e.g., $100,000 or $200,000).
#### 4. **Psychological Drivers Behind the Transition**
- Fibonacci levels resonate with traders because they align with natural human tendencies toward symmetry and proportion. This psychological aspect amplifies their relevance when analyzing cross-market dynamics.
- As money exits the DJI and enters cryptocurrencies, Fibonacci-based trading strategies provide a framework for understanding how participants perceive value across different asset classes. For instance:
- Institutional investors exiting equities might anchor their decisions around Fibonacci-derived thresholds, ensuring disciplined entry and exit points in volatile crypto markets.
- Retail traders, who dominate much of the cryptocurrency space, also rely on Fibonacci tools to time their trades, creating self-reinforcing patterns that influence overall market behavior.
#### 5. **Case Study Example**
- Imagine a scenario where the DJI drops sharply due to rising interest rates or geopolitical tensions. The index falls from 35,000 to 30,000—a decline of approximately 14%. Traders observe Fibonacci retracement levels at 38.2% ($31,900) and 61.8% ($33,100), expecting temporary bounces at these levels.
- Simultaneously, Bitcoin rallies from $20,000 to $30,000 as investors seek refuge in digital gold. Using Fibonacci extensions, analysts project further upside to $38,200 (127.2%) or even $48,500 (161.8%), attracting additional capital from equity markets.
#### 6. **Conclusion**
- The interplay between the DJI and cryptocurrencies highlights the fluidity of modern financial markets. By leveraging Fibonacci retracements and extensions, traders can better anticipate shifts in money flow and position themselves strategically.
- Whether driven by macroeconomic headwinds, technological innovation, or evolving investor preferences, the migration of capital from traditional indices like the DJI to digital assets underscores the growing convergence of old and new finance. Fibonacci analysis serves as a bridge, offering insights into both the timing and magnitude of these transitions.

Roadmap for $TOTAL aligned with the $444K $BTC price forecastThis idea outlines a projected roadmap for CRYPTOCAP:TOTAL (Total Crypto Market Cap) based on my $444,000 Bitcoin price forecast. As BTC climbs toward this long-term target, CRYPTOCAP:TOTAL is expected to follow a corresponding macro growth trajectory. This roadmap explores potential milestones, correction zones, and acceleration phases within the crypto market as capital flows increase.
🔍 This analysis is a continuation of my $444K BTC thesis, which you can find on my profile for context.
📈 Key highlights:
• Correlation between BTC and CRYPTOCAP:TOTAL historical growth patterns
• Projected market cap targets in alignment with BTC reaching $444K
• Technical and macroeconomic confluence zones
• Strategic outlook for altcoins as CRYPTOCAP:TOTAL expands
🧠👇💬 Any thoughts?

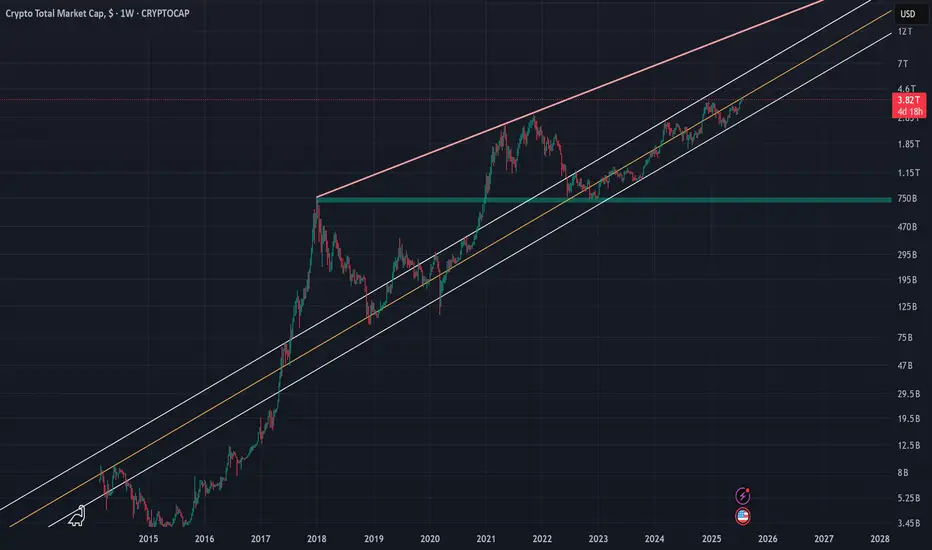
Crypto Total Market Cap (TOTAL) | 1WThe crypto market cap represented by the symbol TOTAL can be considered the most important index for analyzing the cryptocurrency market, although I believe that analyzing Bitcoin itself, given its strong positive correlation with the TOTAL index, would yield similar results. In the attached image, the red line actually indicates the overall resistance level of the symbol, and the drawn parallel channel illustrates the current upward trend of the TOTAL symbol, which is now on the verge of encountering its round resistance at 4 trillion dollars. While we should expect a correction around this level, breaking through the 4 trillion dollar resistance could likely lead to a market cap of 6 to 7 trillion dollars in the next phase. On the other hand, with support at 2.4 trillion dollars based on the 100-week SMA on the weekly timeframe, the 750 billion dollar level—marked by a green zone in the image—can still be considered the most important long-term market support, even before the fifth halving.
I will try to continuously update this analysis of the TOTAL symbol according to market changes and developments. Also, I welcome reading your critiques and comments, so don’t forget to leave a comment!