Altcoin selling areaEach alt chart is different, so individual coins should be charted on their own merits. However. Given increased liklihood of BTC bear market, it makes sense to sell on the bounce here before the longer-term trend line breaks--increasingly likely.
Key data points
Previous close
—
Open
—
Day's range
—
About Crypto Total Market Cap Excluding BTC, $
Bitcoin is quite a heavy-weight fighter which makes it difficult at times to correctly define how the crypto market is doing — it just outshines other coins, and you can't see clearly. Since Bitcoin presents such a huge piece of the crypto pie, excluding it from counting sounds reasonable and lets you see a more clear picture of where the crypto market is moving at the moment. That is what you can see on the chart we've prepared — calculated by TradingView, it displays global crypto market cap without Bitcoin's share.

TOTAL2 ALTCOIN MARKET // BULLISHProfessional Macro Interpretation
TOTAL2 — Altcoin Market Cap (Excluding BTC)
This chart highlights the full macro structure of altcoins across the last two cycles, and the current trend is following a very clean, repeating pattern:
1️⃣ 2017 → 2021: Multi-cycle breakout structure
The 2017 ATH a

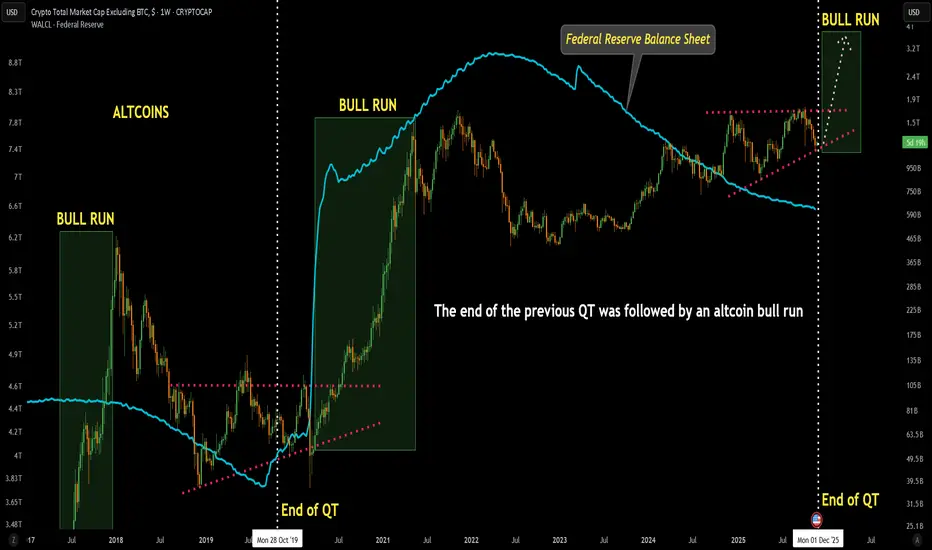
Altcoin Total Market Cap (excluding BTC) with Fed Res Balance Sh📈 BULLISH BIAS
My Strong Bias Based on This Chart:
Altcoins are setting up for a massive macro breakout sometime after QT ends, likely aligning with 2025/2026 liquidity expansion.
✔ Ascending triangle at macro scale
✔ Higher lows for 3+ years
✔ Liquidity cycle bottoming
✔ Historical repeatability
ALT SZN CHART Crypto cap without btc.
February will do what last years february failed to deliver.
I do believe an altseason will occur.

TOTAL2 - Testing Middle Band Using this Gaussian Channel indicator it can be seen on Weekly chart that price is testing this middle line
This line has been a point of strong support and many breakouts have been seen along it
Price will likely bounce off it allowing a rally for alts

Dreams and StructureIt seems that the ALT Coins could possibly be at a pull back. Look at the parallel structure and how price is resting on top of the Fibonacci 0.5 golden zone and in between the 10 EMA(purple) and on top of the 21 EMA in yellow. If price fails the parallel structure price can test the 50 EMA which ha

FireHoseReel | TOTAL2 Facing Major 4H Resistance🔥 Welcome to FireHoseReel !
Let's dive into total2 market structure.
👀 TOTAL2 4H Analysis
TOTAL2 has reached its four-hour resistance around the one point two four level and is currently showing a clear reaction and rejection from this zone. This resistance can act as a key barrier for Ethereum

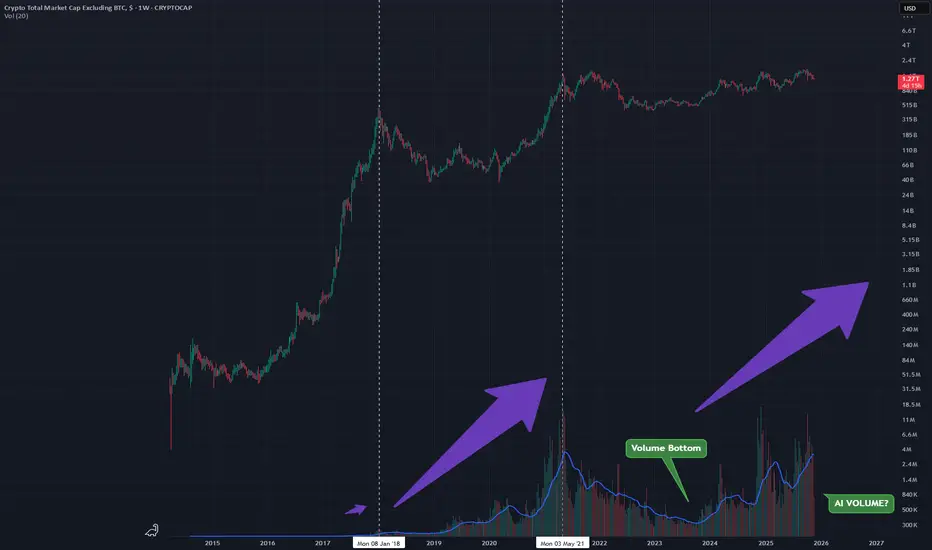
TOTAL2 - Looking at VolumeTrying to understand the patterns that volume shows on this Weekly chart
Peaks in volume correlate with peaks in price
as that volume is rising now we can expect price to rise to that peak
Honestly think all this is from AI hype and a long awaited alt rally.
Very bullish on alts!
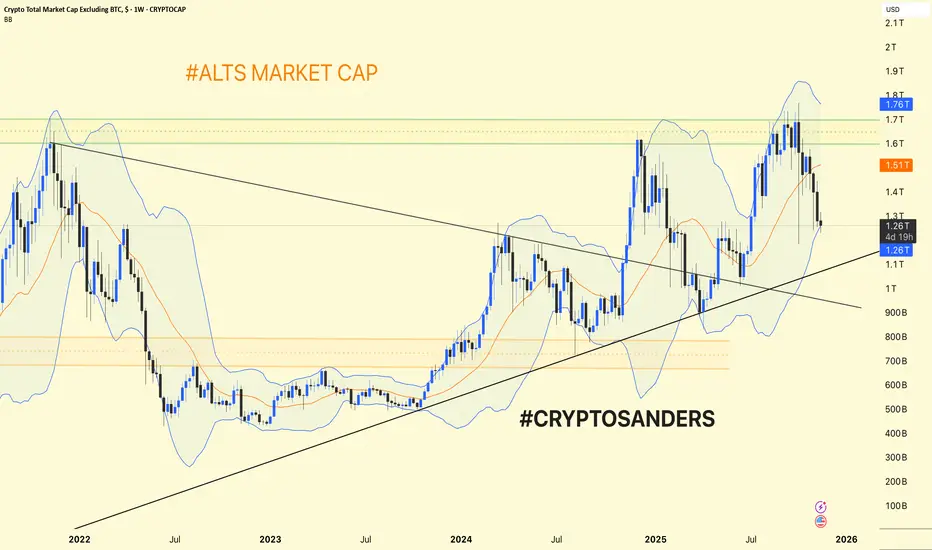
Alts Market Cap (#ALTS) Weekly Chart Update & Analysis. Alts Market Cap (#ALTS) Weekly Chart Update & Analysis
Trend Structure: The altcoin market cap (total crypto market cap excluding BTC) is trading within a broad uptrend channel after a major breakout in early 2024.
Support is currently found near $1.25T (recent swing low and channel support).
Res
TOTAL2 - Altcoin rally? A triangle that can be seen currently forming on this Daily chart of TOTAL2 on the logarithmic scale.
I hope for a strong breakout of this triangle, similar to one that i saw on gold before it broke out.
Potential

See all ideas
Summarizing what the indicators are suggesting.
Oscillators
Neutral
SellBuy
Strong sellStrong buy
Strong sellSellNeutralBuyStrong buy
Oscillators
Neutral
SellBuy
Strong sellStrong buy
Strong sellSellNeutralBuyStrong buy
Summary
Neutral
SellBuy
Strong sellStrong buy
Strong sellSellNeutralBuyStrong buy
Summary
Neutral
SellBuy
Strong sellStrong buy
Strong sellSellNeutralBuyStrong buy
Summary
Neutral
SellBuy
Strong sellStrong buy
Strong sellSellNeutralBuyStrong buy
Moving Averages
Neutral
SellBuy
Strong sellStrong buy
Strong sellSellNeutralBuyStrong buy
Moving Averages
Neutral
SellBuy
Strong sellStrong buy
Strong sellSellNeutralBuyStrong buy
Displays a symbol's price movements over previous years to identify recurring trends.