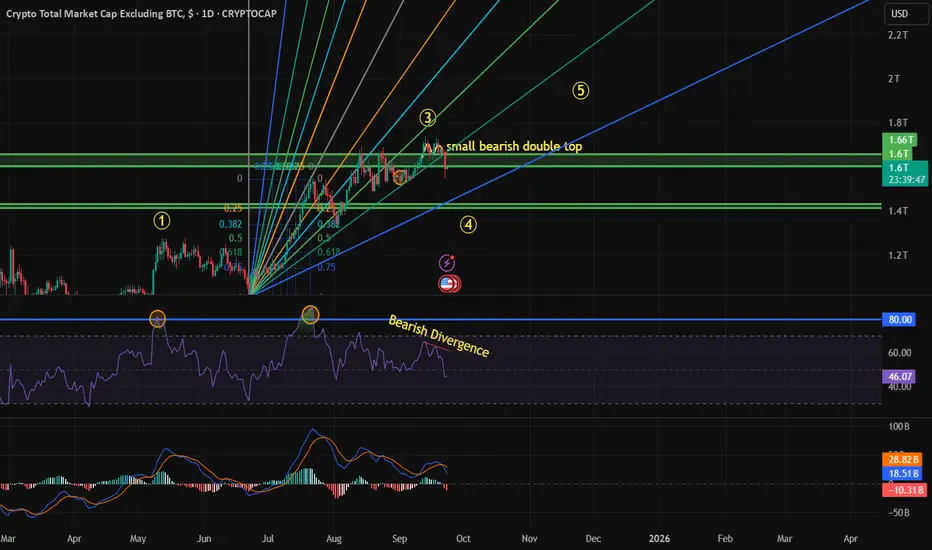
Altcoin Market Correction Underway – Final wave is coming!The total crypto market cap excluding BTC has likely completed Wave 3. At the end of Wave 3, a small bearish double top appeared, and the RSI confirmed weakness with a bearish divergence. During Wave 1, the RSI crossed 80. During Wave 3 going up, the RSI crossed 80 again and reached 86, which indica
Key data points
Previous close
—
Open
—
Day's range
—
About Crypto Total Market Cap Excluding BTC, $
Bitcoin is quite a heavy-weight fighter which makes it difficult at times to correctly define how the crypto market is doing — it just outshines other coins, and you can't see clearly. Since Bitcoin presents such a huge piece of the crypto pie, excluding it from counting sounds reasonable and lets you see a more clear picture of where the crypto market is moving at the moment. That is what you can see on the chart we've prepared — calculated by TradingView, it displays global crypto market cap without Bitcoin's share.
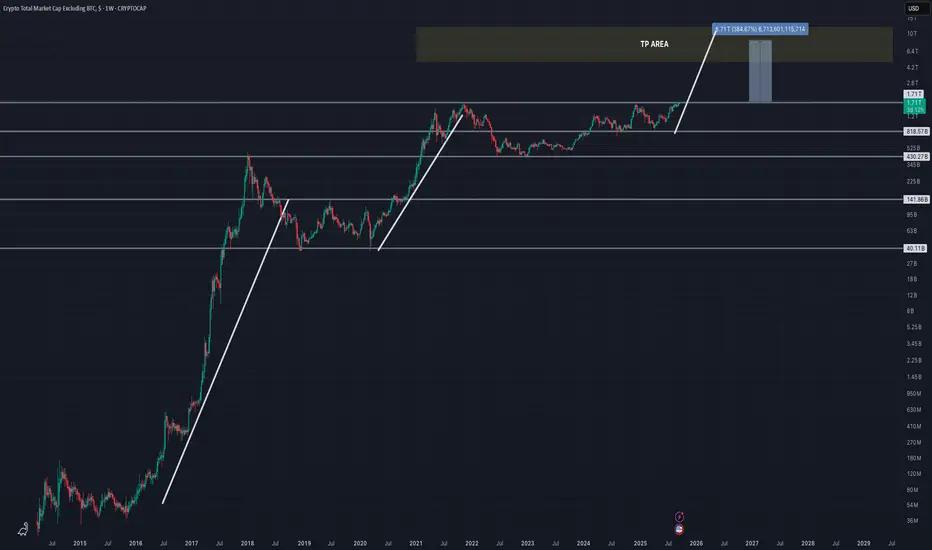
Altcoins Index TOTAL2 and TOTAL3 are on the verge of a major breThe major resistance level that has persisted for almost 4 years since the 2021 ATH in two pairs is also on the verge of breaking the supply zone.

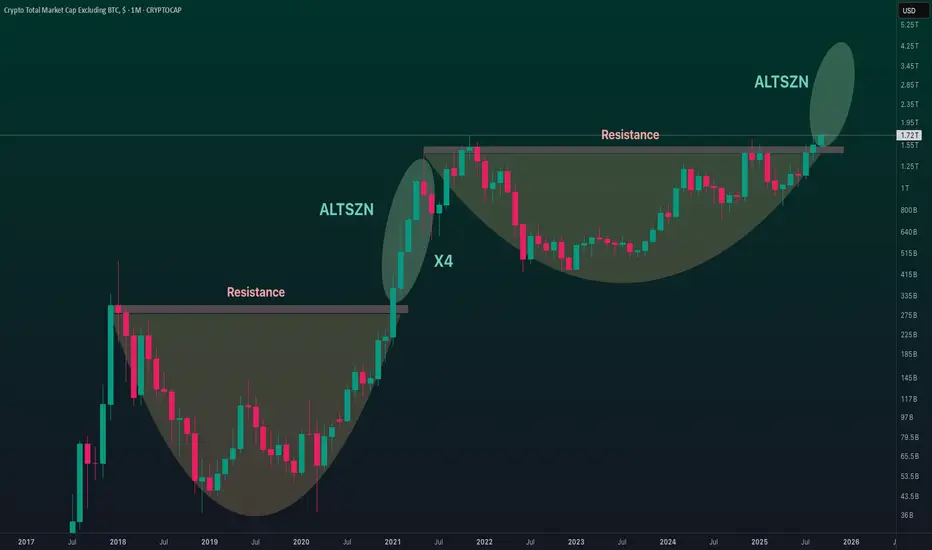
TOTAL2 at Crossroads: Alt Season or Triple Divergence CorrectionBy now, it’s no secret that everyone’s watching the cup and handle forming on the TOTAL2 chart (crypto market cap excluding Bitcoin).
A clean break above 1.71T (2021 high) would confirm the pattern and likely ignite an alt season — maybe even reminiscent of 2021, where altcoins more than quadrupled

Altcoins are breaking out !The Total Cryptocurrency Market Cap (excluding BTC) is breaking through its major resistance! 🚀
🤯 For 52! months, since the previous peak, Altcoins couldn’t break the $1.5T mark — and now we’re finally seeing a confident breakout above this level. 📈
🔙 Last time, after breaking $300B, the market ca
Altcoins season...Altcoins are loading up for a major upward wave.
The Altseason is approaching step by step.

MARKET READY TO RISE $TOTAL2After almost 4 years TOTAL2 now with the generational breakout and price discovery (!!)

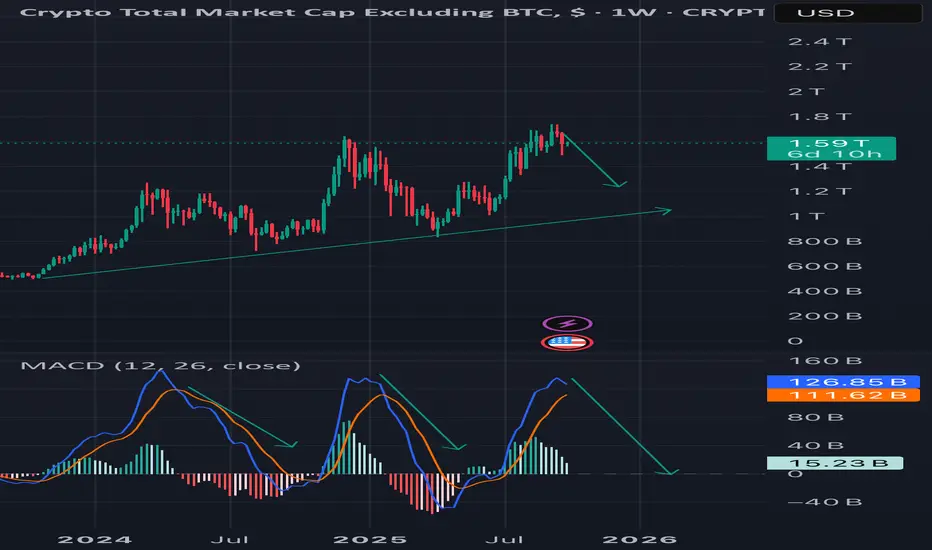
Total 2 alt coins marketcapSo this chart if it repeats the same pattern as the last two times it heading lower we can see Macd cross approaching I think the bear market has begun and we will go lower now . Positive news are exhausted I think we will hit a new low by January
TOTAL2 Elliot Wave BREAKOUT ALERT - Altseason Incoming ? TOTAL2 Elliott Wave BREAKOUT ALERT: Altseason Incoming? 🚀📈
Alright, folks—checking in on the TOTAL2 chart (total crypto market cap excluding Bitcoin) as of Sep 27, 2025. We're sitting at about 1.155T USD after a 6.93% dip.
I've been diving into Elliott Wave Theory here, and it's painting a pretty

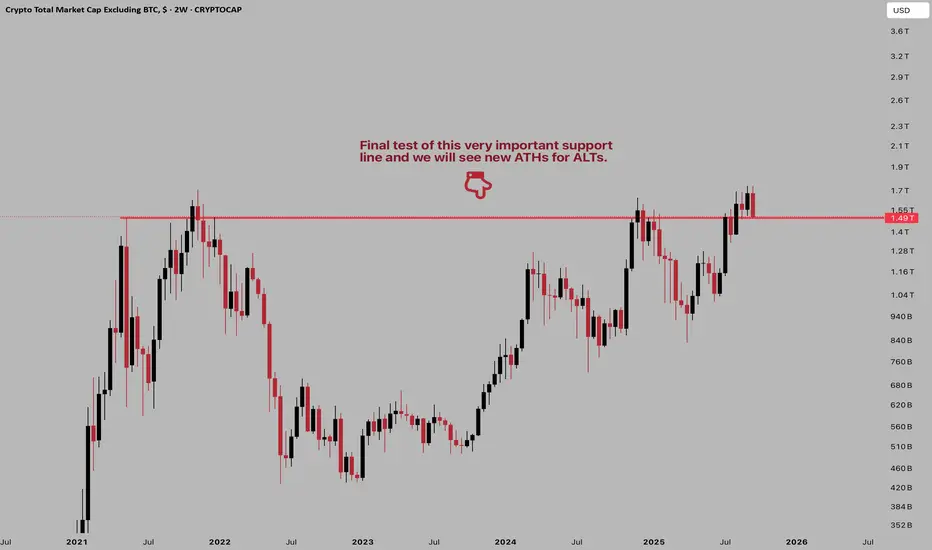
Final testFinal test of this very important support line. Alts about to go crazy in the next several months.
See all ideas
Summarizing what the indicators are suggesting.
Oscillators
Neutral
SellBuy
Strong sellStrong buy
Strong sellSellNeutralBuyStrong buy
Oscillators
Neutral
SellBuy
Strong sellStrong buy
Strong sellSellNeutralBuyStrong buy
Summary
Neutral
SellBuy
Strong sellStrong buy
Strong sellSellNeutralBuyStrong buy
Summary
Neutral
SellBuy
Strong sellStrong buy
Strong sellSellNeutralBuyStrong buy
Summary
Neutral
SellBuy
Strong sellStrong buy
Strong sellSellNeutralBuyStrong buy
Moving Averages
Neutral
SellBuy
Strong sellStrong buy
Strong sellSellNeutralBuyStrong buy
Moving Averages
Neutral
SellBuy
Strong sellStrong buy
Strong sellSellNeutralBuyStrong buy
Displays a symbol's price movements over previous years to identify recurring trends.