Key data points
Previous close
—
Open
—
Day's range
—
About Crypto Total Market Cap Excluding BTC, $
Bitcoin is quite a heavy-weight fighter which makes it difficult at times to correctly define how the crypto market is doing — it just outshines other coins, and you can't see clearly. Since Bitcoin presents such a huge piece of the crypto pie, excluding it from counting sounds reasonable and lets you see a more clear picture of where the crypto market is moving at the moment. That is what you can see on the chart we've prepared — calculated by TradingView, it displays global crypto market cap without Bitcoin's share.
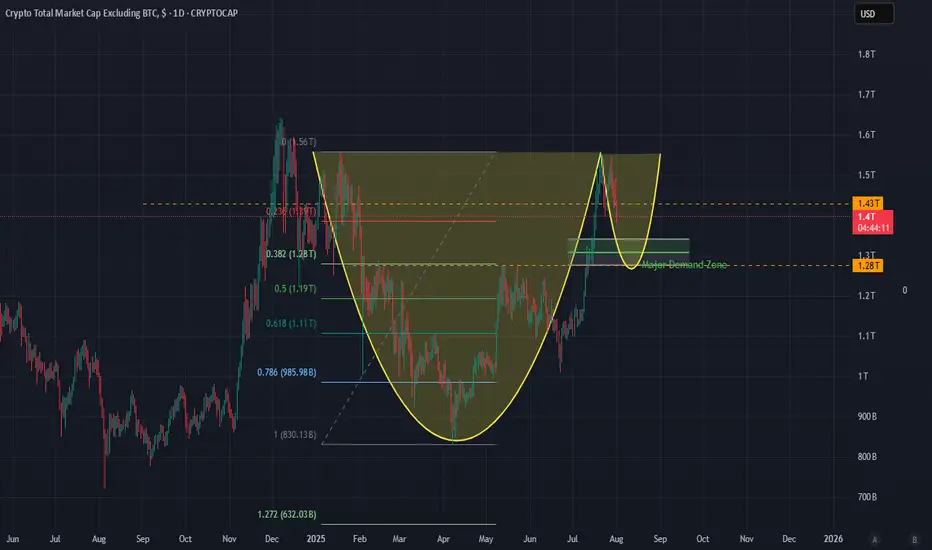
Total2Hello, we are in very important days for the crypto market. Many people have seen this pattern, but the neckline has not been broken yet. If the neckline is broken and the cup pattern is confirmed, I think Ethereum and altcoins will have a very good move.

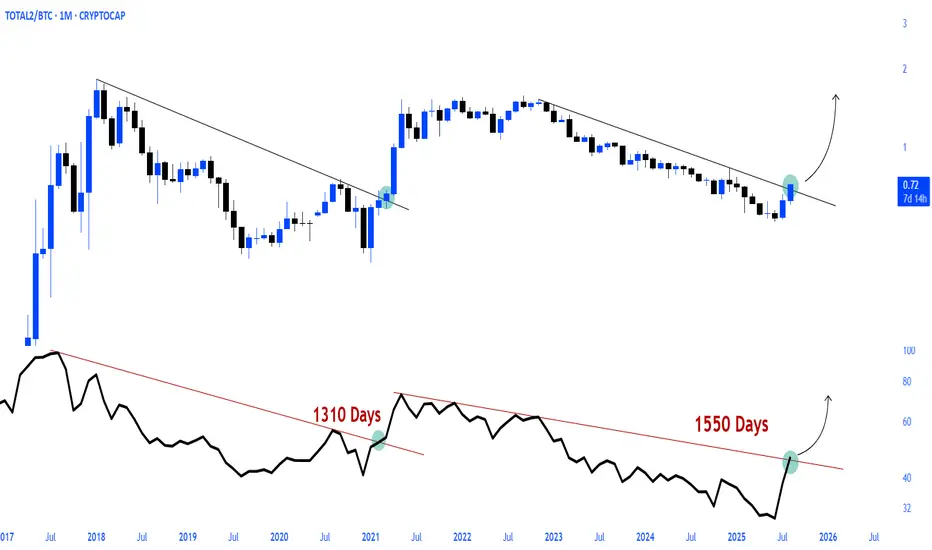
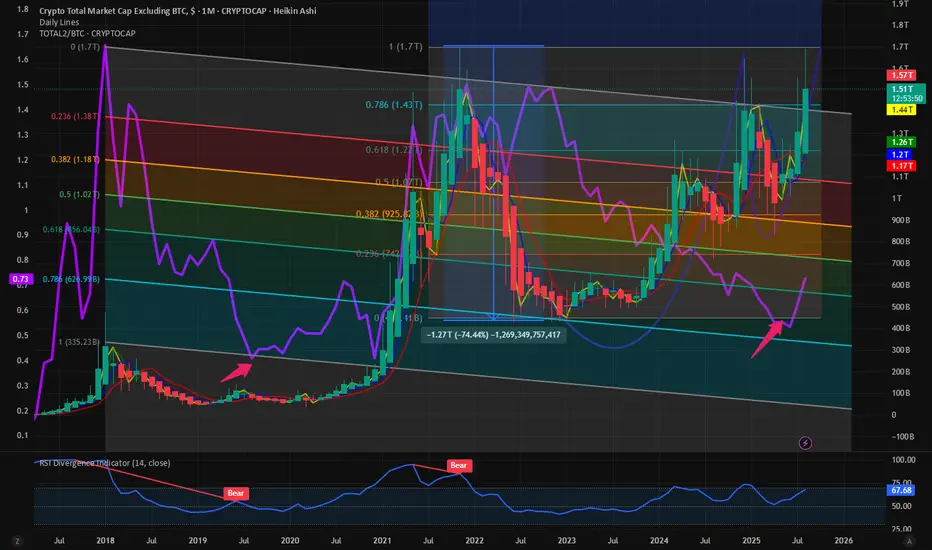
TOTAL2 / $BTCAltcoins Season Programmed.
After more than four years, a significant breakout occurred in the TOTAL2 / CRYPTOCAP:BTC pair, signaling major movements to come.
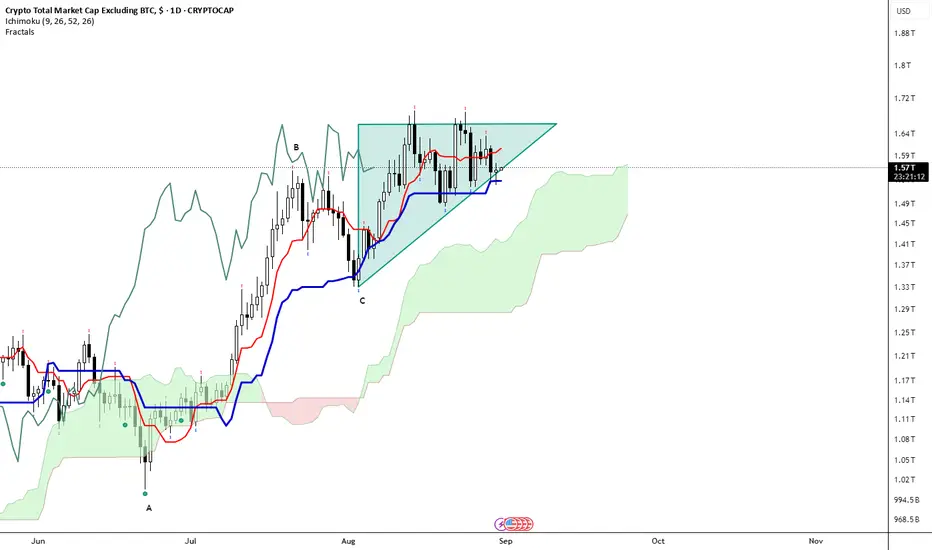
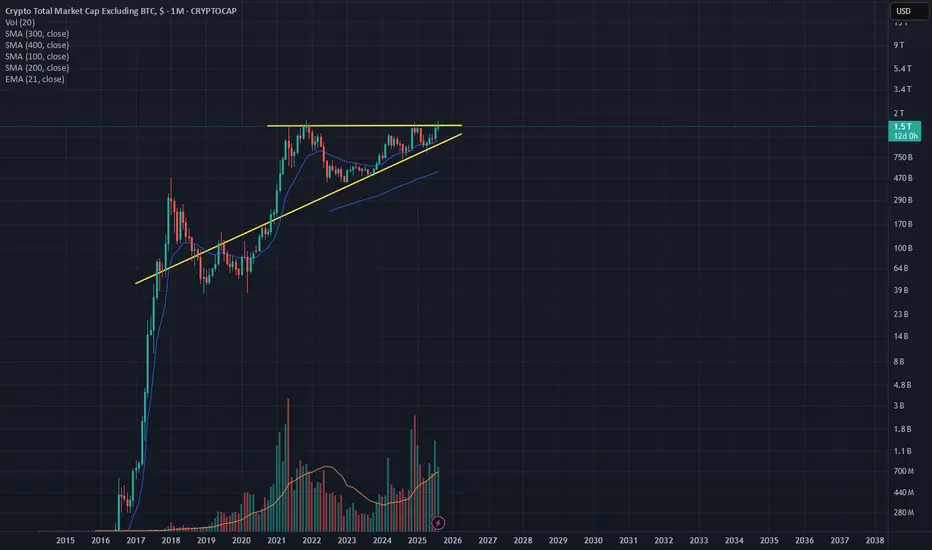
Bullish Triangle on DailyAs per title. Price also above rising kumo. Kijun still flat with tenkan rising. Chikou Span above price and rising.
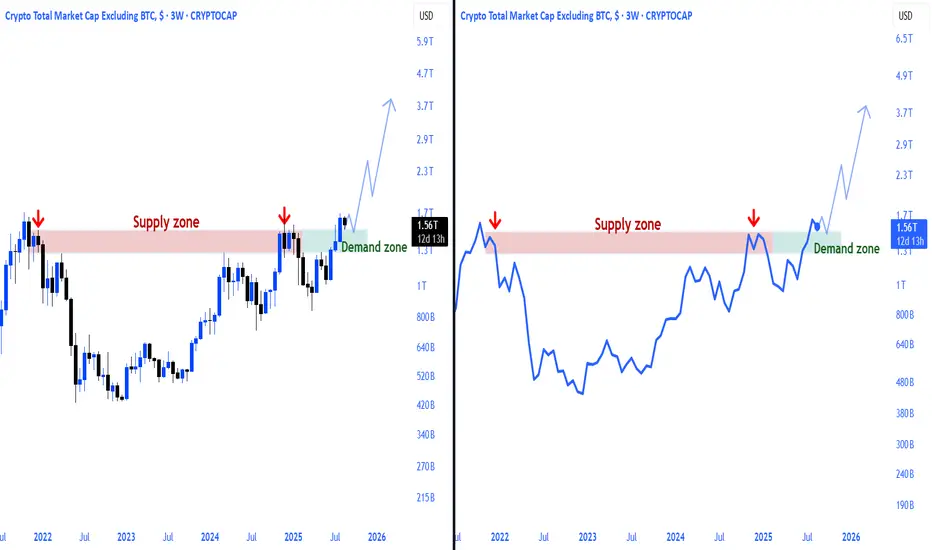
Crucial ResistanceThe ALT coins are approaching key levels where they were price reversals before. The ALT coin market cap has also tapped into resistance of an upward parallel channel. We need volume and bullish candles and momentum at the 1.55T area to hopefully see 1.71T. Please be careful.

MARKET UPDATE— August 1st, 2025“Handle before lift-off? Or is the bull year cooling off?”
Let’s address the question everyone is silently asking:
Are we nearing the end of the bull year… or is this just the calm before the next storm?
1. Total Market Cap (ALTS): Cup & Handle in Motion
We’ve observed something beautiful fo
$TOTAL2 vs BTC shows momentum with $TOTAL2 nearing ATHWhere is the Alt season? CRYPTOCAP:TOTAL2 is the best indicator of the Altcoin rally which does not include CRYPTOCAP:BTC and Stablecoins. CRYPTOCAP:TOTAL2 peaked at 1.7 T $ in the last cycle. In this cycle we are very close to our target. But this outperformance can only happen if CRYPTOCAP:
ALTCOIN BullmarketSeeing if the bullmarket follows the curved line plotted
Weekly Alt market chart
TOTAL2

Alt Season IncomingTotal 2 Excluding BTC has been forming in a ascending triangle since the top of 2021. Once we break up above and confirm it will be an a hell of a an alt season.
TOTAL2 Testing Support: Make or Break
TOTAL2 on the 1H is moving in sync with ETH, as expected.
We’re seeing the same local support zone, the same RSI & MACD bullish divergence, and the same death cross.
If today’s price action holds and bounces from this green support zone, then flips the daily open (black dotted line), that would m

See all ideas
Summarizing what the indicators are suggesting.
Oscillators
Neutral
SellBuy
Strong sellStrong buy
Strong sellSellNeutralBuyStrong buy
Oscillators
Neutral
SellBuy
Strong sellStrong buy
Strong sellSellNeutralBuyStrong buy
Summary
Neutral
SellBuy
Strong sellStrong buy
Strong sellSellNeutralBuyStrong buy
Summary
Neutral
SellBuy
Strong sellStrong buy
Strong sellSellNeutralBuyStrong buy
Summary
Neutral
SellBuy
Strong sellStrong buy
Strong sellSellNeutralBuyStrong buy
Moving Averages
Neutral
SellBuy
Strong sellStrong buy
Strong sellSellNeutralBuyStrong buy
Moving Averages
Neutral
SellBuy
Strong sellStrong buy
Strong sellSellNeutralBuyStrong buy
Displays a symbol's price movements over previous years to identify recurring trends.