TOTAL 2 ROAD MAPTotal 2 will start its upward move, but it will do so through a series of corrections along the way.
Market insights

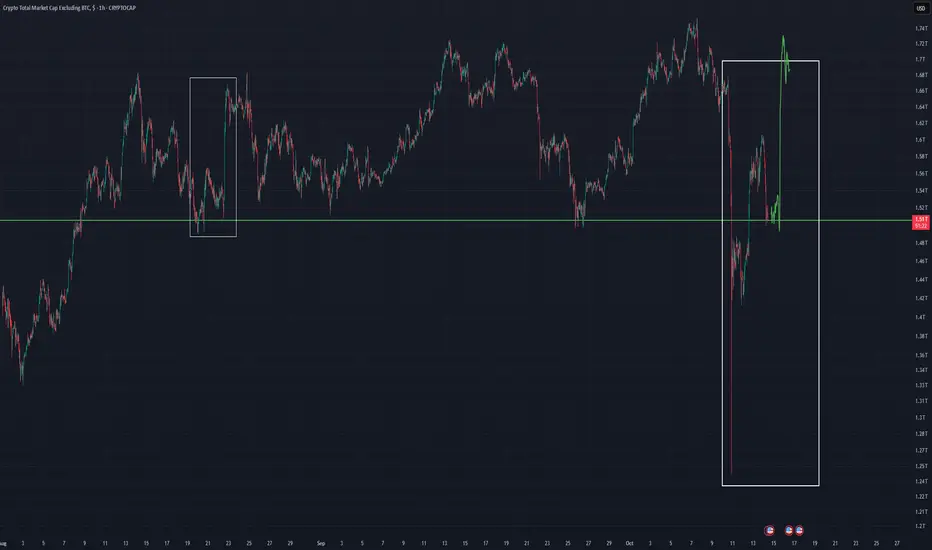
TOTAL2 - Recovered Support An hourly chart for Total2 suggesting price has recovered a horizontal support and may double bottom along this area
A potential bull reversal scenario on this timeframe (hourly)
Lets see what happens
TOTAL2 - Up Channel An up channel on the daily timeframe for the altcoin market or TOTAL2
Right now price is pressing the middle of the channel which could break to the upside and test the top of the channel again.
Simple Channel analysis

total2+total3 VS. bnbSame scenario, same journey Altcoins following BNB lead
BNB broke through the 2021 ATH resistance and supply zone, completed the retest phase, and started its own bull run.
Now, a similar pattern is forming on the Total2+Total3 chart.
The altcoin market is also in the 2021 peak zone, just like BNB, meaning it's in the final stage before a breakout.
The technical roadmap followed by BNB gives a strong indication of the potential direction for altcoins.
Same technical structure, same momentum... different chart, same goal.
The macro picture is clear.
BNB has started its run.
Altcoins are next.

Total2 \ Altcoins The Big picture hasn't spoken yet.
Short term fear and noise cannot overshadow the upward trend in the long term.
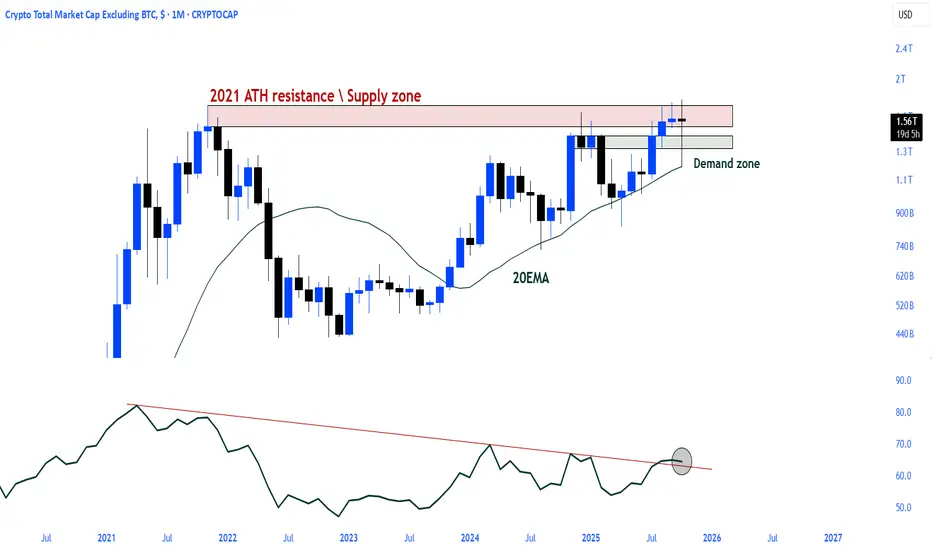
The 1M chart still shows a bullish trend.
The 2021 ATH resistance and major supply zone were tested in November 2024 but rejected. Following this rejection, the market entered a broad correction phase.
The subsequent recovery saw the price retest the 2021 ATH level but was rejected once again.
Nevertheless, the retest of the demand zone formed after November 2024 and the EMA20 region indicates that the structure remains strong.
Thailand or McDonald ?
🔥 We’re Standing on the Edge! 🔥
Total crypto market cap (BTC + Alts) on the monthly timeframe.
We’re sitting right under the 2021 all-time high resistance — and for the last 3 months, price has been trying and failing to break above it.
That means we’re on the razor’s edge right now ⚔️
📈 Scenario 1 – Breakout:
If we finally break through this resistance, it’s party time for everyone 🎉
That would trigger a massive altseason lasting several months — expect x3, x5 and beyond on many altcoins 🚀
📉 Scenario 2 – Rejection:
If we reject this level again (a 4th time 😬), it could get ugly —
we’d likely see a broad market correction of -20% to -25% at first…
and in the worst case, that could evolve into a mini bear market with -50% to -70% drawdowns before finding real support. 🩸
⚡️ For now, there are no bearish signals on the monthly timeframe,
so I’m staying bullish until proven otherwise. 💪
We’re at a confluence of major timeframes — whichever way it breaks,
the next move will be huge. 🌊
❇️❇️❇️ HOPE FOR THE BEST, BE PREPARE FOR THE WORST ! ❇️❇️❇️

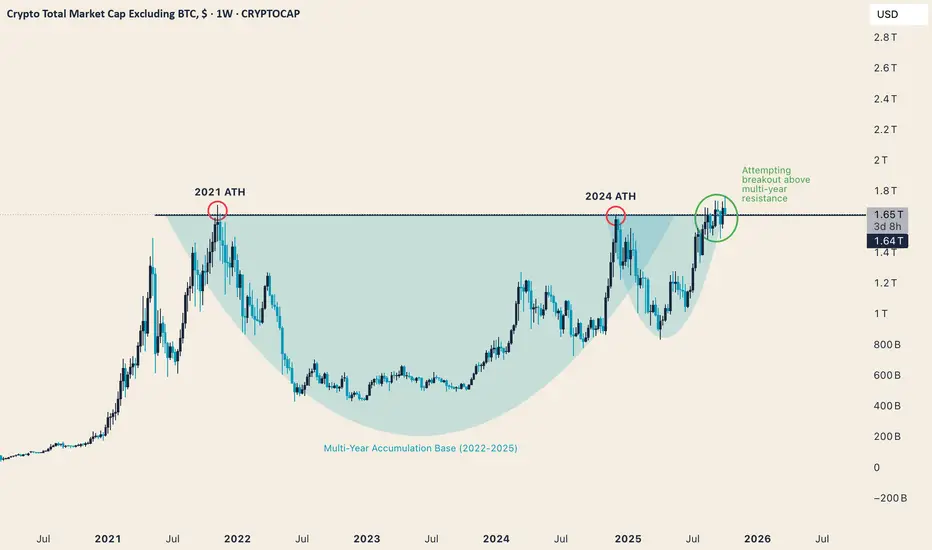
TOTAL2 (Altcoin Market Cap) - Multi-Year Resistance TestThe altcoin market is retesting the 1.7T level, aligning with both the 2021 and 2024 all-time highs.
This marks the first confirmed attempt at price discovery since the last cycle top.
Key Observations:
TOTAL2 remains structurally bullish above the 2024 higher low.
2021 + 2024 ATHs = confluence resistance.
Sustained weekly closes above = breakout confirmation.
Rejection could signal another consolidation before expansion.
If confirmed, this would be the start of a macro expansion phase for alts - but structure confirmation remains essential.
📊 Educational chart. Not financial advice. Past performance ≠ future results.
Total 2 looks bearish. Technically, Total 2 bearish indicators are:
1. Formation of an OBO pattern
2. The OBO target aligns with the channel bottom
3. The OBO target aligns with the FiB 0.5-0.618 (golden zone)
4. The general market is showing bearish signals.

The Unexpected Top? Is this the final leg for alts?Bitcoin is now institutionalized. It’s manipulated to move like S&P stock. Doesn’t need to mirror the price action but in gradual surges of around 90-110% from the Q4 Lows.
Everyone is waiting for euphoria but with retail getting debased to 0 they choose food over coins.
The biggest hoax was getting us ALL to believe Top = Eurphoria. This cycle top will be silent and deadly.

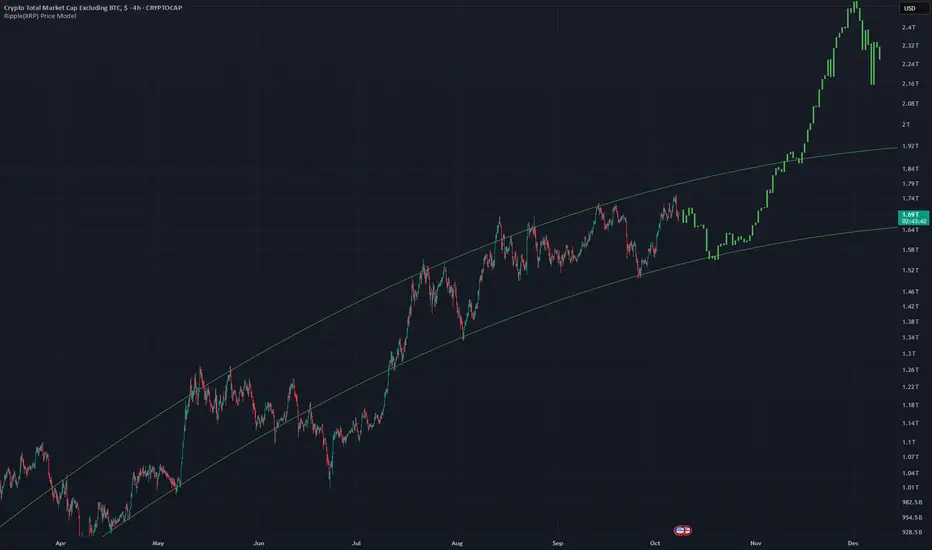
TOTAL2 - Break Out of Curved Channel Price has been moving up along this channel for awhile now and it is now time to break out of it.
This is the 4Hr chart for the altcoin market. A similar pattern occurred on same chart months ago and the bars pattern (in green) is the result of the curved channel breakout.
Lets see what happens.
Total 2 New AthLast night was a new Ath for the Alts - Ascending support on the Gann 2x1 fib ray needs to hold to get the candles back above the 100% fib

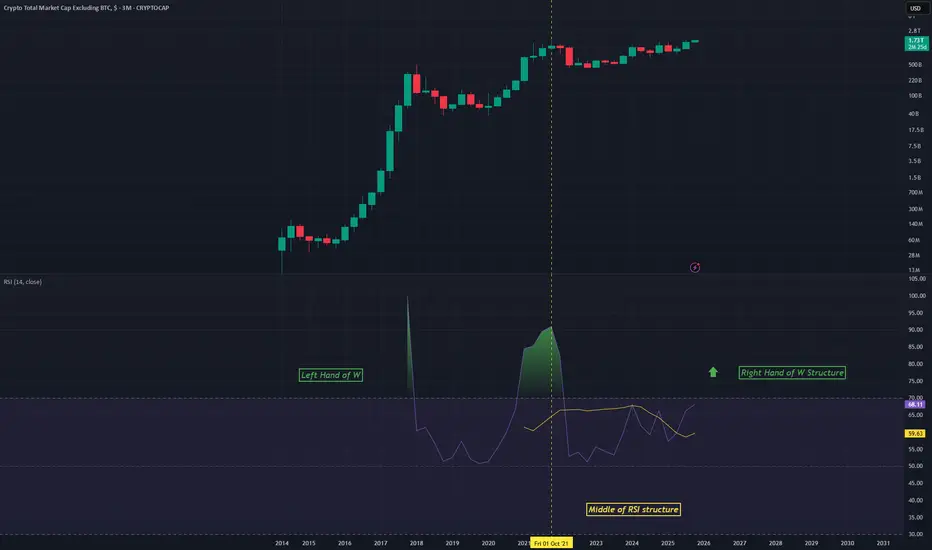
TOTAL2 - RSI StructureAn idea using the RSI on the Monthly chart for TOTAL2
A sort of W pattern is forming on the RSI
We are about to experience the right hand of this W structure which is a bullish phase
Long big altcoins
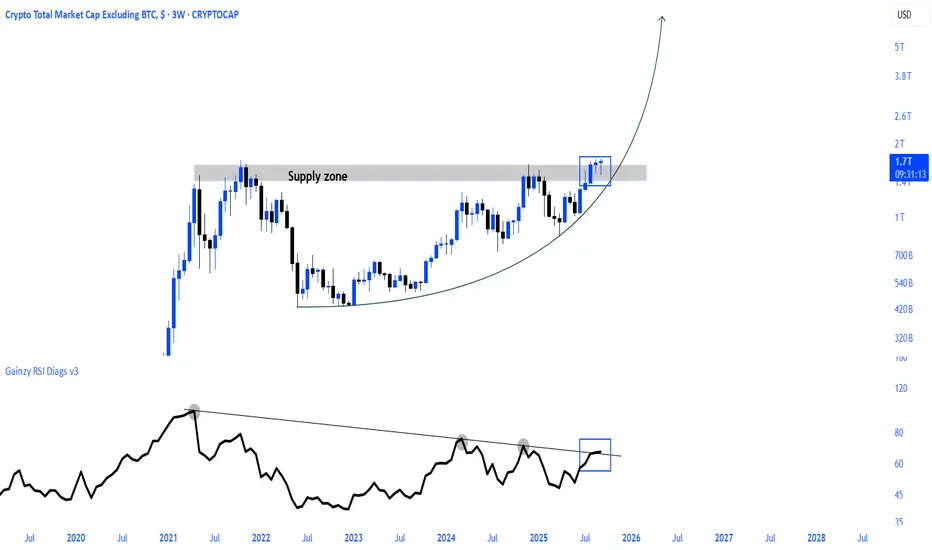
Altcoin Market Cap (TOTAL2) Breaking the 2021 Bull Market PeakThe TOTAL2 chart, representing the total crypto market cap excluding Bitcoin, has officially broken above its 2021 bull market highs for the first time in nearly 4 years.
This breakout marks a major structural shift from consolidation into potential expansion.
Key levels & structure:
Breakout zone: $1.7T (2021 cycle high)
Measured move projection: $2.98T (conceptual target if expansion structure repeats)
Invalidation: Weekly close back below $1.7T
Historically, sustained breakouts of this magnitude have preceded broad capital rotation into the altcoin market, often leading to what traders call Altcoin Season.
What do you think, is this the early stage of the next expansion phase or just a false start?
📊 Educational chart — not financial advice. Market structure can change.

Altcoins VS. SilverSimilar technical structure in two different markets
Price and RSI are breaking above the major resistance level together.
Altcoin market cap (Total2) and silver chart, with the same supply zone and RSI breakout pattern, show a structural bullish signal.

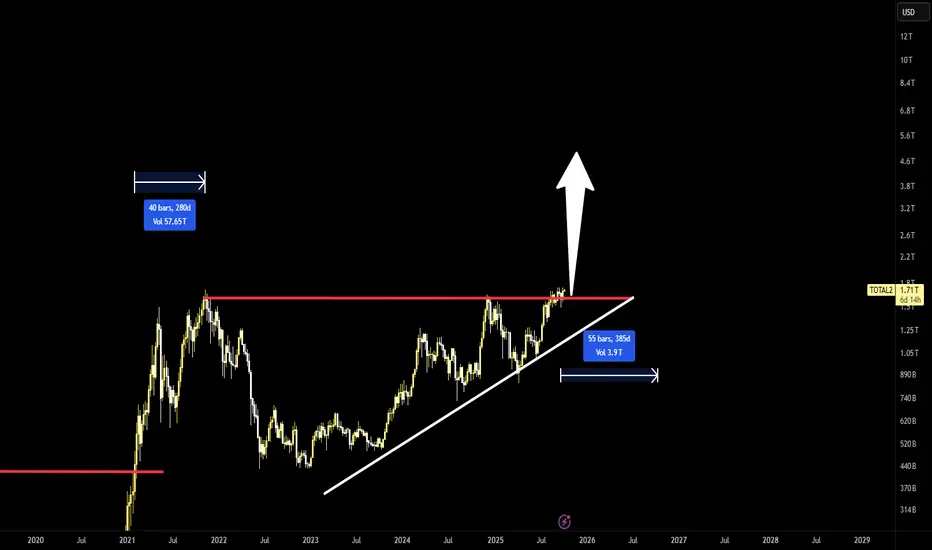
Crypto supercycle - the journey to 5T alt cap begins- it has been a long wait and definitely a different market cycle compared to the rest but it seems the patience is finally about to pay off
- TOTAL2 in a clear, multi-year ascending triangle that has now been resolved to the upside
- looking at +10$ XRP, +1$ DOGE, + 12k ETH, + 600$ Litecoin and + 4 CRYPTOCAP:XLM before I would consider this market cycle to be over
- have fun and don´t get liquidated
Alt Season? Or Bull Trap...Either we're about to go full on parabolic or it's a huge bull trap - can't be anything else at this point - Looks to be in the early stages of a larger wave 3.

Altcoins Season \ Total2
The Altcoins market cap (TOTAL2) is on the verge of a parabolic breakout.
TOTAL2 has reached a critical threshold,
the Altseason is about to ignite.
Layer 1 Liquidity — The Silent Game-Changer?🧩 There’s a pattern brewing beneath the noise...
While most eyes are glued to Bitcoin and Ethereum liquidity traps, Layer 1 liquidity (bottom left chart) seems to be quietly building pressure — right at a structural point where previous bearish algorithms have always regained control.
But this time, the reaction looks different.
The liquidity sweep didn't trigger a deep rejection — instead, we’re seeing compression and absorption, a sign that the bearish liquidity algorithm might finally be cracking.
If this continues, the market may be preparing for a structural shift — where Layer 1s stop following Bitcoin’s macro rhythm and start writing their own narrative.
Look closer and you'll notice:
📈 BTC liquidity = tested .
📈 ETH liquidity = neutralizing .
📈 Layer 1 liquidity = expanding .
That's how regime changes start — quietly, while everyone's watching something else.
My View:
If Layer 1 liquidity breaks through this zone with momentum, it could mark the first macro desynchronization event since 2021—a setup where real capital rotation begins from majors to infrastructure plays.
Watch this level closely — the next few candles could redefine the flow of capital in this cycle.
#CryptoMarketCap #Layer1 #Liquidity #BTC #ETH #MarketStructure #GannVision

Altcoins Index TOTAL2 and TOTAL3 are on the verge of a major breThe major resistance level that has persisted for almost 4 years since the 2021 ATH in two pairs is also on the verge of breaking the supply zone.

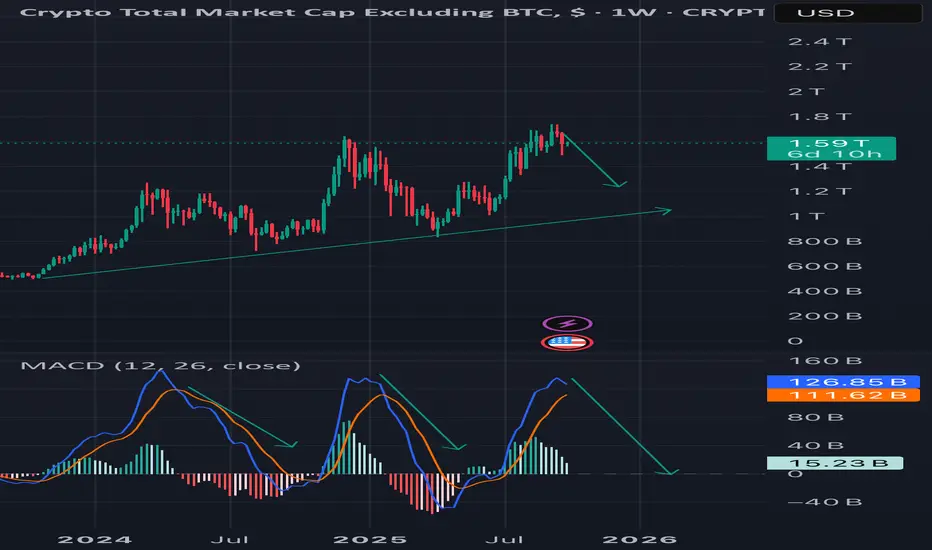
Total 2 alt coins marketcapSo this chart if it repeats the same pattern as the last two times it heading lower we can see Macd cross approaching I think the bear market has begun and we will go lower now . Positive news are exhausted I think we will hit a new low by January
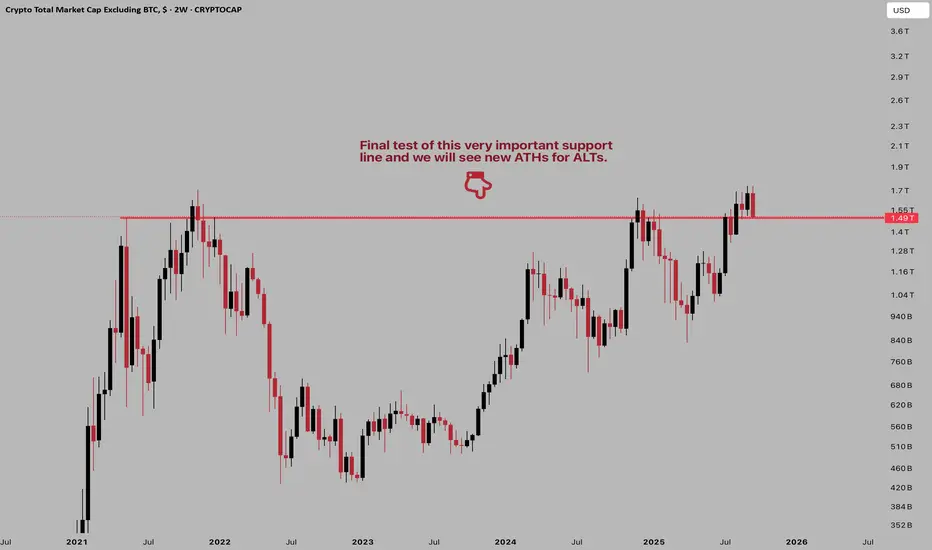
Final testFinal test of this very important support line. Alts about to go crazy in the next several months.
Technical Analysis: Total 2 (Excluding Bitcoin)Based on the provided chart, we can identify several bearish signals for the "Total 2" market cap, which represents the total value of cryptocurrencies excluding Bitcoin.
The price has formed a Rising Wedge pattern, a classic bearish reversal formation. This pattern indicates that the bullish momentum is weakening as the price moves higher.
Furthermore, the price made a Deviation above the wedge's resistance line, failing to sustain the breakout and subsequently falling back into the pattern. This is a common "fake-out" signal that confirms the bearish bias of the pattern.
Adding to the bearish case, a clear Bearish Divergence has formed between the price and the RSI (Relative Strength Index) indicator. While the price made higher highs, the RSI made lower highs, indicating a loss of momentum and a high probability of a price correction.
Conclusion: The combination of the Rising Wedge pattern, the Deviation, and the Bearish Divergence suggests a high probability of a downward movement in the Total 2 market cap in the near term

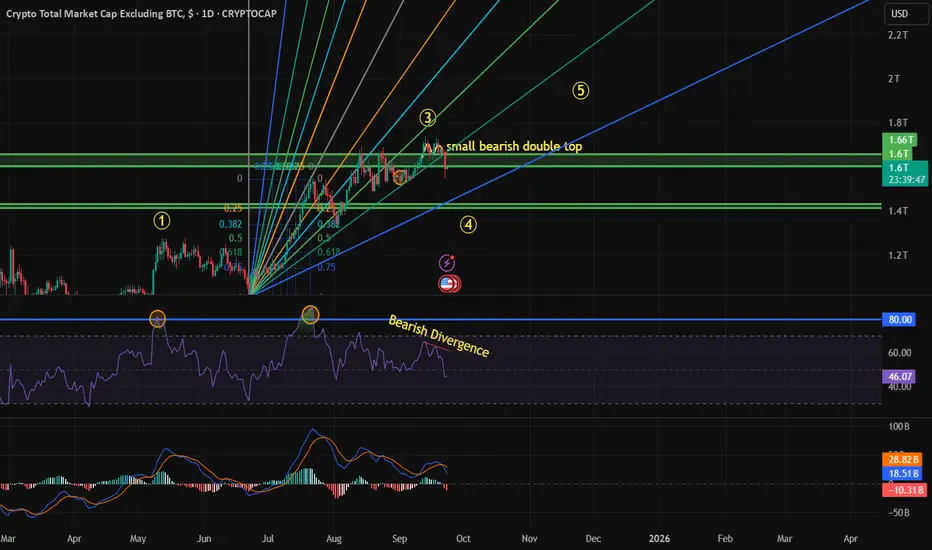
Altcoin Market Correction Underway – Final wave is coming!The total crypto market cap excluding BTC has likely completed Wave 3. At the end of Wave 3, a small bearish double top appeared, and the RSI confirmed weakness with a bearish divergence. During Wave 1, the RSI crossed 80. During Wave 3 going up, the RSI crossed 80 again and reached 86, which indicated that the uptrend would continue. However, at the peak of Wave 3, the divergence suggests exhaustion.
On the Fibonacci speed resistance band, drawn from the end of Wave 2, the price already broke below the 0.618 level. At the same time, BTC dominance broke its downtrend line and increased by more than 1 percent and breaking 0.618 fib resistance, showing capital rotation back to Bitcoin.
All these signals point to the start of Correction wave, the nearest strong support is the 1.42-1.43 trillion (speculative to reach those levels) bulls could push higher before reaching those, BTC correction wave is still ongoing aswell