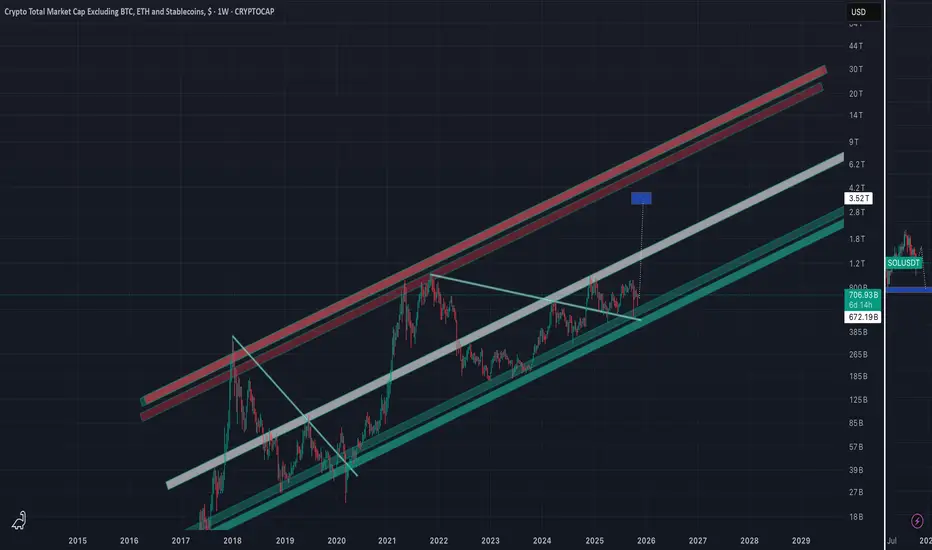
Altcoins Market ETA- So this graphic show only Cryptos and when i speak only Cryptos, it means " No BTC, No ETH, Not Stablecoins ", Only Altcoins !
- This post is not a price prediction, not a FUD, and not a FOMO, it's just my own opinion based on facts.
- Without BTC/ETH and Stables, the crypto market barely reache
Crypto Total Market Cap Excluding BTC, ETH and Stablecoins, $
No trades
Key data points
Previous close
—
Open
—
Day's range
—

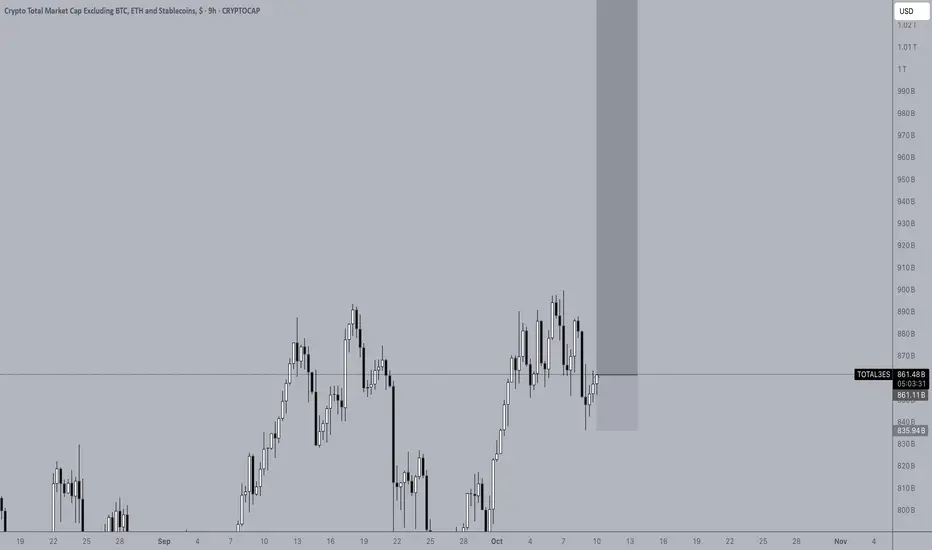
THE TRUTH LINEMake ir or break it moments are rare. Feb 16-03 seems to be an important date. 700-740B huge resistance. We probably tag it by then. The question is: what happens then?

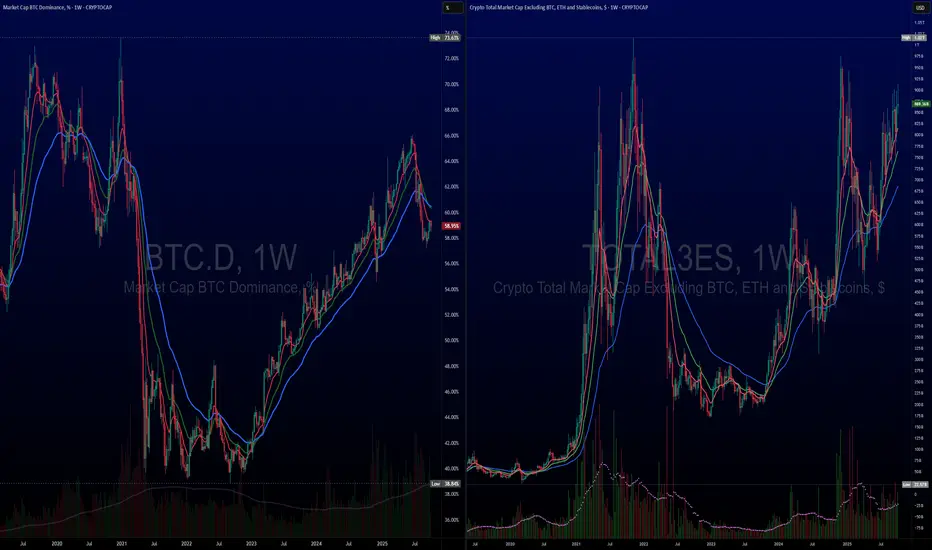
Pure Altcoins and Global Money Supply - GLIThroughout the cycles in Crypto, there is one common denominator, one fuel, one reason for the staggering percent rises. It's NOT the automatic 4 year cycle that creates scarcity, and so demand becomes the main driver. This is also true, ye, and it was especially true in the beginning of the Bitcoin

total3es is at very bottomWhoever tells you this is the cycle peak, they have absolutely zero what the heck they're talking about. In fact, we're probably at the very bottom of this cycle for the Altcoins. And we may see a big rally in the next couple of months to at least 3.5 trillions.
No QE, No Alt SeasonIf we mirror the current setup to the 2019 QE playbook, altcoins could face significant selling pressure in the near term.
From last night’s Fed statement, the central bank confirmed it will halt balance sheet reduction (QT) on December 1st. While the market initially interpreted this as a risk-on

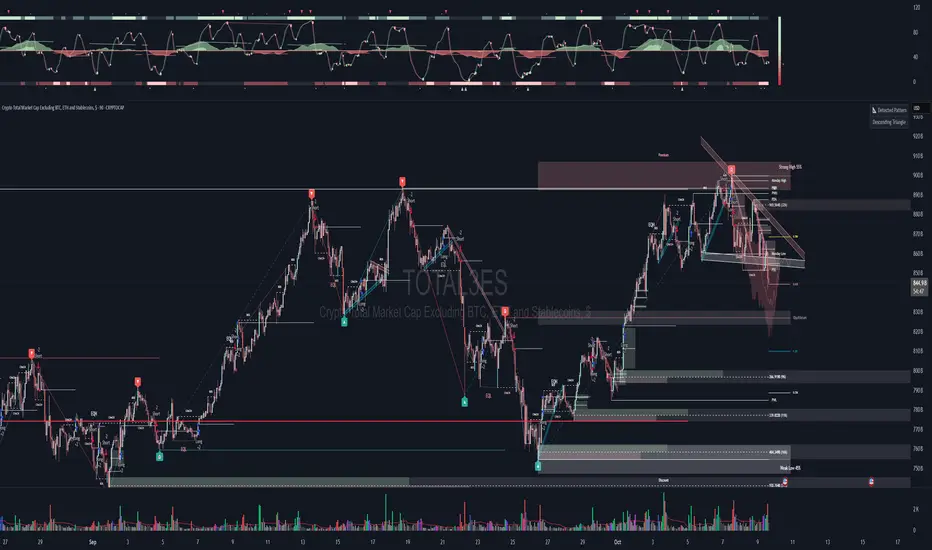
Have Altcoins Hit a Cycle Top?Altcoins have not hit a cycle top as of October 9, 2025. The data and market dynamics suggest altcoins are in a strong mid-cycle phase, with growing momentum and capital rotation from Bitcoin, but not yet at the euphoric distribution phase typical of a cycle peak. Here's why:Market Metrics: The tota
Crypto = Stocks, saying this since 2021Sorry for not posting as much
Want more? A lot more? See profile for more info.
Until we see a significant shift and change to our theses since 2021 >Crypto = Stocks. People were clamoring institutions. When big boys come to the party things change. Deal with that now. It is not the same game.
Sin
$TOTAL3 DIDN'T MAKE A NEW ATH YET!Differing from all Altcoins "engagement farming bullish posts" TOTAL3:
CRYPTOCAP:TOTAL3 DIDN'T MAKE A NEW ATH YET!
In fact we're 18% below 2021 ATH
They forget to exclude stablecoins in the MCap equation

TOTAL3 / ETH - 3 White Soldiers3 White Soldiers printed on the TOTAL3 / ETH Weekly Close.
Oversold RSI confirms the bottom.
Should reclaim that 9WEMA this week.

See all ideas
Summarizing what the indicators are suggesting.
Oscillators
Neutral
SellBuy
Strong sellStrong buy
Strong sellSellNeutralBuyStrong buy
Oscillators
Neutral
SellBuy
Strong sellStrong buy
Strong sellSellNeutralBuyStrong buy
Summary
Neutral
SellBuy
Strong sellStrong buy
Strong sellSellNeutralBuyStrong buy
Summary
Neutral
SellBuy
Strong sellStrong buy
Strong sellSellNeutralBuyStrong buy
Summary
Neutral
SellBuy
Strong sellStrong buy
Strong sellSellNeutralBuyStrong buy
Moving Averages
Neutral
SellBuy
Strong sellStrong buy
Strong sellSellNeutralBuyStrong buy
Moving Averages
Neutral
SellBuy
Strong sellStrong buy
Strong sellSellNeutralBuyStrong buy
Displays a symbol's value movements over previous years to identify recurring trends.