ULTA Earnings Play---Money About TO Print
# 🚀 ULTA Earnings Play (8/28 AMC) 🚀
💎 **Moderate Bullish | 65% Conviction** 💎
🎯 **Trade Setup**
📊 Ticker: \ NASDAQ:ULTA
🔀 Direction: CALL 📈
🎯 Strike: 560.00
📅 Expiry: 2025-08-29
💵 Entry: 6.10 (ASK)
📦 Size: 1 contract (risk 💸 \$610)
🎯 Target: 15.25 (150%+)
🛑 Stop: 3.05 (-50%)
⏰ Timing: Pre-earnings close (8/28 AMC)
⚡ **Why Bullish?**
* 📈 Strong momentum near 52W high
* 🔥 88% beat rate (avg. surprise 7.6%)
* 📊 Options flow call-skewed (\$527–545 cluster)
* 🚀 Technicals > Fundamentals → short-term edge
✅ **Execution Rule**: In before close, out within 2h post-earnings or at stop/target.
---
### 📌 Suggested TradingView Tags
\#ULTA #UltaBeauty #EarningsPlay #OptionsTrading #CallOptions #WeeklyOptions #BullishSetup #MomentumTrading #TradeIdeas #StockMarket 🚀📊
34U trade ideas

Ulta Beauty Is Up 70% Since March. Does Its Chart Look Pretty?Ulta Beauty NASDAQ:ULTA plans to report fiscal Q2 earnings this week at a time when its stock has risen some 70% from a 52-week intraday low reached in March. Does the stock's technical and fundamental analysis look pretty ... or will ULTA find itself needing a makeover following the numbers' release?
Let's check things out:
Ulta Beauty's Fundamental Analysis
ULTA will release results Thursday after the bell, hoping to build on the three really solid quarters in a row that it's reported relative to analyst expectations over the past nine months.
Most recently, the company's fiscal Q1 earnings release in May beat the Street's expectations for GAAP earnings per share by a whopping $0.90 while returning to year-over-year sales growth. Shares popped 11.8% the next day.
For this week's results, analysts' consensus estimate as I write this calls for ULTA to report $5.11 in fiscal Q2 GAAP earnings per share on about $5.1 billion of revenue.
Two sell-side analysts rated at five stars out of a possible five by TipRanks gave ULTA fresh votes of confidence earlier this month.
First, Susan Anderson of Canaccord Genuity reiterated her "Buy" rating and $600 price target on the stock. A few days later, Michael Lasser of UBS reiterated his "Buy" rating while increasing his target price all the way to $640 from a previous $525. (ULTA closed at $526.06 on Tuesday.)
Lasser wrote in a client note that strategic investments meant to rejuvenate ULTA's core U.S. brick-and-mortar presence are actually bearing fruit. He expects the firm to report solid top-line momentum in its latest quarter, along with an outlook that leaves open the likelihood of further earnings beats and price-target raises.
I also found it interesting that Ulta and Target NYSE:TGT recently announced plans to end an arrangement under which Target sells Ulta merchandise within TGT stores.
The news seemed concerning at the time, but investors last week learned what a mess Target is when the retail giant reported poorly received quarterly results and announced plans to soon replace CEO Brian Cornell with COO Michael Fiddelke.
While Target and Ulta didn't reveal just who terminated their relationship, it's easy to see how ULTA might have wanted to disengage from the partnership.
Ulta Beauty's Technical Analysis
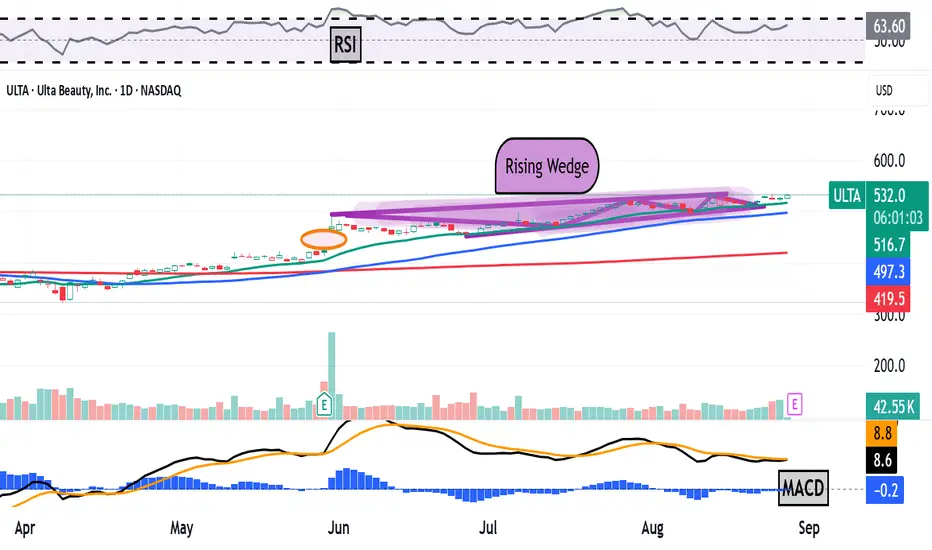
Now let's look at ULTA's chart going back some 16 months and running through Aug. 22:
Readers will see that ULTA has been in rally mode since this past March.
That said, the way that this rally developed might put the stock's upward momentum at risk.
Zooming out, we can see that ULTA struggled through a giant "double-bottom" pattern of bullish reversal, marked with a solid black line and two green boxes in the chart above. That pattern bottomed out this past March.
Shares then gapped higher with Ulta's well-received fiscal Q1 earnings release on May 29. This helped create what's called a "bullish-pennant" pattern of trend continuance, marked with green shading and a green box at the chart's right.
That's all well and good, but coming out of the pennant, the stock appears to have built a "rising-wedge" pattern of bearish reversal, as denoted by purple shading above.
ULTA has since touched the upper trendline of this wedge twice, while hitting the wedge's bottom line three times. It's typical to see two to three touches of both trendlines ahead of a breakout or breakdown from such a pattern.
Ulta's upside pivot would be the stock's $534.10 recent high, while its downside pivot would be the stock's 50-day Simple Moving Average (or "SMA," marked with a blue line at $492.10 in the chart above).
That said, a break below the 50-day SMA could lead to a test of the stock's 200-day SMA, marked with a red line at $416.60 in the chart above. That's much lower than the 50-day SMA, and running fairly close to where the gap from the stock's late May/early June run would fill.
Meanwhile, Ulta's Relative Strength Index (the gray line at the chart's top) looks solid, but not technically overbought.
However, the stock's daily Moving Average Convergence Divergence indicator (or "MACD," marked with gold and black lines and blue bars at the chart's bottom) seems problematic.
The histogram of Ulta's 9-day Exponential Moving Average (or "EMA," marked with blue bars) is in negative territory and has been in more often than not since mid-June.
Additionally, the 12-day EMA (the black line above) is currently running below the 26-day EMA (the gold line).
These are all negative technical signals, although the fact that the 12- and 26-day lines are both in positive territory does temper things a bit.
All in, this is an interesting chart ... but one that points to potential risk for Ulta.
(Moomoo Technologies Inc. Markets Commentator Stephen “Sarge” Guilfoyle had no position in ULTA at the time of writing this column.)
This article discusses technical analysis, other approaches, including fundamental analysis, may offer very different views. The examples provided are for illustrative purposes only and are not intended to be reflective of the results you can expect to achieve. Specific security charts used are for illustrative purposes only and are not a recommendation, offer to sell, or a solicitation of an offer to buy any security. Past investment performance does not indicate or guarantee future success. Returns will vary, and all investments carry risks, including loss of principal. This content is also not a research report and is not intended to serve as the basis for any investment decision. The information contained in this article does not purport to be a complete description of the securities, markets, or developments referred to in this material. Moomoo and its affiliates make no representation or warranty as to the article's adequacy, completeness, accuracy or timeliness for any particular purpose of the above content. Furthermore, there is no guarantee that any statements, estimates, price targets, opinions or forecasts provided herein will prove to be correct.
The Analyst Ratings feature comes from TipRanks, an independent third party. The accuracy, completeness, or reliability cannot be guaranteed and should not be relied upon as a primary basis for any investment decision. The target prices are intended for informational purposes only, not recommendations, and are also not guarantees of future results.
Moomoo is a financial information and trading app offered by Moomoo Technologies Inc. In the U.S., investment products and services on Moomoo are offered by Moomoo Financial Inc., Member FINRA/SIPC.
TradingView is an independent third party not affiliated with Moomoo Financial Inc., Moomoo Technologies Inc., or its affiliates. Moomoo Financial Inc. and its affiliates do not endorse, represent or warrant the completeness and accuracy of the data and information available on the TradingView platform and are not responsible for any services provided by the third-party platform.
ULTA eyes on $455/457: Key support after Earnings spike and DipULTA had a good earnings report and spiked into resistance.
Now pulling back to first good support at $455.61-457.03
Look for this to hold, or dip below and then Break-n-Retest

ULTA what a beautyNASDAQ:ULTA has been frustrating to wait for but might be ready to go
forming a consolidation similar to what it did in end of 2023, and could go way above 500 if it follows through
less taxes on tips means those ladies will have more money to spend on makeup and ULTA will profit from it
stops would be a weekly close below the 9 EMA or 2 daily closes below the 21 EMA

Ulta consolidation. Wait for breakULTA is in a consolidation phase post-Q1 2025 earnings, trading between $421.79 (support) and $465.48 (resistance). To identify a breakout:
Price Levels: Watch for a daily/weekly close above $465.48 (bullish, targeting $480–$510) or below $421.79 (bearish, targeting $367.76–$338).
Moving Averages: Monitor the 200-day MA ($442.22, ~40-week MA) for support; a break above $465.48 (50-day MA) is bullish, below $442.22 is bearish.
RSI: Look for RSI >60 (bullish) or <50 (bearish) to confirm momentum.
MACD: A strengthening bullish crossover above $465.48 or bearish crossover below $421.79 signals direction.
Volume: Confirm breakouts with volume >1.5M shares.
Patterns: An inverse head and shoulders breakout above $465.48 is bullish; a head and shoulders breakdown below $315 is bearish.
Fibonacci: Watch $400.45 (50% retracement) for bearish targets, $448.66 (23.6%) for bullish.
ATR: Expect ±$10.98 daily moves; set alerts at $469.25 (bullish) and $447.29 (bearish).
On TradingView, set a custom layout with these indicators, disable “Auto (Fits Data to Screen),” and save to persist zoom. Set alerts at $465.48, $421.79, and $442.22. In your Trading 212 ISA, ULTA’s gains are UK tax-free, but monitor USD conversion fees.

ULTA IdeaLong term watchlist. Both a consumer durable and real estate play.
GreenBlue: 220
GreenRed: 262


ULTA watch $370 above, 349 below: Golden fibs to define key zoneULTA holding up reasonably well compared to the market.
Bound by Golden Genesis above and a Golden Covid below.
Watch for break of either Golden to determine next move.
$370.57 above, $349.27 below are the exact levels to watch.
=====================================================
.

Ulta's Makeover: A Bullish Beauty?Check out Ulta Beauty's chart – looks like it might be prepping for a breakout! We're seeing what appears to be an "inverse head and shoulders" pattern forming (see: left shoulder, head, right shoulder). This formation usually signals a potential trend reversal, suggesting the downtrend may be losing steam and a bullish move could be brewing. If it breaks above the "neckline" around $375, it could be confirmation. Of course, patterns are probabilities, not guarantees! Are you betting on Ulta's glow-up, or thinking this trend might fade? Share your thoughts below!

ULTA - channel breakout here possible $400 in playULTA - stock having a channel breakout on daily time frame. stock holding strong when market pulling back ending with almost another hammer candle. looking for calls on this one as long as $370 holds for a move towards $400 and higher

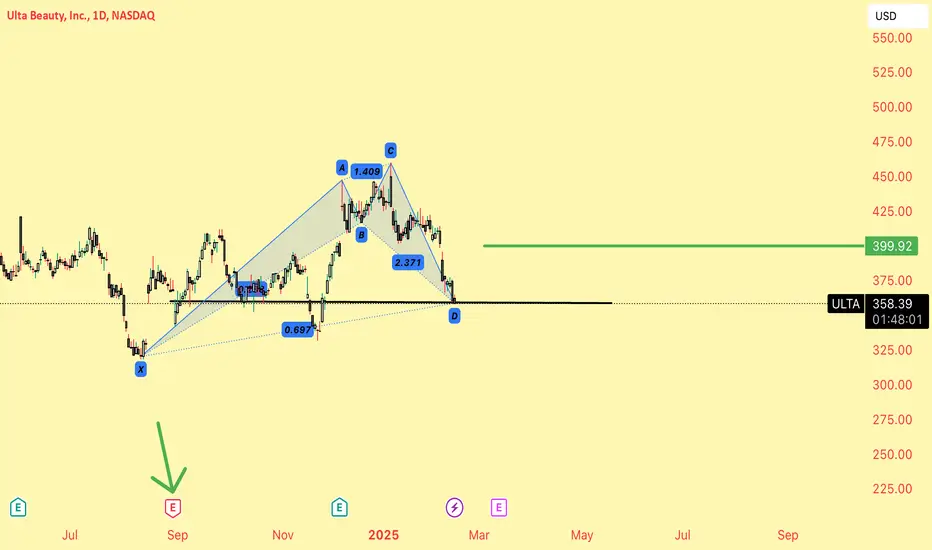
ULTA to $400My trading plan is very simple.
I buy or sell when:
* Price tags the top or bottom of parallel channel zones
* Money flow spikes above it's Bollinger Bands
* Price at Fibonacci levels
So...
Here's why I'm picking this symbol to do the thing.
Price in buying zone at bottom of channels (period 100 52 & 26)
Stochastic Momentum Index (SMI) at oversold level
Money flow momentum is spiked negative and under bottom of Bollinger Band
Entry at $358.72
Target is $400 or channel top

ULTA BULLISHI think Ulta has gotten beaten up enough here and is currently at it's earnings line from August 2024.
I think this is a great spot to add. Not financial advice, good luck to all :)
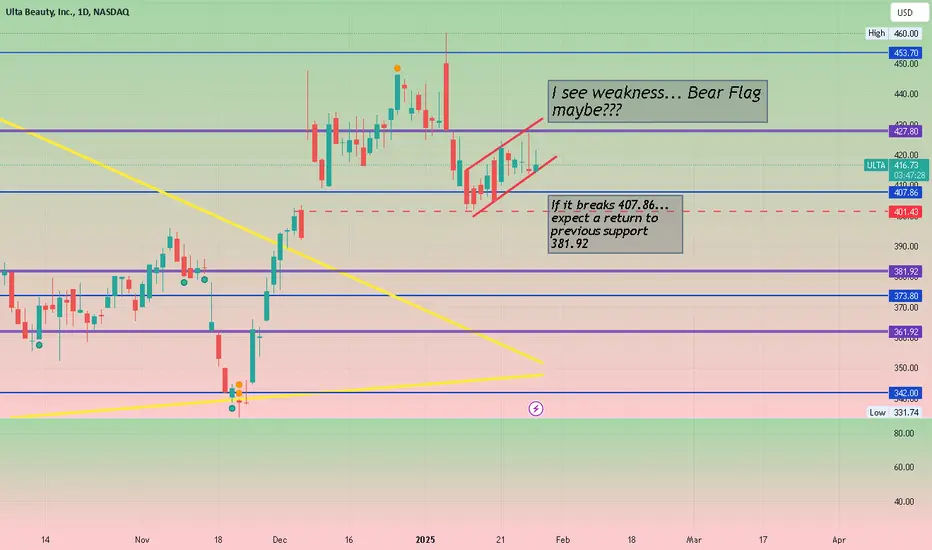
Bear Flagging... I see weakness on the daily. I'm looking at 2/28 380 Puts at a cost of about 4.00
Again, I am not a financial guru... just pointing out what I see and the play I'm interested in taking. Please attempt your own Due Diligence before jumping into a trade blindly.
Major Price Movement Incoming for ULTA!Signalist has detected a precise pattern in NASDAQ:ULTA trading activity, signaling that a substantial price movement is imminent. This isn’t a random fluctuation—it’s a carefully analyzed precursor to a significant market event.
📅 What to Expect:
⌛ Timeline: Anticipate a major move within the next 1 to 4 upcoming 3-hour candles.
📈 Monitor the Charts: Keep an eye on ULTA’s price action over the next few candles.
Prepare Your Strategy: Whether you’re bullish or bearish, have your trading plan ready to capitalize on the move.

$ULTA - ascending triangle pattern breakoutULTA - Stock breaking out of ascending triangle pattern on daily time frame. Added calls in group. Still good to add calls as long as $445 holds. Next resistance at $450 and $475. Stock has bigger gap above $475 to fill. Stock is strong on indicators. Company recently posted better than expected earnings


ULTAif 380 hold, going to 410 ST
an upward trend in the prices of an industry's stocks or the overall rise in broad market indices, characterized by high investor confidence

ULTA in the buying zoneMODs have suggested that I provide more detail about the picks I make.
Sorry. I'm not as verbose as y'all, and I don't like things to be complicated.
My trading plan is very simple.
I buy or sell at top & bottom of parallel channels.
I confirm when price hits Fibonacci levels.
So...
Here's why I'm picking this symbol to do the thing.
Price sitting on 52 period channel, below 39& 26, with $330 calling for price come down further.
Buying small position here and doubling if price reaches $330 area.
Price at or near bottom channels (period 100 52 39 & 26)
Stochastic Momentum Index (SMI) at oversold level
VBSM is negative
Price at or near 2.618 Fibonacci level (from 2HR chart)
Target is $100 or channel top bottom
Stop loss is $353 area

$ULTA - What do you think?NASDAQ:ULTA presents a better risk/reward. It has now closed the gap and is starting to be oversold.
There is a risk that it might drop to the $312 to $300 area.
Knowing that, would you bet on it through ER?
As always, I share my opinions and trades. I'm not suggesting that anyone follow my trades. You do you.

ULTA Screaming AccumulationA classic inverse H&S setup on ULTA here. Buffet buying and taking a stake a few weeks/month back makes me even more convinced. This will just take time. The large wicks are indicating that buyers are stepping in and absorbing selling demand from a weekly perspective. The buyers come and save the week. They're going to form this perfect right shoulder and it should launch - might take 6 months or so... NASDAQ:ULTA

ULTA is beauty indeed I was bearish based on the technicals but after Buffet got a stake in this , it took a U-turn .
The chart is primed for a run now.
Long anywhere here.
Target 1 - 400
Target 2 - 480
Target 3 - 520
Stop loss - 330

ULTA Option CallTaking Ulta on a debit spread 392.5 - 395.0 Expiration date 12/6
-Daily chart had a break and re/test of an ascending triangle testing the daily 50ema and Fib levels.
-Lower time frames were also in an ascending triangle and I took the trade at the bottom of the trend line paying the break out.
-More so playing the patterns here, price is not really trending but there are indications price can be moving up rather than down.
