Amd - Here comes the massive reversal!🩻Amd ( NASDAQ:AMD ) is starting to reverse:
🔎Analysis summary:
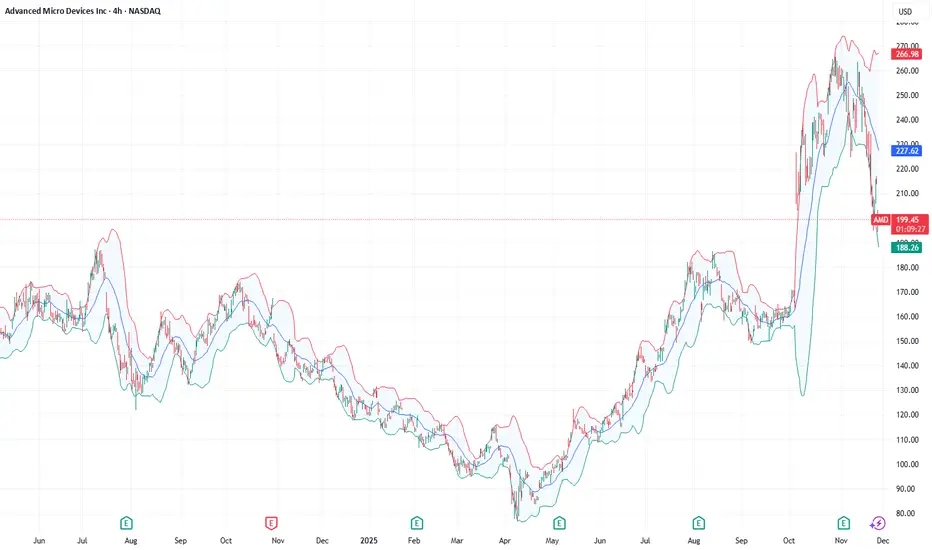
Starting back in mid 2025, Amd retested a major confluence of support and rallied about +200%. All of this was expected and the rally ended with a retest of a significant trendline. Eventually, after some back and forth, Amd will then create a short term retracement.
📝Levels to watch:
$250
SwingTraderPhil
SwingTrading.Simplified. | Investing.Simplified. | #LONGTERMVISION
Advanced Micro Devices, Inc.
No trades
Trade ideas

AMD Alert: Bullish Reversal Opportunity Amid Sector DipAMD QuantSignals V3 Swing 2025-11-25
Ticker: AMD
Signal Type: Swing Options Setup (Expiry: 2025‑12‑12)
Direction: BUY CALLS
Confidence: 68% (Medium conviction)
Strike Focus: $210.00
Entry Range: ~$13.12
Target 1: ~$18.75
Target 2: ~$22.50
Stop Loss: ~$8.75
Horizon: 17 days
1W Move: -2.93%
2W Move: -6.86%
Volume vs Prior Swing: 1.7×
Swing Range: $194.28 – $217.13
Risk Level: Moderate-High — due to volatility
🧠 Key Technical & Chart Insights
Support/Resistance:
Support at $194.28
Resistance at $256.27
Oversold Condition: AMD down ~18.84% intraday, trading 9.4% below VWAP ($222.16), signaling potential mean reversion.
Momentum: Indicators show extreme bearish exhaustion; RSI likely in oversold territory.
Candlestick Patterns: No specific reversal patterns detected yet.
Trend Context: Overall sector bearish (SPY/QQQ moderately bearish), creating a contrarian swing opportunity for AMD.
📰 News & Market Context
News Sentiment: Mixed but leaning constructive
White House AI initiative (“Genesis Mission”) = long-term tailwind
Google-Meta deal concerns = short-term pressure
Options Flow: Bullish bias with PCR 0.54 and max volume at $350 call, signaling institutional optimism.
🎯 Trade Rationale
Entry Advantage: Stock at maximum fear phase after sharp single-session decline.
Timing: 17-day horizon aligns with Katy AI’s predicted 14–21 day recovery window.
Risk/Reward: Entry at $210 provides buffer below current price, 50–80% potential upside.
Position Size: Suggested 2.5% of portfolio, considering elevated volatility (VIX 20.19).
⚠️ Key Risks
Semiconductor sector sentiment may shift negatively.
High single-day volatility — stop loss adherence is critical.
Trade dependent on Katy AI’s predicted recovery timeline; monitor daily momentum and news catalysts.

Tech giants and a crypto exchange under pressure!Recently, the stocks of Advanced Micro Devices (#AMD), Coinbase Global Inc. (#Coinbase), Oracle Corp. (#Oracle), NVIDIA Corp. (#NVIDIA), and Arm Holdings plc (#Arm) have come under pressure amid a reassessment of artificial intelligence (AI) valuations and growing caution toward risk assets. Investors are reacting nervously to the cost of capital, the pace of AI monetization, and the resilience of demand within adjacent ecosystems.
5 Factors Behind the Decline:
#AMD (−10.33%) — profit-taking after a strong rally and growing doubts about the scalability of server GPUs. Additional pressure comes from margin risks driven by aggressive capital spending and competition in high-performance GPU accelerators.
#Coinbase (−10.31%) — a weakening crypto market reduces trading volumes and fee revenue. Regulatory risks and volatile client flows deepen the valuation discounts.
#Oracle (−10.29%) — concerns over rising debt levels amid heavy investments in cloud and AI infrastructure. The market fears shrinking free cash flow and pressure on valuation multiples if growth slows.
#NVIDIA (−4.08%) — “overvaluation + maxed-out expectations”: even strong earnings reports fail to calm concerns about cyclical demand in data centers. Added to this are risks of margin normalization and potential inventory build-ups among customers.
#Arm (−3.02%) — high sensitivity to sell-offs in the “AI sector,” especially given its premium valuation. Investors question how quickly the royalty-based model can translate into stable accelerated growth.
If concerns about AI-related spending and uncertainty around interest rates persist, stocks inflated by AI and crypto market expectations may continue to fall. Further capital outflows or rising borrowing costs would serve as triggers for additional downside.
FreshForex analysts see potential for a correction in #AMD, #NVIDIA, #Arm, #Oracle, and #Coinbase due to slowing AI infrastructure growth and persistently high capital costs. For #Coinbase , elevated crypto market volatility is an additional pressure factor. The current market situation creates conditions for developing scenarios for asset price declines.
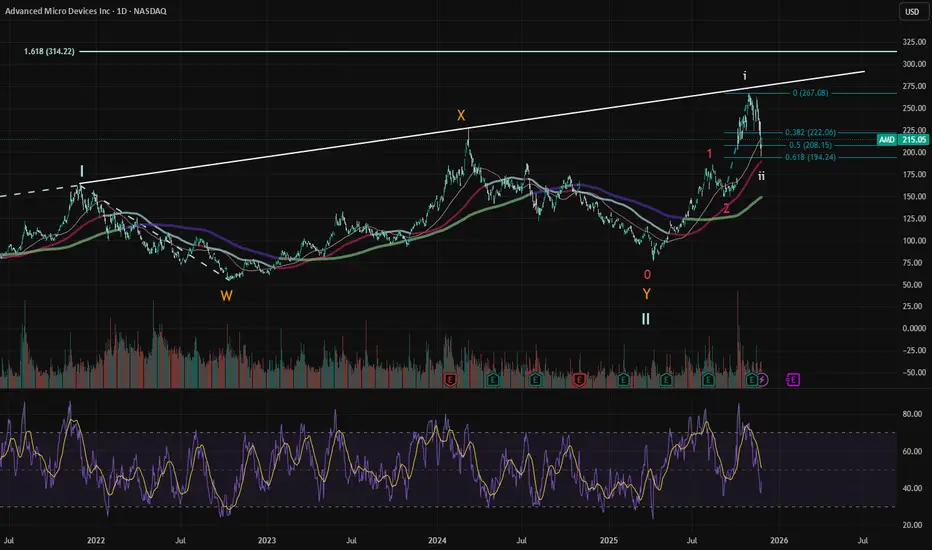
$AMD: Wave iii about to startNASDAQ:AMD was in a huge WXY correction since 2021 high until April 2025 low. I count it as 1-2, i, ii of 3.
Wave ii corrected 61.8% of wave i. Wave 2 didn't go deeper due to the OpenAI announcement, which started Wave i of 3.
Since we're now have seen a 3-wave up, it is possible that it is a zigzag for XX as opposed to Waves 1-2, i, ii of 3. However, I assign the alternate count a smaller probability.
Many tech stocks are about to finish or have already finished a wave 2 correction so this can be the same for $AMD.
Bears will try to push it down to fill the gap. If that happens, I plan to add to my long-term position.
Amd Gap Trade IdeaHello TradingView Community!
Hope everyone is doing great and navigating this market with confidence. Sharing a fresh technical observation on AMD, which is now approaching a very interesting zone. Let’s dive into the detail.
🔹AMD – Critical Technical Crossroad as Price Sits Inside the Gap Zone--::
AMD is currently trading inside a major gap zone, an area that previously attracted strong institutional buying. With the price now resting near the $204 support, the stock has moved into a region where market psychology and liquidity dynamics tend to play a decisive role. This zone often dictates whether buyers regain control or whether sellers extend their dominance.
A clear Lower-Highs trendline has formed above the current price, signaling that sellers are stepping in at progressively lower levels. Another touch on this descending trendline would further validate it as a strong resistance a level that could shape AMD’s next directional move in the short term.
🔹Why This Zone Matters--::
Gaps are areas of low liquidity, and once breached, the price often travels quickly through them. AMD is sitting right inside such a pocket, making this structure highly reactive.
Recent volume expansion on the decline shows that market participants are actively positioning ahead of a potential breakout or breakdown.
If the gap fails to hold, the next major downside magnet lies around the $151 base support, a historically strong demand area that absorbed selling pressure in the past.
These technical elements combined make this a highly sensitive and high-impact region for the stock.
🔹Bullish Setup--::
If buyers successfully defend the $204 zone and regain momentum, AMD may bounce toward the descending trendline. A strong breakout above that trendline would shift short-term sentiment toward the bulls and potentially invite fresh momentum trades targeting higher levels.
🔹Bearish Setup--::
A sustained breakdown below the gap zone would expose the stock to deeper downside toward the $151 support. This level is likely to act as a stronger reaction point where long-term buyers could step back in.
🔹Conclusion--::
AMD is at a critical decision point where both bulls and bears are preparing for the next big move. The combination of a major gap, a tightening trendline, and expanding volume makes this setup especially important to monitor.
The next few sessions could reveal a volatile and directional move, and traders who stay alert to these key levels will have the upper hand.
Regards- Amit.

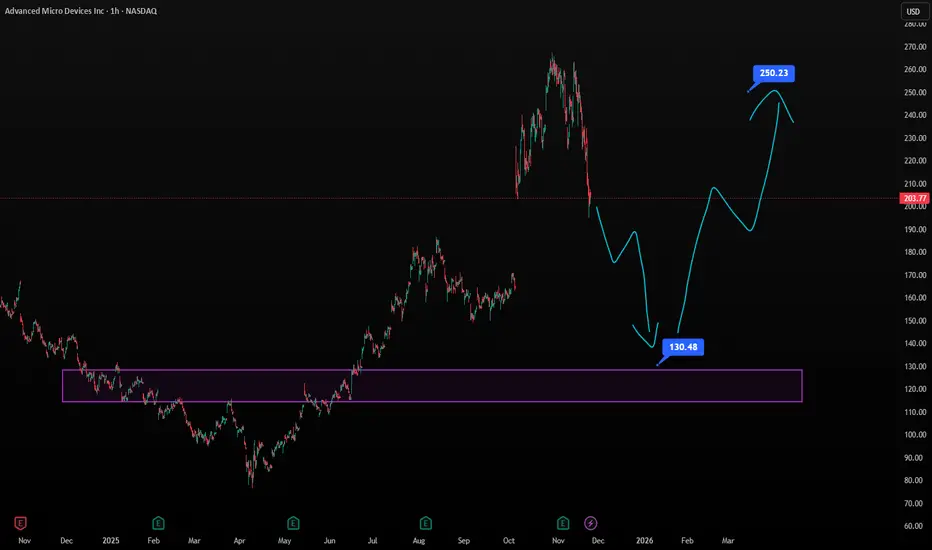
Midterm Stock Forecast for AMDNASDAQ:AMD at $203 shows signs of topping, with H1 momentum rolling over. A decline toward $130 is expected as the market digests high valuations and competitive pressure in AI chips. The $130 zone offers an attractive buy level, with a long-term upside target of $250 once trend reverses.
AMD Under Watch ⇌ Sellers Strengthening at Major Supply Zones🔥📉 AMD “ADVANCED MICRO DEVICES INC.” – Bearish Profit Playbook | Thief Layers Deployed 🚨
Hey traders! 😎🔍
Here’s my bearish swing/day-trade playbook on AMD, crafted with a fun + professional thief-style twist while staying within TradingView rules. Let’s break it down 👇💼
📉 Plan: Bearish Outlook Active
Price action remains heavy, momentum cooling off, and sellers showing presence near key zones.
Thief Squad preparing for controlled entries 😎🧤.
🎯 Entry Plan (Thief Layering Strategy)
This setup uses a layered limit-style approach — also known as multiple staggered entries to smooth positions.
📌 Proposed Sell-Limit Layers:
230
220
210
(You can extend layers based on your own system — thief flexibility ALWAYS 😎)
⚠️ Note: These are example layers for illustration, not fixed instructions. Adjust based on your own risk model.
🛑 Stop-Loss (Thief Safety Net)
SL Zone: 240
Dear Ladies & Gentlemen (Thief OG’s) 💼🕶️
This SL is simply my reference point — NOT a rule.
You decide your own SL based on your risk appetite, not mine.
Make money? Then take money… at your OWN risk 💰😄.
🎯 Target Zone
Price has a strong support cluster aligning with:
Moving Averaging acting as dynamic support
Oversold zone building
Trap mechanics likely
So the quick escape target is:
👉 TP: 180
Dear Ladies & Gentlemen (Thief OG’s) 💼😄
My TP is not mandatory — adjust yours as you wish.
Take your profits and leave before the “police” catches our position 🚓💨😆.
🔗 Related Pairs to Watch (Correlation Insights)
These assets often move with similar sentiment due to tech-sector correlation, semiconductor supply chain, and risk-on/off flows:
💻 NVDA (NVIDIA)
Strong semiconductor leader — AMD often shadows NVDA’s volatility and sector direction.
📱 QQQ (NASDAQ 100 ETF)
AMD is inside the NASDAQ index. When QQQ sells off, AMD typically follows the broader tech flow.
🌐 SMH (Semiconductor ETF)
Tracks the entire chip sector. Helps understand overall industry strength or weakness.
⚡ TSLA (Tesla)
Not directly connected, but both ride similar high-beta risk cycles. Weak tech sentiment can drag TSLA and AMD simultaneously.
Watching these helps confirm momentum, risk appetite, and sector-wide signals 📊🔍.
🧠 Additional Notes
This setup is for educational, fun, strategy-style illustration purposes.
NOT forcing a fixed entry, SL, or TP on anyone.
Trade smart. Manage risk. Thief style = creativity + discipline ✨😎
✨ “If you find value in my analysis, a 👍 and 🚀 boost is much appreciated — it helps me share more setups with the community!”

AMD - Algorithmic Money DistributionIf you are an investor who only cares about AMDs business, fundamentals and growth and have no idea of technical analysis, this stock drives you crazy.
The fluctuations (+200$ in 6 months) have nothing to do with the underlying business. It is just algorithmic trading on steroids.
I believe the alorithms have finally reached their target on October 28th and AMD will retrace with the entire US stock market. 267$ might never be seen again.
A gap close to the 0.618 retracement at 165$ before Christmas would not surprise me at all.
This might even retrace to the 0.382 at 100$ in early 2027. Only time will tell.

AMD – Breaking Down or Setting Up a Dead-Cat Bounce? Nov. 21
1-Hour Outlook (Main Bias)
AMD continues its multi-day downtrend and is now sitting near the bottom of the descending channel you marked. The structure is clearly bearish on the 1H, with every bounce getting sold off.
1H Structure
* Clean downtrend with lower highs and lower lows.
* Recent drop created another BOS to the downside, confirming continuation.
* Price is now sitting around 205–206, the first minor reaction zone after the liquidity sweep.
* EMAs are stacked bearish, with price trading below all short-term EMAs and below VWAP.
* Momentum (MACD) is still bearish, though slowing — suggesting a potential short-term bounce, not a reversal.
1H Key Levels
Resistance:
* 223–225: Major sell zone
* 237: Upper-mid channel resistance
* 263.69: High-timeframe rejection line (unlikely to be tested soon)
Support:
* 206: Immediate demand but weak
* 202.5–203: Stronger support from the 1H base
* 200: Psychological and liquidity pool
Bears gain control (continuation): Below 202.50
Bulls gain control (reversal): Only above 223
1H Trading Idea
Bullish (countertrend) bounce setup:
Only valid if price holds 205–206 and forms a strong engulfing candle.
* Targets: 210 → 213 → 218
* Stop: Below 202.5
Bearish (trend continuation):
If AMD rejects anywhere between 210–215, sellers regain momentum quickly.
* Targets: 205 → 202.5 → 200
Reversal only becomes real above 223, which is currently far.
15-Minute Outlook (Execution Timeframe)
The 15M chart shows exhaustion from the selloff but no structural reversal yet.
15M Structure
* Liquidity sweep → CHoCH → small BOS to the upside, but still below bearish EMAs.
* 15M EMAs remain bearish — price is retesting the underside of EMA zone.
* The FVG retest around 210–212 is the first real supply zone.
15M Trading Setups
Bullish scalp (countertrend):
* Entry Zone: 205.5–206
* Trigger: Strong rejection wick or engulfing candle
* Targets: 209 → 212
* Stop: Below 203
Bearish continuation (cleanest setup):
* Entry Zone: 210–213 (FVG + supply cluster)
* Trigger: Lower-timeframe rejection
* Targets: 205 → 202.5 → 200
* Stop: Above 215
Breakout entry for bulls:
* Only if price reclaims 215, closes above it, and holds.
* Target: 218–223
GEX Confirmation
From the 1H GEX chart:
Bearish Signals
* Massive put support between 205–210 — market makers defend downside.
* Heavy negative NETGEX stacked from 210–215, making rallies difficult.
* Highest negative GEX sits around 208–210, aligning with your supply zone.
* Multiple PUT walls at:
* 213
* 208
* 202
This confirms why AMD keeps failing at intraday rallies.
Bullish Signals
* Only notable positive GEX appears above 230, far away from current price.
Interpretation
* The options market is heavily positioned for bearish drift.
* Countertrend scalps are possible, but structure, EMAs, and GEX all align bearish.
* A bounce can happen, but only within the downtrend.
Options Trading Plan (GEX-Based)
Bearish Plan (primary)
If AMD rejects 210–213:
* Contracts:
* 210P
* 205P
* Targets:
* 205 → 202.5 → 200
* Reason: Strong supply, negative GEX, bearish structure.
Bullish Plan (countertrend only)
If AMD defends 205–206 with force:
* Contracts:
* 210C
* 215C
* Targets:
* 210 → 213 → 218
* Reason: Short-term bounce from channel bottom plus slowing momentum.
Final Bias for Nov. 21
AMD remains in a clear bearish trend, with only short-term bounce potential.
The cleanest setups remain bearish continuation, especially if price tests 210–213 and fails.
Reversal isn't confirmed unless AMD closes above 223.
Disclaimer
This analysis is for educational purposes only and not financial advice. Always perform independent research and manage risk appropriately.

Breaking; Advanced Micro Devices, Inc. (AMD) Is Up 7%The price of Advanced Micro Devices, Inc. (AMD) spike 7% in early market trading on Thursday as the stock broke from a bullish flag pattern.
In another news that served as a catalyst, AMD, Cisco and HUMAIN to invest in a joint venture and serve as its exclusive technology partners, deepening their multi-year strategic collaboration announced in May during U.S. President Donald J. Trump's visit to the Kingdom of Saudi Arabia.
The joint venture plans to deploy up to 1 GW of AI infrastructure by 2030, with the shared ambition to expand capacity to multiple gigawatts, as a key pillar of HUMAIN's overall ambitions.
With the RSI at 44, the stock is more than able to break through highs and claim the $300 resistance.
Financial Performance
In 2024, Advanced Micro Devices's revenue was $25.79 billion, an increase of 13.69% compared to the previous year's $22.68 billion. Earnings were $1.64 billion, an increase of 92.15%.
About AMD
Advanced Micro Devices, Inc. operates as a semiconductor company worldwide. It operates in three segments: Data Center, Client and Gaming, and Embedded. The company offers artificial intelligence (AI) accelerators, x86 microprocessors, and graphics processing units (GPUs) as standalone devices or as incorporated into accelerated processing units, chipsets, and data center and professional GPUs; and embedded processors and semi-custom system-on-chip (SoC) products.

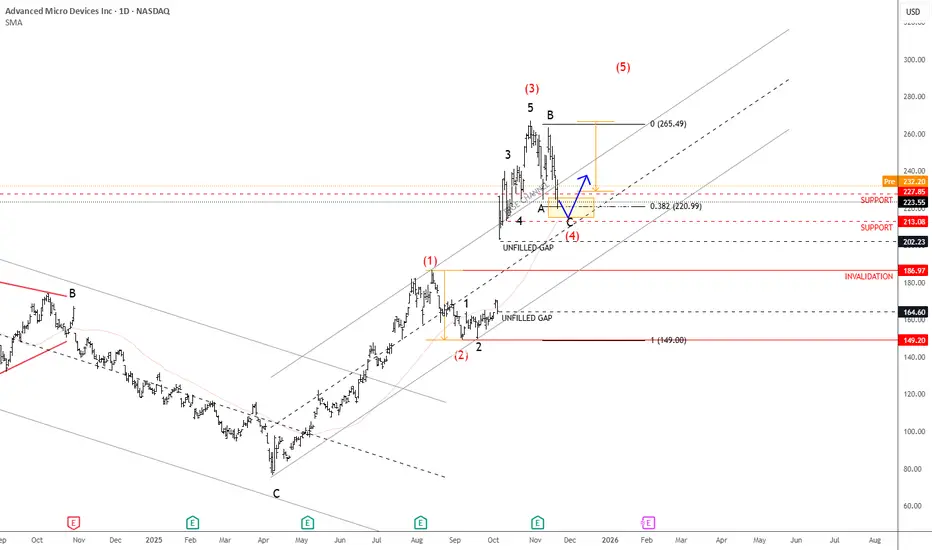
AMD Is Approaching Support, While Finishing A CorrectionAMD is in a very strong uptrend, supported by the impressive rally since early October when it gapped higher on positive AI news. Since then, the stock has gained more than 50%, and this bullish momentum could continue after a retracement, especially considering latest company’s better-than-expected earnings report.
But based in latest price action, we assume that the market is now in a corrective pullback before resuming higher, ideally forming wave four within a broader five-wave sequence. The previous high around 220 could act as the first key support, followed by the 200 area, which also aligns with upper range of unfilled gap. So if we are correct, then later this month or early in December, the market can once again stabilize and turn up for a new high, while the price is above 187 invalidation level.
Highlights:
Trend: Strong uptrend, wave four correction in view
Support: 220 / 200 zone
Invalidation: Below 186
Note: Wait for a pullback to complete before considering new long opportunities
AMD 6 months AMD 6 months timeframe
Close above 227.30 $ on 31/ December 2025
this stock is expected to continue positive performance ↗️ uptrend
Good luck 4all

Amd - Here comes the major reversal!👺Amd ( NASDAQ:AMD ) is reversing right now:
🔎Analysis summary:
Over the course of the past couple of months, we witnessed a very expected rally on Amd of about +250%. But right now, Amd is retesting a major resistance trendline. If we actually see bearish confirmation in the near future, the next bearmarket will start quite soon.
📝Levels to watch:
$250
SwingTraderPhil
SwingTrading.Simplified. | Investing.Simplified. | #LONGTERMVISION

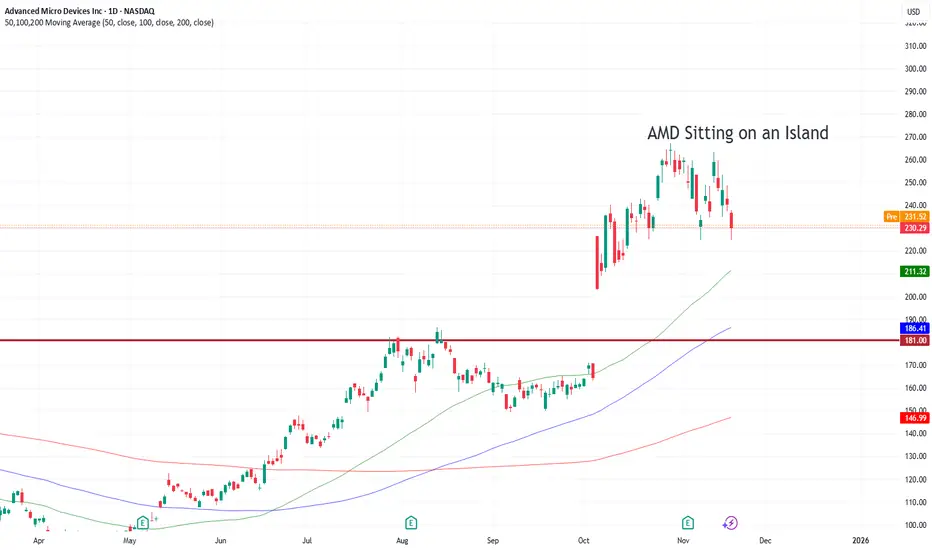
AMD Sitting on an IslandAMD CEO gave some optimistic forecasts a few days ago that helped the stock gap up, but the optimism has faded and the stock has given back all of the gains. It's still sitting on an island with a huge gap to fill to get to previous support levels.
$AMD - $235 needs to hold or more downsideAMD - Stock testing bottom of the channel on the dialy. high watch here if $235 fails for a move towards $220 and $200. Stock is decent at the indicator level. Stock has a big gap below $202.

AMD Breakout on the dailyAdvanced Micro Devices NASDAQ:AMD Price just broke out of a clean falling channel. This breakout didn’t happen in isolation, it happened inside a well-defined ascending channel that has carried the entire trend since early summer.
The next major test is the upper channel resistance near 280. That level is where momentum, structure, and trend all meet.

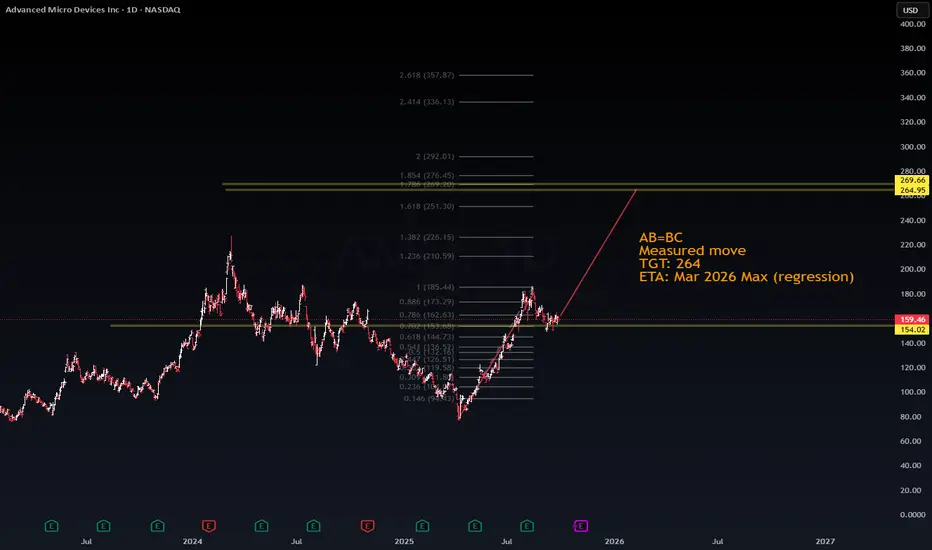
$AMD – AB=BC Measured Move ProjectionNASDAQ:AMD – AB=BC Measured Move Projection
Current Price: $159.46
Setup: AB=BC symmetry with regression channel alignment
Target: $264
ETA: March 2026 (based on regression max)
Confluence: 1.618–1.854 Fib extension zone
🧛 Vampiric Setup Context
Market drained liquidity below retail stops → displacement → breaker retest → liquidity reclaimed. The setup favors upside continuation once supply is absorbed.
🔑 Bias: Bullish toward $264 with mid-term accumulation and institutional flow alignment.
#AMD #Stocks #TechnicalAnalysis #VolanX #Liquidity
Retesting the Breakout — AMD at a Critical Decision PointAMD surged strongly from around $140 to nearly $275, and it’s now pulling back toward a key support zone around $230–$235, which was the previous breakout level. The 50-day SMA (around $199) is trending upward, providing dynamic support below.
Short-Term View (1–3 weeks):
• Holding above $230 would keep the bullish structure intact.
• Short-term target: $255–$265
• Stop-loss: below $225
Long-Term View (2–6 months):
• A confirmed rebound and breakout above $275 could extend the uptrend toward $300 or higher.
• A breakdown below $230, however, may trigger a correction toward $200–$185.
Summary:
AMD is at a decisive support level. If buyers defend the $230 zone, a new rally could form; otherwise, a deeper pullback is likely before the next leg up.
$AMD: reaction to weekly trendline resistanceNASDAQ:AMD has a weekly chart trendline resistance above. Additionally, AB=CD also indicated a target was hit. Stock pulled back. Counting from the prior low, NASDAQ:AMD pulled back not quite 38.2%. I think the 38.2% retracement got front-run, showing strength.
38.2% retracement is quite typical of Wave 2 pullback. This area is a good price to enter long.
I hold long term shares of NASDAQ:AMD and added to my holdings on Friday 11/7.

AMD near term bearsihAMD has just tested the top of the LRC (Linder Regression channel) and has dropped after the earnings. Over the last several months, this is the first time it has hit the top of the LRC. With earnings already out, there are no market forces to push the stock higher. This has also broken down the LR line. I would expect the price to hover around 216 over the next two months.

AMD AMD technical information.
the rejection on the supply roof of the weekly ascending trendline could lead to strong correction and take profit after the massive bubble rally into 202.76 and my target is the 50% of the Fibonacci level which is around 150.20-149.879
AMD FUNDAMENTAL
AMD and OpenAI finalized a landmark multi-year agreement for OpenAI to deploy up to 6 gigawatts (GW) of AMD GPUs, starting with an initial 1 GW rollout of the AMD Instinct MI450 series in the second half of 2026. This partnership is significant for AMD’s growth in the AI semiconductor market and has several advantages:
Key Advantages of the AMD-OpenAI Deal:
Massive Scale Deployment: The 6 GW commitment positions AMD as a core AI hardware provider for OpenAI’s next-generation AI infrastructure, significantly expanding its presence in high-performance computing for AI workloads.
Multi-Generational Collaboration: The deal builds on prior cooperation with OpenAI using MI300X and MI350X GPUs, deepening AMD’s involvement over multiple future AI hardware generations.
Financial Incentives: OpenAI holds warrants to buy up to a 10% stake in AMD stock tied to deployment milestones, aligning financial interests and incentivizing long-term collaboration.
Strategic Market Credibility: Partnering with a leading AI research organization like OpenAI validates AMD’s technology and competitive positioning against rivals like NVIDIA in the generative AI chip market, which is forecasted to exceed $150 billion in value.
Revenue Growth Catalyst: This deal could generate tens of billions in AI revenue over time, fueling AMD’s expansion into the rapidly growing AI data center sector.
Ecosystem Synergy: OpenAI’s use of AMD hardware fosters optimized AI model development on AMD platforms, improving software-hardware integration and performance.
AMD’s Q3 2025 revenue hit a record $9.2 billion, up 36% YoY, exceeding expectations.
Strong sequential growth is expected in Q4 2025, with guidance around $9.6 billion driven by AI data center GPUs (MI350 series) and Ryzen client processors.
The company foresees its AI data center business scaling to tens of billions in annual revenue by 2027 as adoption expands among hyperscalers, sovereign AI programs, and cloud providers.
Key product launches on the horizon include the MI400 GPU family and next-generation EPYC server CPUs.
AMD also emphasizes broadening its AI software ecosystem with ROCm 7 and partnerships with OpenAI and others.
Business Model:
AMD designs and sells high-performance microprocessors (CPUs), graphics processing units (GPUs), and adaptive computing chips, often licensing IP to OEMs and cloud providers.
Key revenue drivers are client (PCs and gaming consoles), enterprise/data center (servers, AI accelerators), and embedded markets.
The company leverages R&D for cutting-edge chips optimized for AI, cloud, gaming, and edge applications.
AMD works closely with partners and customers to integrate hardware and software solutions (e.g., AI ecosystems, accelerated computing).
Recent Acquisitions to Fuel Growth:
Xilinx (2022, $49 billion): Expanded AMD’s portfolio into FPGAs, adaptive computing for telecom, automotive, cloud data centers, and industrial use cases.
Post-acquisition, AMD integrated Xilinx’s AI engine technology into its Ryzen AI and planned EPYC CPU lines.
Other smaller acquisitions include teams and tech from ZT Systems, Brium, Lamini, which bolster AI hardware and software capabilities.
AMD's MI300X and M1450X GPUs are considered better than NVIDIA's H100 in several key areas, especially for AI workloads:
Why MI300X and M1450X are Better:
Memory Bandwidth and Capacity:
The MI300X offers about 60% more memory bandwidth (5.3 TB/s) and more than double the memory capacity (192 GB HBM3) compared to NVIDIA’s H100 (80 GB HBM2e with 3.35 TB/s bandwidth). This higher bandwidth and capacity enable better handling of large AI models and data sets.
Compute Performance:
MI300X achieves peak FP16 performance of approximately 1.31 petaflops, outperforming H100's 0.99 petaflops. Benchmarks show the MI300X can deliver up to 5x faster instruction throughput and consistently 40%-60% better performance on AI inference latency with large models like LLaMA2-70B.
Caching Architecture:
AMD's CDNA 3 architecture in MI300X includes a massive Infinity Cache (256MB L3 cache), providing 3.5x greater bandwidth in L2 caching and 1.6x in L1 compared to H100. This improves efficiency in data access during computations.
Scalability and Multi-GPU Performance:
Early tests indicate the MI300X scales better in multi-GPU deployments, offering up to 60% higher peak system output throughput over NVIDIA setups.
Software Ecosystem Growth:
AMD’s ROCm software platform and AI optimization tools are rapidly maturing, improving real-world application performance for MI300X series GPUs.
Caveats:
NVIDIA's H100 has lower memory latency (57% less), which can benefit some workloads.
H100 maintains advantages in some specific tensor operations and smaller batch sizes.
NVIDIA’s ecosystem and software optimizations (including updates) remain strong competitive factors.
Summary
AMD's MI300X and M1450X excel over NVIDIA H100 mainly due to higher memory bandwidth and capacity, superior caching, and stronger compute throughput in large AI workload benchmarks. This makes them highly competitive leaders in AI data center GPUs, especially for large model
Strategic acquisitions like Xilinx broaden product offerings and accelerate AI ecosystem development, positioning AMD as a major AI and adaptive computing player.
#AMD #STOCKS

Elliott Wave Flags More Gains for AMDAdvanced Micro Devices (AMD) recently achieved an all-time high within an impulsive sequence that remains incomplete. The rally from the April 2025 low has thus far unfolded in only three waves. This implies that further upside potential is likely. In the near term, the cycle originating from the October 11 low continues to progress in the form of a diagonal structure.
From the October 11 pivot, wave 1 concluded at $242.88, followed by a corrective wave 2 that ended at $224.85, as illustrated in the accompanying 30-minute chart. The stock subsequently advanced in wave 3, which subdivided into a clear impulsive pattern. Within this leg, wave ((i)) peaked at $232.30, and wave ((ii)) retraced to $227.25. Wave ((iii)) extended to $264.58, followed by a modest pullback in wave ((iv)) to $257. The final thrust in wave ((v)) reached $272, thereby completing wave 3 of a higher degree.
Wave 4 unfolded as a double three Elliott Wave structure. From the wave 3 peak, wave ((w)) declined to $252.31, wave ((x)) rebounded to $262.13, and wave ((y)) completed the correction at $235.50. Provided the $224.85 pivot remains intact, the stock is expected to resume its ascent in wave 5. The projected target for wave 5 lies between $280.50 and $294.40, corresponding to the 123.6%–161.8% inverse retracement of wave 4.

AMD Trade Setup | AI Leadership + Strong Earnings MomentumAdvanced Micro Devices NASDAQ:AMD remains a key name in the ongoing AI and semiconductor rally. Just ahead of earnings, AMD announced a $1B partnership with the U.S. Department of Energy (DOE) (Oct. 27), a major validation of its role in high-performance computing. This bullish development set the stage for strong momentum into the earnings release.
🚀 Earnings Recap:
AMD delivered a solid Q3 report with 36% YoY revenue growth, margin expansion, and upbeat guidance. The Client and Data Center segments led the charge, while Embedded was softer. With macro support for semiconductors and increasing AI investment, market sentiment remains bullish.
🔧 Trade Plan:
Entry: $224
Take Profit 1: $248
Take Profit 2: $267
Stop Loss: $211
