Citigroup showing signs of multi-month improvementMulti-month recovery from USD34.52 February lows gaining traction as prices accelerate higher to pressure critical resistance at the USD60.95 range high of July 2015.
In much the same vein as AIG, Citigroup is slowly recovering ground lost during the 2007-2008 mortgage crisis. investor sentiment and momentum studies are slowly improving, suggesting further gains in the coming months.
Next significant resistance is at the USD75.85 year high of January 2009.
Citigroup is also showing signs of Outperformance relative to the strengthening US Financials Index.
TRVC trade ideas


Long Term Turnaround?We are leaving a sideward range behind. It has been left 2013 already is moving slowly upward since, however it still lokks like sideward. But this seems so ony due to the downward correction since July 2015. The correction has finished in March and now we are within an interim upward trend. Because of the correction was within a slight stepping up we may see new highs soon.

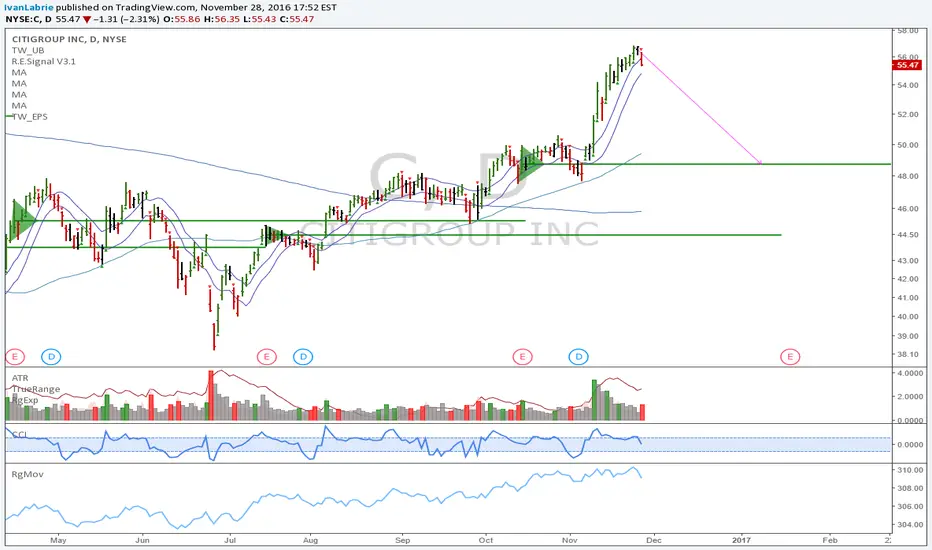
C: Systemic risk, extremely overboughtCitigroup shares might be poised for a retracement here, we can expect a selloff to take place, if we don't move back above 56.78. I'd reccomend either shorting it, or buying puts. You can buy out of the money puts and sell bear put spreads to reduce costs (vs buying at the money puts).
Good luck,
Ivan Labrie.
Great Near Term Short for Citi GroupRSI is starting to go through the roof, and Williams VixFix is significantly weakening. Almost everytime this has happened since early last year, it pullsback.


Trending upAt least in the daily chart we have an uptrend. The weekly is still bearish, however the indicators support an upward correction there as well.

C Daily Chart.Long View , Bearish Gartley Price can shoot up to the resistance level , where Gartley completes , a reversal to the major fib points , and and pull up to continue the uptrend.


CITI BANK BARELY SURVIVING AFTER 2008CITI BANK IS ALSO A SHORT CANDIDATE FOR BANKRUPTCY. DON'T KEEPA NY HOPE AND IF YOU ARE BANKING WITH THEM CLOSE THE ACCOUNTS.

C is setting up for short..Here is as simple as it gets...Sell on break of trendline. The resistance level is holding so far. I am going through my list and there are a lot of setups out there right now.

Bear credit spreadBeing cheap doesn't make it good
First call strike (shorting) @ 49, September 16 expiration.

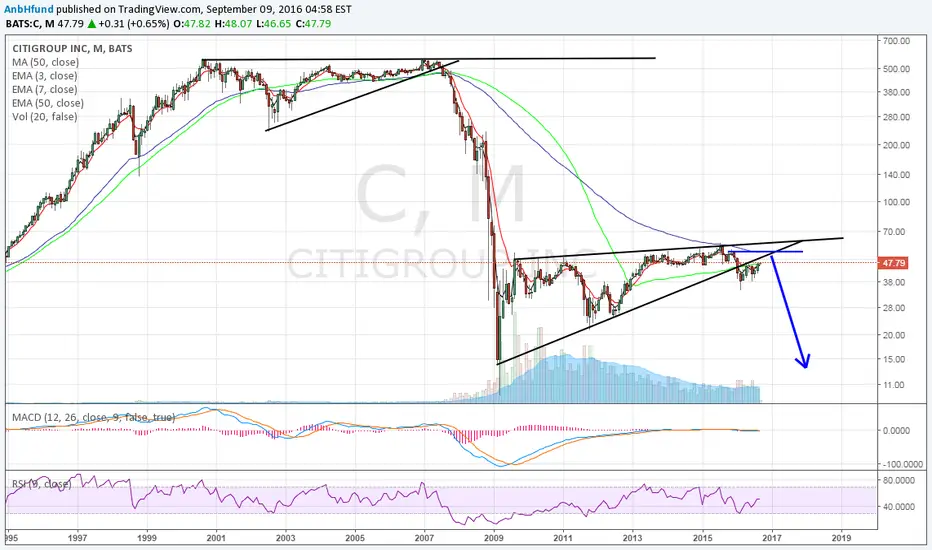
Citi : Short -- 2008 is coming back Short Entry between -- 50 - 55
Stop Loss -- 60
Target -- Last Low - 10 - 14
In 2008 Fed stood up Who's gonna be this time !!
Resistance passedThis is the third attempt to surpasse the major resistance at 45. Perhaps we will succed now that the overall bias of the stocks' market is bullish.

C - Trade updateWe entered a long position on a break and retest of the long term descending trend line with an initial target of 50.
Still in this position with the same target.


Citigroup - weekly repair of early 2016 drop.Just a specualtive idea : but looking at Bank stocks like Citigroup - it looks like many institutional investors were surprised by the sudden drop very early this year. Thus they might take this window of opportunity to drive price back up to at least the previous breakdown level ( just to get breakeven ). Therefore, a rise in Citigroup to approx. 50.00 USD area wouldn`t surprise me. Bullish with tight stops.


