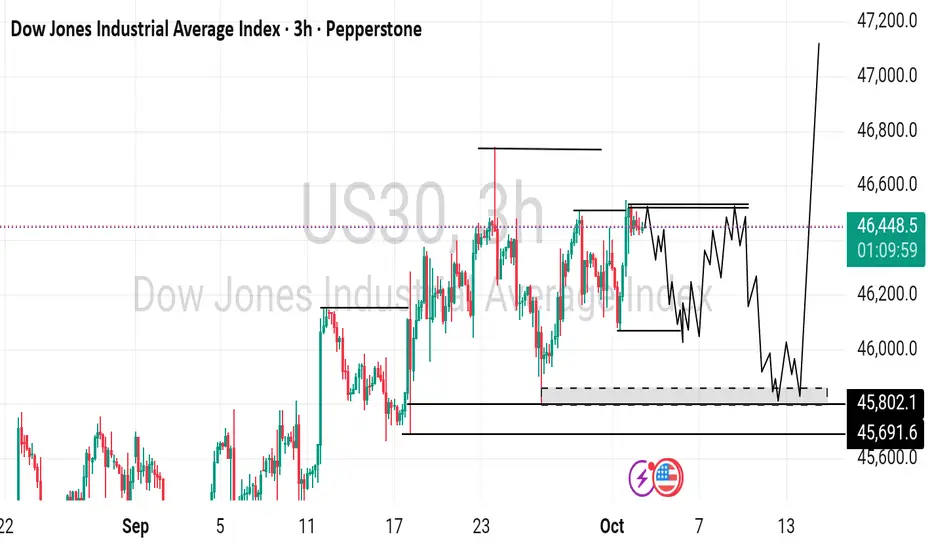
US30 - High Volume Control & Liquidity🚨My personal view:
➡️The Low Season/3rd Quarter is behind us.
➡️Liquidity is crucial for fresh acceleration in the High Season/Last quarter.
------------------------------------------------------------------------------------------------------------
🎯 KEY PIVOT
📍 Zone Type: DEMAND
📊 Price Range: 46,200-46,400
📏 Distance: 569 points below current price with strong support history
📊 MAIN BIAS
🔵 Bias: BULLISH
📌 Context: Strong uptrend near all-time highs
💎 DIAMOND EDGE - Primary Setup
🎲 Direction: Long from current levels targeting 47,000-47,100
🔍 Confirmations:
✅Bullish momentum continuation above 46,700
✅Bullish momentum continuation above KEY PIVOT @ 46,200-46,400
✅Break above 47,000 with strong volume
⚠️ NOTE:
✅Price 231 points from resistance. Watch for rejection at 47,000-47,100.
🎯 Bullish Extension Targets - Discovery
T1: 47,200
T2: 47,500
-------------------------------------------------------------------------------------------------------------
🔄 BIAS FLIP SETUP- BEARISH🔴
💡 46,100-46,400 critical support - break changes structure.
⚡ Triggers:
➡️Multiple Rejection @ 47,000-47,100 Confirming Resistance as Supply Zone.
➡️Then Clear and decisive break below 46,200
🎲 Direction: Short from 46,100
🔍 Confirmations:
🟧Bearish rejection wicks at 47,000-47,100
🟧Break and close below 46,200
🎯 Targets:
T1: 45,600 - 45,800 ➡️➡️LIQUIDITY
T2: 45,200-45,400
T3: 44,600-44,800
⚠️ SESSION RULES
❌Avoid chasing between levels.
✅Use your 50% markers as targets in-between key high-volume areas.
🕐 Trade only NYSE - US session (9:30am-4pm EST)
📰 Monitor Fed policy, economic data
Trade ideas
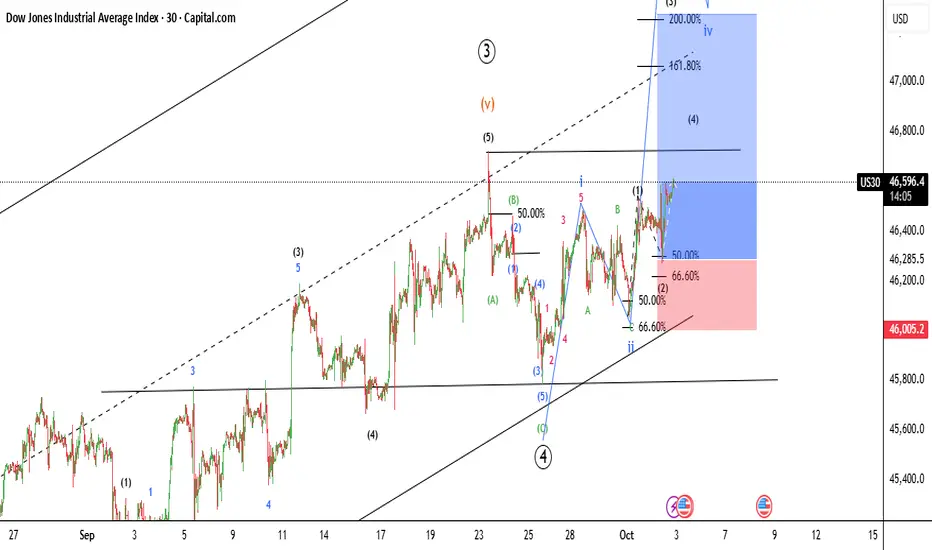
Wyckoff Distribution schematicsThis count is based on my assumptions so anything can happen not a trading or financial advice just for educational purposes only kindly do your own ta thanks trade with care good luck.

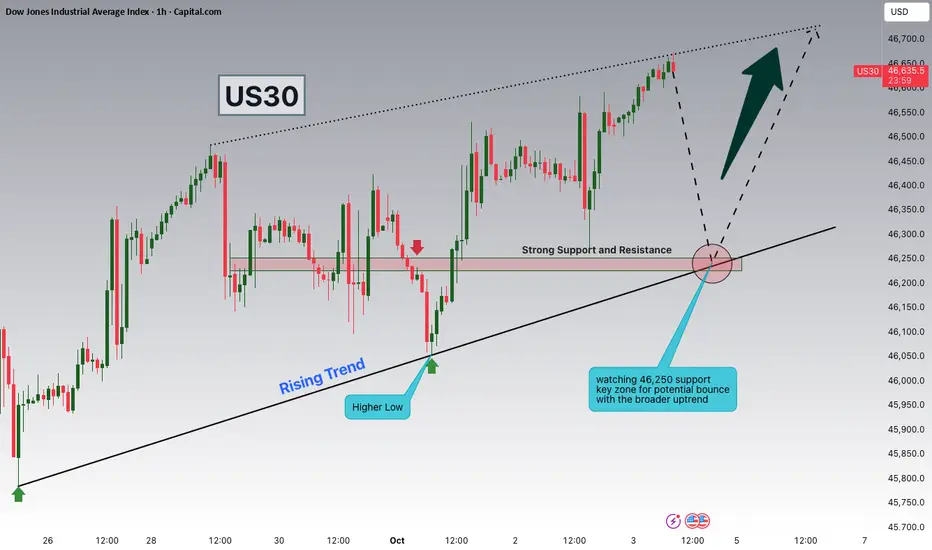
Dow Jones Watching 46,250 Support for Potential ContinuationHey Traders, in today’s trading session we are monitoring US30 for a potential buying opportunity around the 46,250 zone. The Dow Jones is trading in an uptrend and currently in a correction phase, with price moving toward this key support/resistance level.
Structure: The broader trend remains bullish, with pullbacks serving as corrections within the uptrend.
Key level in focus: 46,250 — an important support zone where price could stabilize and attract buyers.
Next move: Holding above 46,250 could open the door for continuation toward higher highs, while a breakdown would suggest a deeper retracement.
Trade safe,
Joe.
US30: Strong Bearish Sentiment! Short!
My dear friends,
Today we will analyse US30 together☺️
The recent price action suggests a shift in mid-term momentum. A break below the current local range around 46,903.31 will confirm the new direction downwards with the target being the next key level of 46,721.37 and a reconvened placement of a stop-loss beyond the range.
❤️Sending you lots of Love and Hugs❤️
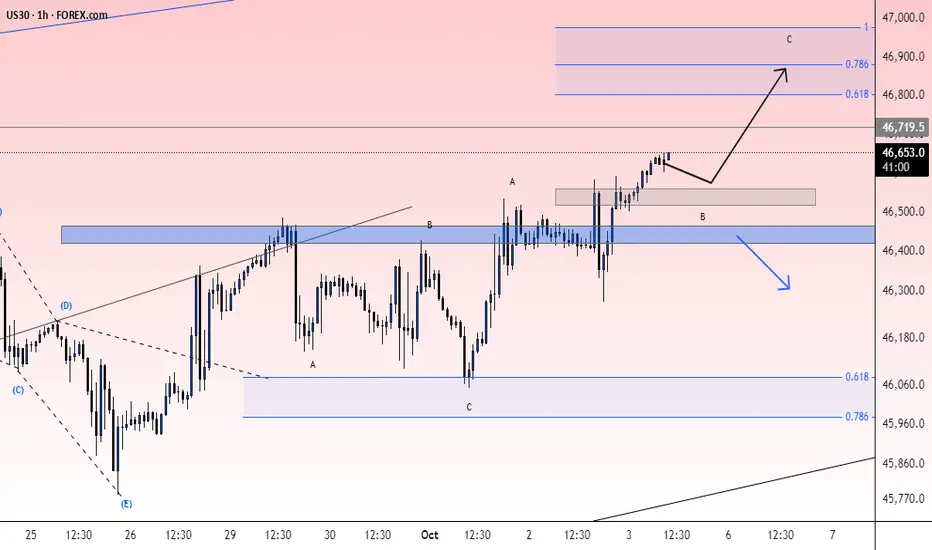
Is the Dow Jones still bullish? Yes.
Hello everyone
I think Dow Jones has the potential to grow further and if the conditions set in the figure below are met, it can be said that it can easily reach the set target. What do you think, friend? Leave me a comment

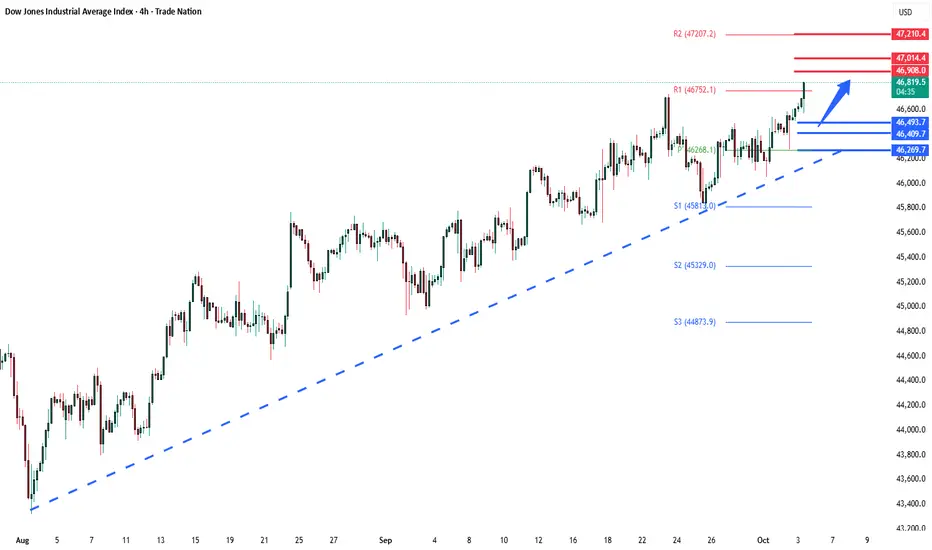
DowJones Key Trading levels Key Support and Resistance Levels
Resistance Level 1: 46900
Resistance Level 2: 47000
Resistance Level 3: 47210
Support Level 1: 46490
Support Level 2: 46410
Support Level 3: 46270
This communication is for informational purposes only and should not be viewed as any form of recommendation as to a particular course of action or as investment advice. It is not intended as an offer or solicitation for the purchase or sale of any financial instrument or as an official confirmation of any transaction. Opinions, estimates and assumptions expressed herein are made as of the date of this communication and are subject to change without notice. This communication has been prepared based upon information, including market prices, data and other information, believed to be reliable; however, Trade Nation does not warrant its completeness or accuracy. All market prices and market data contained in or attached to this communication are indicative and subject to change without notice.
Us30 Trade Set Up Oct 3 2025Price is trading above PDH so still bullish. If this 4h FVG gets respected and SSL gets swept i will look for buys to BSL/ATH but price has changed state on the 15m and 1h so i price comes to retest the 15m CISD and respects it i will look for IFVG on the 1m to take to lower SSL
www.tradingview.com

To you in comment…Us30…
FYI…. How far I’m willing to take it. 👀
Let’s get it!!!
Ny active!!!!
Bag or Dust 🏦

$us30Dirty 30….
She’s hunting $46,900+
Layered in as and willing to go $46,606 which holds key to pricing a long or short!!!
Let’s get it!!!!

uptrend It is expected that after some fluctuation and correction, the trend change will take place and we will witness the start of the uptrend. Then it will advance to the specified resistance levels.
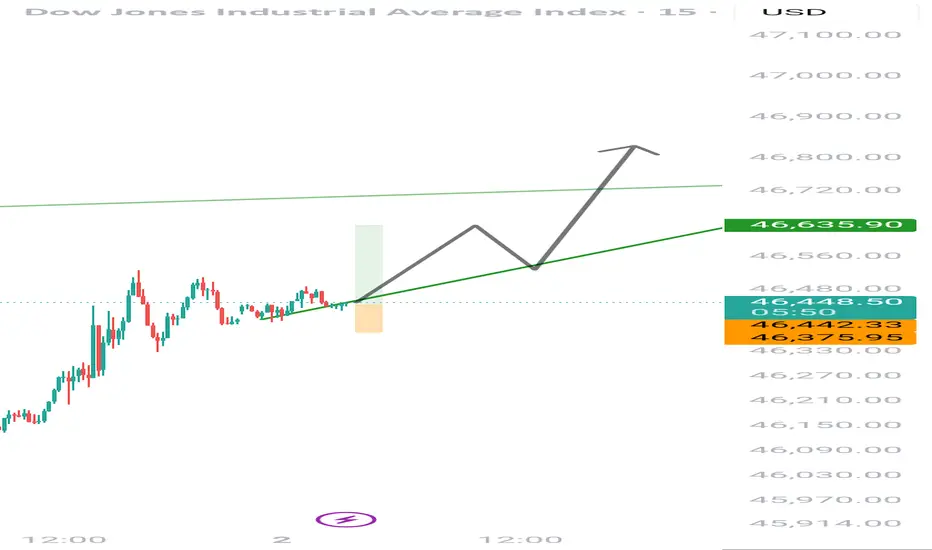
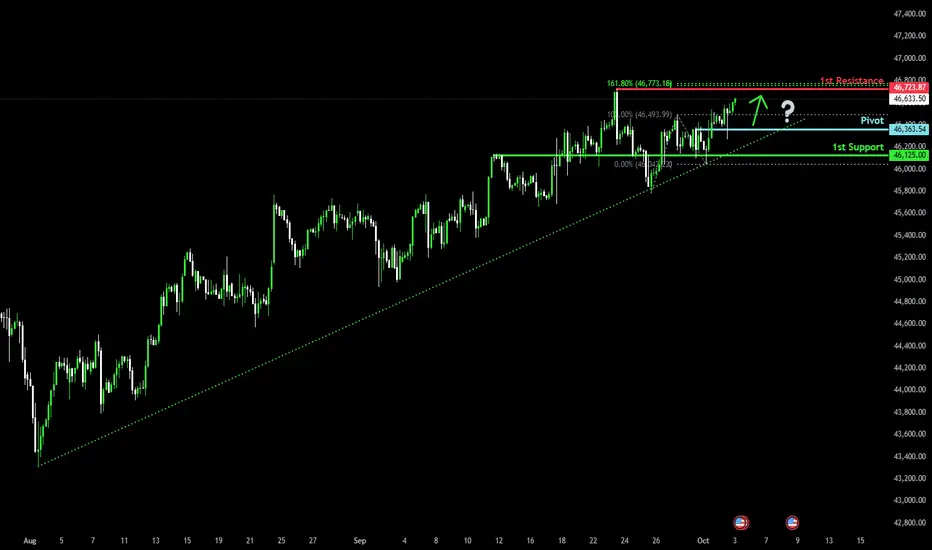
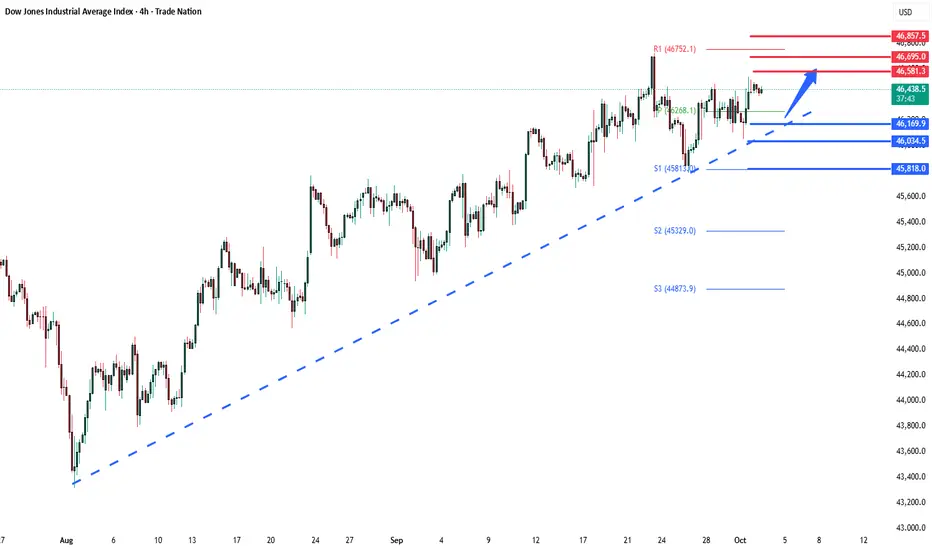
Bullish momentum to extend?Dow Jones (US30) has bounced off the pivot and could rise to the 1st resistance whch acts as a swing high resistance.
Pivot: 46,363.54
1st Support: 46,125
1st Resistance: 46,723.87
Disclaimer:
The above opinions given constitute general market commentary, and do not constitute the opinion or advice of IC Markets or any form of personal or investment advice.
Any opinions, news, research, analyses, prices, other information, or links to third-party sites contained on this website are provided on an "as-is" basis, are intended only to be informative, is not an advice nor a recommendation, nor research, or a record of our trading prices, or an offer of, or solicitation for a transaction in any financial instrument and thus should not be treated as such. The information provided does not involve any specific investment objectives, financial situation and needs of any specific person who may receive it. Please be aware, that past performance is not a reliable indicator of future performance and/or results. Past Performance or Forward-looking scenarios based upon the reasonable beliefs of the third-party provider are not a guarantee of future performance. Actual results may differ materially from those anticipated in forward-looking or past performance statements. IC Markets makes no representation or warranty and assumes no liability as to the accuracy or completeness of the information provided, nor any loss arising from any investment based on a recommendation, forecast or any information supplied by any third-party.
DJI Holy sh!% Bubble, 2028Just an idea I was playing around with, Dow Jones on this long parabolic move and the resulting crash wIll be fantastically devastating for the american people, again.

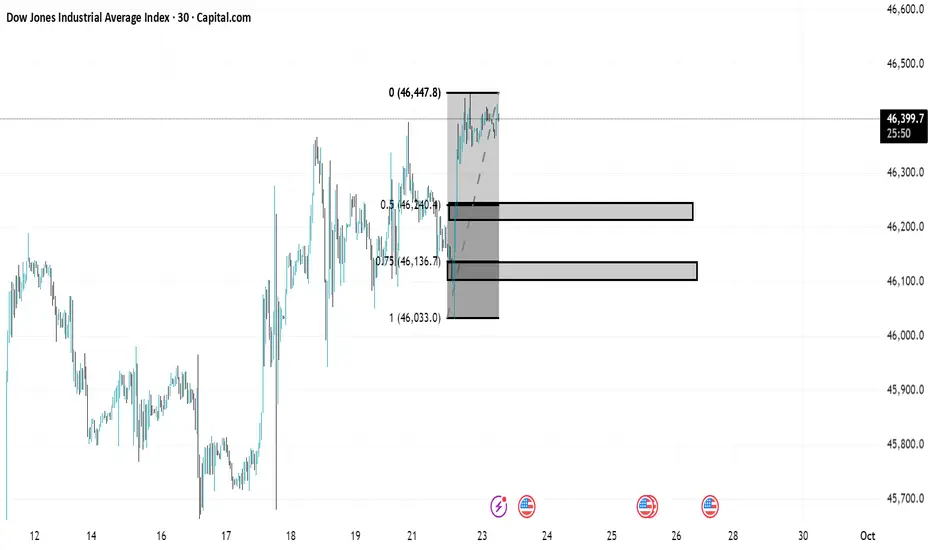
US30 TREND ANALYSISIn US30 there is a clear uptrend important areas are marked as always one is 50 percent area and the other one is 75 percent area .Once the market comeback for retest we will shift to smaller timeframe and look for trendshift after observing everything. When the market again comeback for the retest on smaller timeframe we will look for buy side trade.
important areas
50 percent zone(46245.3)
75 percent zone(46134.3)
bigger timeframe (30 minutes)
smaller timeframe(5 minutes)

Dow Key Trading LevelsKey Support and Resistance Levels
Resistance Level 1: 46580
Resistance Level 2: 46690
Resistance Level 3: 46850
Support Level 1: 46170
Support Level 2: 46040
Support Level 3: 45800
This communication is for informational purposes only and should not be viewed as any form of recommendation as to a particular course of action or as investment advice. It is not intended as an offer or solicitation for the purchase or sale of any financial instrument or as an official confirmation of any transaction. Opinions, estimates and assumptions expressed herein are made as of the date of this communication and are subject to change without notice. This communication has been prepared based upon information, including market prices, data and other information, believed to be reliable; however, Trade Nation does not warrant its completeness or accuracy. All market prices and market data contained in or attached to this communication are indicative and subject to change without notice.
Us30 Trade Set Up Oct 2 2025Price is overall bullish making HH/HL and has created a 4h FVG so i want to see price first sweep SSL/London lows, tap into 4h FVG to then look for 1m IFVG/CISD to target PDH
www.tradingview.com

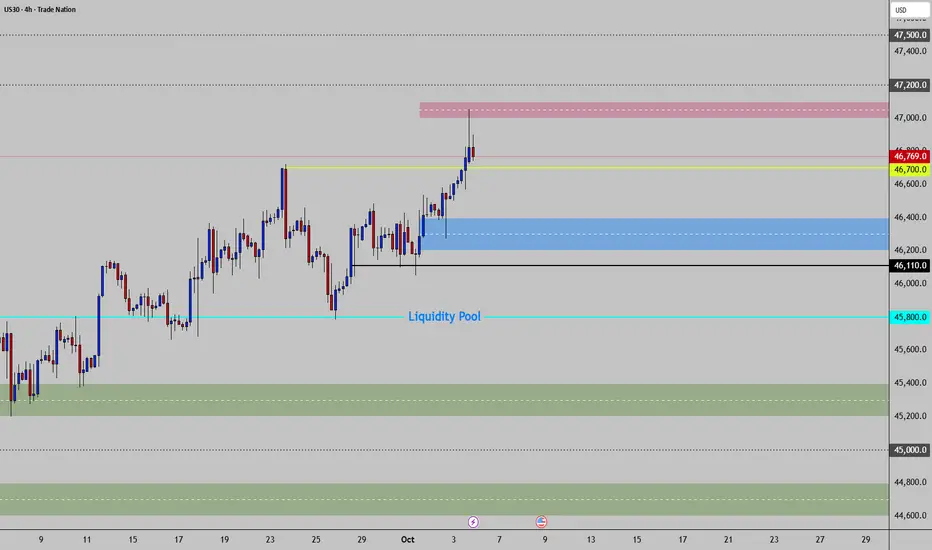
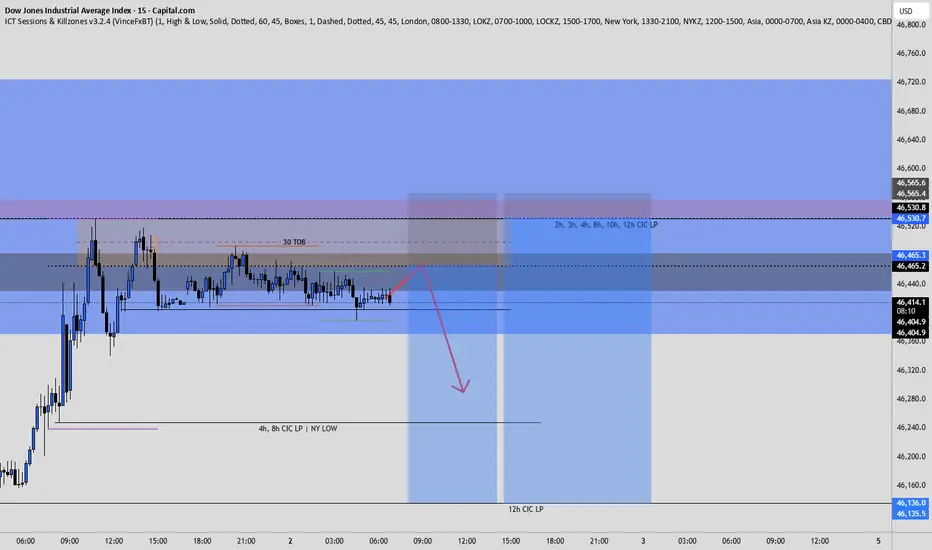
US30 ShortElite Analysis
Price is acquiring liquidity inside Daily and 4H structured liquidity zone
We are looking for price to come up, react off a FVG and liquidity marked out by various time frames
Targeting lower liquidity pools
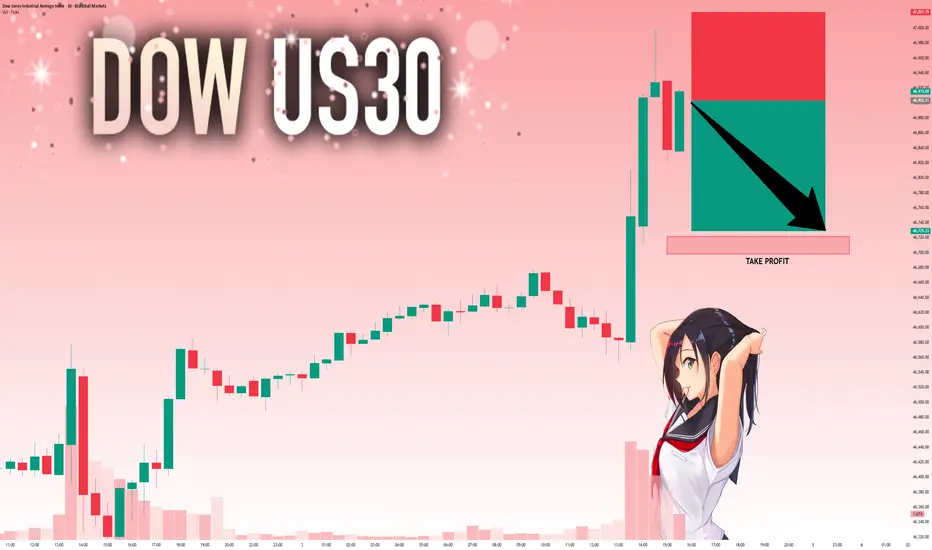
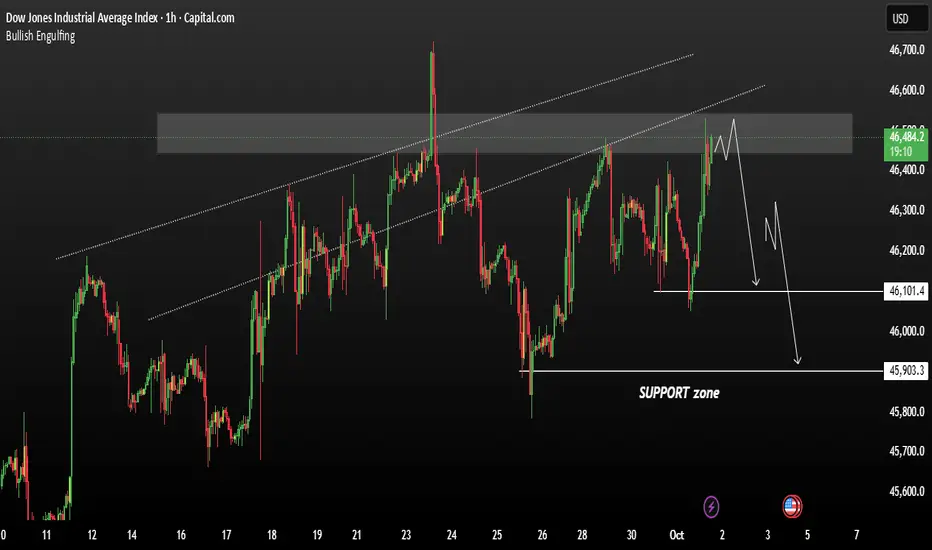
US30 currently consolidating near a key resistance zone US30 is currently consolidating near a key resistance zone likely around the yearly high / major supply level. This resistance has already been tested once previously, where price reversed downward sharply — showing sellers are active here The current sideways movement suggests the market is indecisive or absorbing liquidity before a larger move. If bearish momentum builds, potential support zone we could expect downside target 46,100 – 45,900 falling Range.
You may Find more details in the chart.
Trade wisely Best Of Luck.
Ps. Support with like and comments for better analysis Thanks for Supporting.
US30 : BULLISH PATTERNI am going to wait until it mitigate my continuation demand area ... And HoLD !
I will see how it goes . Happi Trading
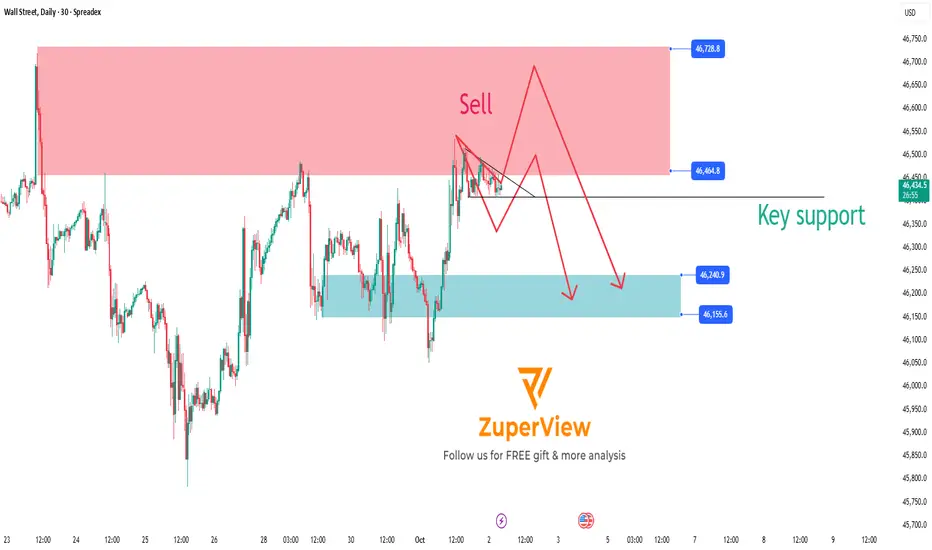
US30: Key support breakdown signals potential sell opportunity
1. Current Market Overview 🌐
The SPREADEX:DJI index is approaching a significant resistance zone where selling pressure is expected to be strong. The price is currently consolidating and moving sideways around this area, preparing for a major move.
2. Technical Signals and Momentum Indicators 📊
Momentum indicators such as MFI, RSI, and Stochastic have all entered the oversold territory, while also showing signs of price compression (consolidation), indicating the market is waiting for the next breakout.
The strong resistance zone and the Overbought/Overextended (OB/OS) signals suggest that buying pressure is weakening, which is favorable for sellers.
3. Sell Scenario on Key Support Breakdown 🔻
If the price breaks below the important Key Support level shown on the chart, this will confirm the beginning of a downtrend.
Traders can consider opening sell positions as soon as the breakout occurs to take advantage of the downward momentum.
The price target is expected to move toward lower support zones where buying interest may emerge to cause a price correction.
4. Risk Management ⚠️
Place stop-loss orders above the resistance zone or the nearest recent highs to protect against unexpected market moves.
Adjust your position size according to your risk tolerance.
5. Conclusion 🔑
The sell setup on US30 is very clear with a strong resistance zone and momentum signals indicating a potential upcoming downtrend.
Main scenario: Breaking the Key Support will trigger a strong decline, providing a profitable trading opportunity for sellers.
Wait for a confirmed support break before entering the trade to ensure safety and effectiveness.
Please like and comment below to support our traders. Your reactions will motivate us to do more analysis in the future 🙏✨
Harry Andrew @ ZuperView
long Dow JonesIndexes turn bullish after a government shutdown because the disruption is temporary, the Fed is seen as more dovish, sidelined cash comes back into risk assets, and earnings aren’t really hurt. Once uncertainty lifts, markets reprice higher