US30 Trade Set Up Oct 30 2025price is making bearish structure on the 1h and 15m so i want to see a sweep of BSL and/or tap into 15m FVG before looking for internal 1m-5m IFVG/CISD to target daily FVG and SSL
Trade ideas

US30 Double topDouble top with multipal Divergence
Going for Short
Sell stop
47261.0
SL: 48101
TP: 46420
RRR 1:1

Us30-reversal pattern spotted
-will be scalping since there's no break and retest
-shorts will be my investment


US30 Trade Set Up Nov 3 2025For price to go bullish i want to see a test of the 15m FVG and respect it to then make internal 1m-5m IFVG/CISD to target BSL/London highs but if price inverts the 15m gap i will look for sells to PDL

us30Dow Jones on the 4H timeframe is moving in a downtrend in my view. Based on the data on the chart, it’s time for a correction. The price may rise to the highlighted area 1 hour timeframe before continuing the corrective targets shown on the chart, or it may complete the correction around the 50% Fibonacci retracement level. It’s unlikely to rise beyond that level."

DowJoned bullish breakout supported at 47260Key Support and Resistance Levels
Resistance Level 1: 48085
Resistance Level 2: 48255
Resistance Level 3: 48500
Support Level 1: 47260
Support Level 2: 47040
Support Level 3: 46880
This communication is for informational purposes only and should not be viewed as any form of recommendation as to a particular course of action or as investment advice. It is not intended as an offer or solicitation for the purchase or sale of any financial instrument or as an official confirmation of any transaction. Opinions, estimates and assumptions expressed herein are made as of the date of this communication and are subject to change without notice. This communication has been prepared based upon information, including market prices, data and other information, believed to be reliable; however, Trade Nation does not warrant its completeness or accuracy. All market prices and market data contained in or attached to this communication are indicative and subject to change without notice.

London Manipulation, New York Expansion – US30 Outlook-Tokyo session built accumulation after liquidity sweep, setting a clean base.
-London delivered a perfect manipulation below Asian lows, leaving a fresh bullish FVG.
As long as price holds above 47,650–47,700,
-New York is likely to continue the expansion phase toward 48,050–48,100.
Below 47,600, a CHOCH may form before another push.
Smart Money narrative stays bullish — accumulation, manipulation, and now distribution.
#US30 #SmartMoneyConcepts #PriceAction #FVG #ICT #MarketStructure

DowJones key support at 47260Key Support and Resistance Levels
Resistance Level 1: 48085
Resistance Level 2: 48255
Resistance Level 3: 48500
Support Level 1: 47260
Support Level 2: 47040
Support Level 3: 46880
This communication is for informational purposes only and should not be viewed as any form of recommendation as to a particular course of action or as investment advice. It is not intended as an offer or solicitation for the purchase or sale of any financial instrument or as an official confirmation of any transaction. Opinions, estimates and assumptions expressed herein are made as of the date of this communication and are subject to change without notice. This communication has been prepared based upon information, including market prices, data and other information, believed to be reliable; however, Trade Nation does not warrant its completeness or accuracy. All market prices and market data contained in or attached to this communication are indicative and subject to change without notice.

DowJones at pivotal trading zoneKey Support and Resistance Levels
Resistance Level 1: 48085
Resistance Level 2: 48255
Resistance Level 3: 48500
Support Level 1: 47260
Support Level 2: 47040
Support Level 3: 46880
This communication is for informational purposes only and should not be viewed as any form of recommendation as to a particular course of action or as investment advice. It is not intended as an offer or solicitation for the purchase or sale of any financial instrument or as an official confirmation of any transaction. Opinions, estimates and assumptions expressed herein are made as of the date of this communication and are subject to change without notice. This communication has been prepared based upon information, including market prices, data and other information, believed to be reliable; however, Trade Nation does not warrant its completeness or accuracy. All market prices and market data contained in or attached to this communication are indicative and subject to change without notice.

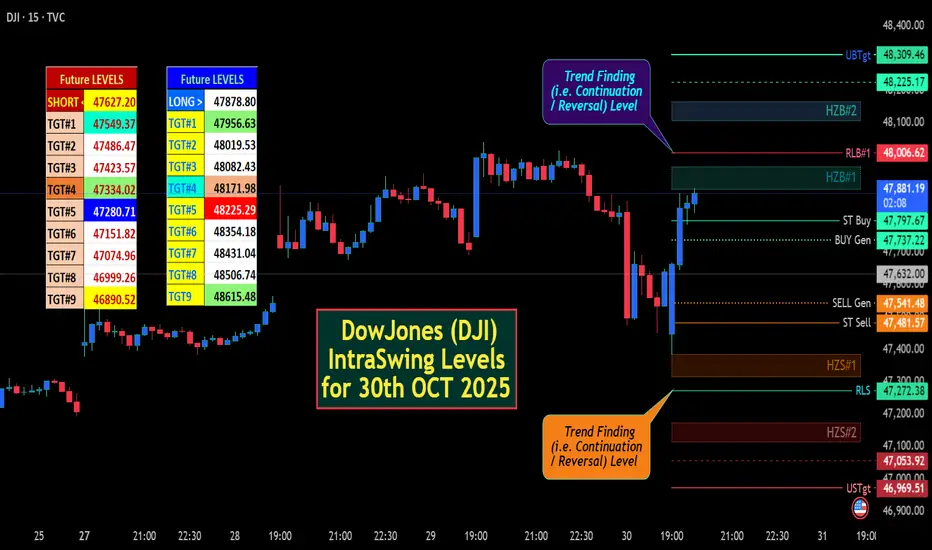
DowJones (DJI) IntraSwing Levels for 30th OCT 2025✍🏼️ "FUTUREY Levels" mentioned in BOX format.
🌡️Plot Levels Using 3 Min, 5 Min Time frame in your Chart for Better Analysis
L#1: If the candle crossed & stays above the “Buy Gen”, it is treated / considered as Bullish bias.
L#2: Possibility / Probability of REVERSAL near RLB#1 & UBTgt
L#3: If the candle stays above “Sell Gen” but below “Buy Gen”, it is treated / considered as Sidewise. Aggressive Traders can take Long position near “Sell Gen” either retesting or crossed from Below & vice-versa i.e. can take Short position near “Buy Gen” either retesting or crossed downward from Above.
L#4: If the candle crossed & stays below the “Sell Gen”, it is treated / considered a Bearish bias.
L#5: Possibility / Probability of REVERSAL near RLS#1 & USTgt
HZB (Buy side) & HZS (Sell side) => Hurdle Zone,
*** Specialty of “HZB#1, HZB#2 HZS#1 & HZS#2” is Sidewise (behaviour in Nature)
Rest Plotted and Mentioned on Chart
Color code Used:
Green =. Positive bias.
Red =. Negative bias.
RED in Between Green means Trend Finder / Momentum Change
/ CYCLE Change and Vice Versa.
Notice One thing: HOW LEVELS are Working.
Use any Momentum Indicator / Oscillator or as you "USED to" to Take entry.
⚠️ DISCLAIMER:
The information, views, and ideas shared here are purely for educational and informational purposes only. They are not intended as investment advice or a recommendation to buy, sell, or hold any financial instruments. I am not a SEBI-registered financial adviser.
Trading and investing in the stock market involves risk, and you should do your own research and analysis. You are solely responsible for any decisions made based on this research.
"As HARD EARNED MONEY IS YOUR's, So DECISION SHOULD HAVE TO BE YOUR's".
Do comment if Helpful .
In depth Analysis will be added later (If time Permits)
US30US30 is almost completing correction before further upside follows.
Disclosure: We are part of Trade Nation's Influencer program and receive a monthly fee for using their TradingView charts in our analysis.

US30 H4 | Bullish Bounce Off OBUS30 is having a temporary correction towards the downside. However, there is a Fair Value Gap and Order Block present, which could cause price to bounce from that area.
Our buy entry is in between the FVG and OB, at 46,883, which also aligns with the 75% FIbonacci retracement level.
The stop loss is at 46,509, which is at the swing low support level, while the take profit is at 47,460, which is at the pullback resistance level.
Stratos Markets Limited (tradu.com/uk ):
CFDs are complex instruments and come with a high risk of losing money rapidly due to leverage. 68% of retail investor accounts lose money when trading CFDs with this provider. You should consider whether you understand how CFDs work and whether you can afford to take the high risk of losing your money.
Stratos Europe Ltd (tradu.com/eu ):
CFDs are complex instruments and come with a high risk of losing money rapidly due to leverage. 70% of retail investor accounts lose money when trading CFDs with this provider. You should consider whether you understand how CFDs work and whether you can afford to take the high risk of losing your money.

possibility of uptrend It is expected that after some fluctuation, an upward trend will form and advance to the resistance range. As long as the price fluctuates above the support range, an upward trend is likely.

US30 Technical Breakdown – 10/30/2025
📍 US30 Technical Breakdown – 10/30/2025
US30 cooled off after a strong rally last week 🔥 Price printed a local high around 47,800, then started retracing as momentum slowed. The index is now testing the 47,500–47,400 support zone, sitting right around the EMAs — a crucial spot for bulls to defend 👀
📊 Market Behavior:
🔹 Higher highs and higher lows still intact (bullish structure)
🔹 EMAs starting to flatten → possible short-term pullback
🔹 Buyers defending 47.4K area so far
📌 Key Levels:
🔹 Resistance Zones:
47,790 → recent high / intraday resistance
48,000 → major breakout level
48,200 → continuation target
🔹 Support Zones:
47,400 → EMA & structure support
47,100 → previous breakout zone
46,520 → demand base
🧠 Bias:
Bullish overall ⚡
➡️ Above 47,800 → breakout continuation toward 48,200+
⬅️ Below 47,400 → short-term correction back toward 47,100

Possibility of uptrend It is expected that the upward trend will continue and the index will advance to the specified resistance levels. Otherwise, a correction to the support area will be possible, and then a change in the trend scenario will be likely.

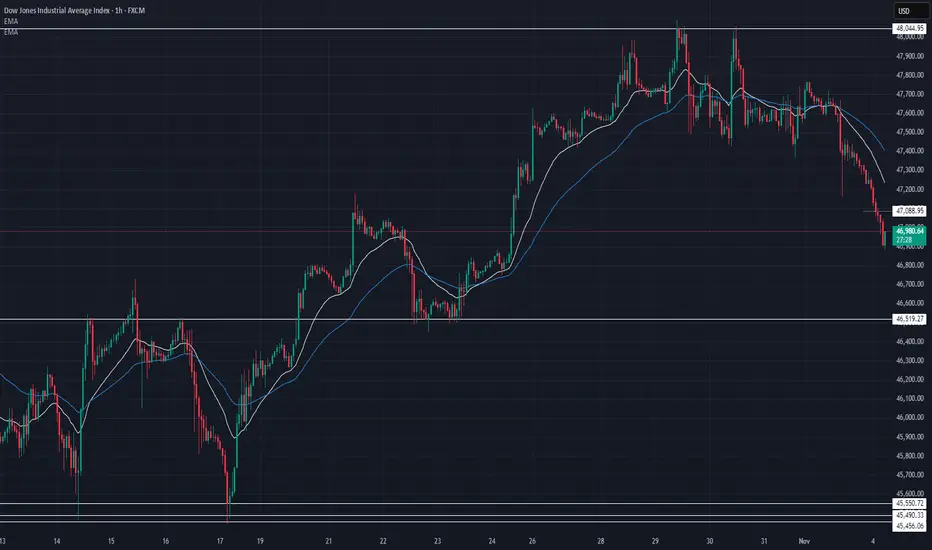
US30 Technical Breakdown – 11/04/2025📍 US30 Technical Breakdown – 11/04/2025
US30 faced heavy selling pressure after rejecting the 48,000 psychological resistance 🚫 The index has been in a steady decline since, currently sitting near 46,950, testing the mid-range structure support 👀
📊 Market Behavior:
🔹 Clean rejection from 48,000 → clear short-term shift in sentiment
🔹 Price trading below both EMAs → momentum favoring sellers
🔹 47,000 area acting as temporary support — watch for a bounce or breakdown
📌 Key Levels:
🔹 Resistance Zones:
47,400 → intraday EMA resistance
47,700 → lower high zone
48,000 → key breakout barrier
🔹 Support Zones:
46,900 → current structure support
46,520 → major demand area
46,000 → deeper correction level
🧠 Bias:
Short-term bearish ⚠️
➡️ Below 46,900 → sellers in control
⬆️ Break above 47,400 → potential reversal zone
US30 BULLHI
Simple market structure.
The chart speaks for itself
Quick resume, the market is currently goin through correction for bullish continuation.

US30 Bullish Breakout!
HI,Traders !
#US30 is trading in a strong
Uptrend and the price made a
Bullish breakout of the key
Horizontal level of 46718.2
So we are bullish biased
And we will be expecting a
Further bullish move up !
Comment and subscribe to help us grow !

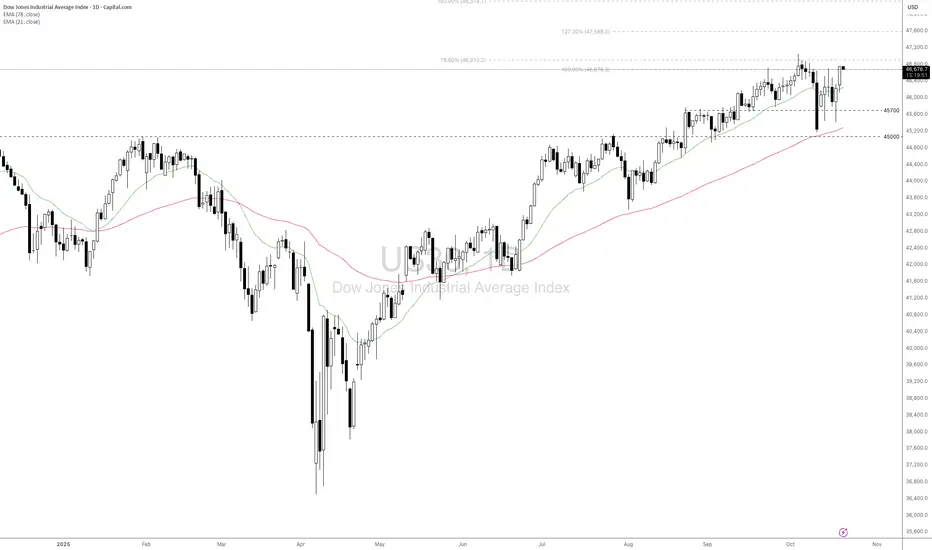
Dow Gains on Earnings Optimism and Shutdown Resolution Hopes.Fundamental approach:
- The Dow Jones index advanced this week, supported by strong corporate earnings optimism and hopes for a government shutdown resolution.
- Major earnings reports from technology companies may lead the gains, with IBM scheduled to report Q3 earnings on Wed, 22 Oct, with expectations for AI-driven growth. Additionally, 3M (MMM) is scheduled to report Q3 earnings on Tue, 21 Oct, before market open.
- Fed Governor Christopher Waller provided a dovish signal, noting inflation was "not a barrier to rate cuts."
- This sentiment pushed US Treasury yields lower, with the 10-year note falling below 4.00%, offering support to equities amid the data uncertainty.
- Investors also focused on the potential end to the federal government shutdown, which has created data blackouts for key economic releases, with National Economic Council Director Kevin Hassett indicating the shutdown could end this week.
Technical approach:
- US30 is testing the previous all-time high at around 47000. The index is above both EMAs, indicating a strong bullish movement.
- If US30 breaches above 47000, the index may advance to test 127.20% Fibonacci Extension at 47590.
- On the contrary, staying below EMA21 may prompt US30 to retest the support at 45700.
Analysis by: Dat Tong, Senior Financial Markets Strategist at Exness
US30: Bulls Are Winning! Long!
My dear friends,
Today we will analyse US30 together☺️
The recent price action suggests a shift in mid-term momentum. A break above the current local range around 47,765.31 will confirm the new direction upwards with the target being the next key level of 47,916.63 and a reconvened placement of a stop-loss beyond the range.
❤️Sending you lots of Love and Hugs❤️

US30 Trade Set Up Oct 27 2025Price ended up making ATH in Asia session closing above PDH and creating a 4h FVG which has been filled along with Asia lows/SSL being swept so i am expecting price to continue bullish to London highs/BSL

US30US30 has taken the top one more time, now we are expecting a Pullback to start this week.
Disclosure: We are part of Trade Nation's Influencer program and receive a monthly fee for using their TradingView charts in our analysis.
