DOW JONES (US30): Confirmed BoS & More Growth
I see another confirmed break of structure and a violation
of an important intraday horizontal resistance on a 4h time frame on US30 Index.
Odds will be high, that the market will continue rising.
Next resistance - 46550
❤️Please, support my work with like, thank you!❤️
I am part of Trade Nation's Influencer program and receive a monthly fee for using their TradingView charts in my analysis.
US30FU trade ideas

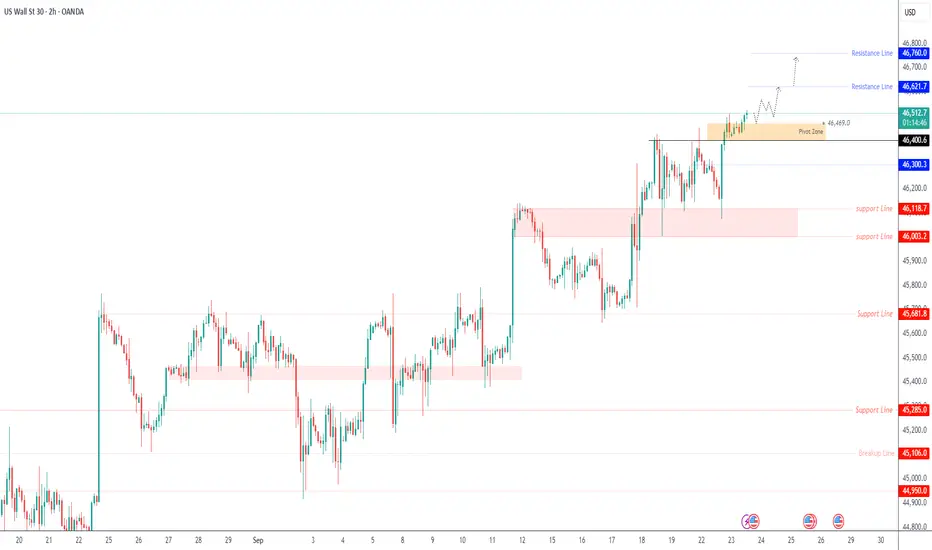
US30 Consolidation remains firmly within a strong bullish trendThe US30 has recorded a new high zone, extending its rally as markets continue to react positively to supportive macroeconomic conditions. Optimism is being driven largely by expectations of Federal Reserve interest rate cuts, while strong consolidation in the broader market further underpins sentiment.
A Price action remains firmly within a strong bullish trend as long as the index trades above 46,000. Sustained momentum above this key support level is likely to open the path towards the 47,200 resistance zone, potentially paving the way for further upside in the near term.
You any find more details in the chart,
Trade wisely best of Luck.
Ps; Support with like and comments for better analysis Thanks for Supporting.

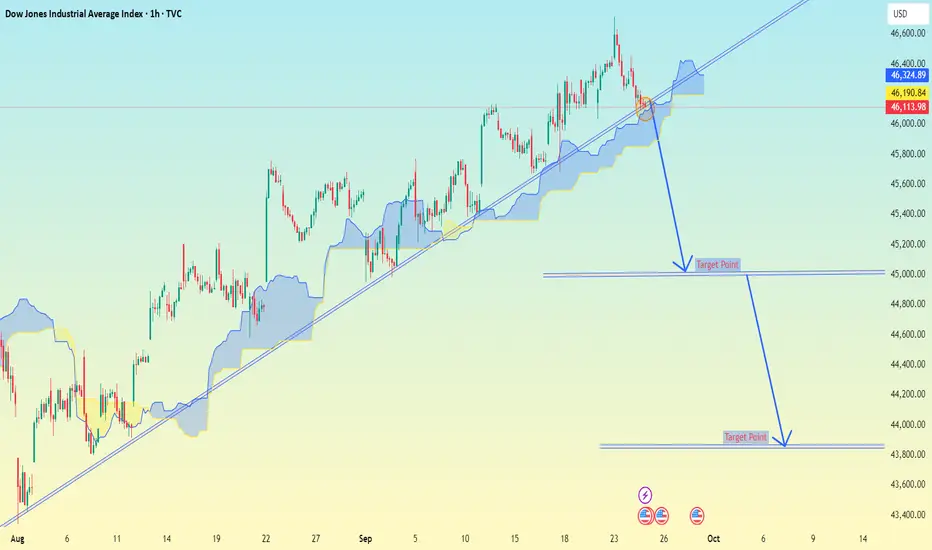
Dow Jones Industrial Average (DJI) on the 1-hour timeframe.Dow Jones Industrial Average (DJI) on the 1-hour timeframe.
From the chart:
The uptrend line is being tested.
There are two downside target points marked if the trendline breaks.
📉 Target levels shown on the chart:
1. First target zone: around 45,000 – 45,100
2. Second target zone: around 43,800 – 44,000
So if the price breaks the ascending trendline and confirms below it, the next expected supports are roughly:
45,000 area (first support/target)
43,800 area (second support/target)
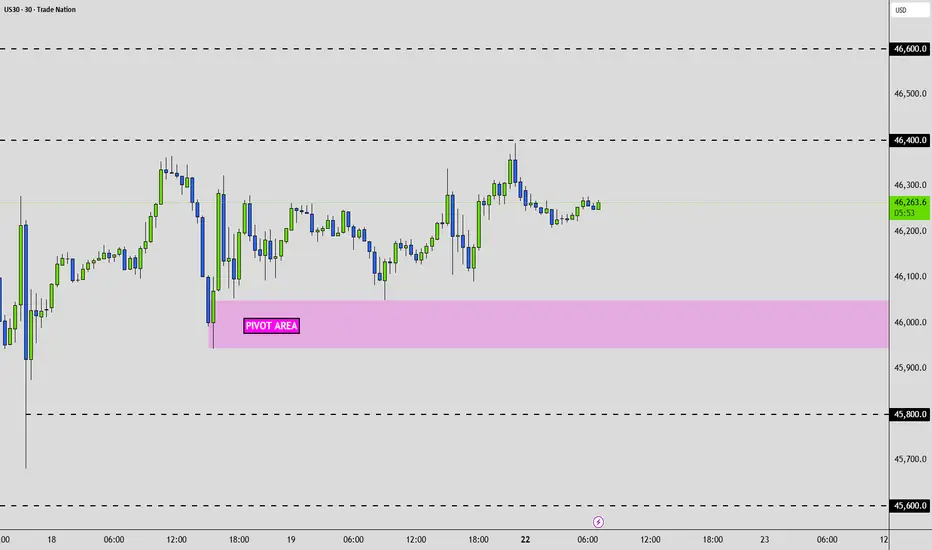
Dow Jones - US30: Trading Edge TodayDear Friends in Trading,
Experimental Test Phase Week:
Correlation Logic & Daily Efficiency - GOLD🔄NASDAQ🔄DOW JONES
🔎 Previous Week Observations -
Price built a volume base / cluster around 45,950 – 46,050 last week (multiple rotations here).
Breakout rallies on the 18th and 19th pushed price above 46,200, which is now acting as resistance/acceptance.
Current level (~46,273) is sitting right at this balance edge.
🎯US30 - 22Sept:
Pivot Area: 46,000 ± 50
Bias: Neutral-Bullish above pivot
Bull targets: 46,400 → 46,600
Bear targets: 45,800 → 45,600
👉 Gold and indices are inversely correlated intraday; if one pivots, the other confirms.
Dow showing slower but steady grind.
Needs >46,400 to confirm breakout continuation.
I sincerely hope my point of view offers a valued insight.
Thank you for taking the time study my analysis.
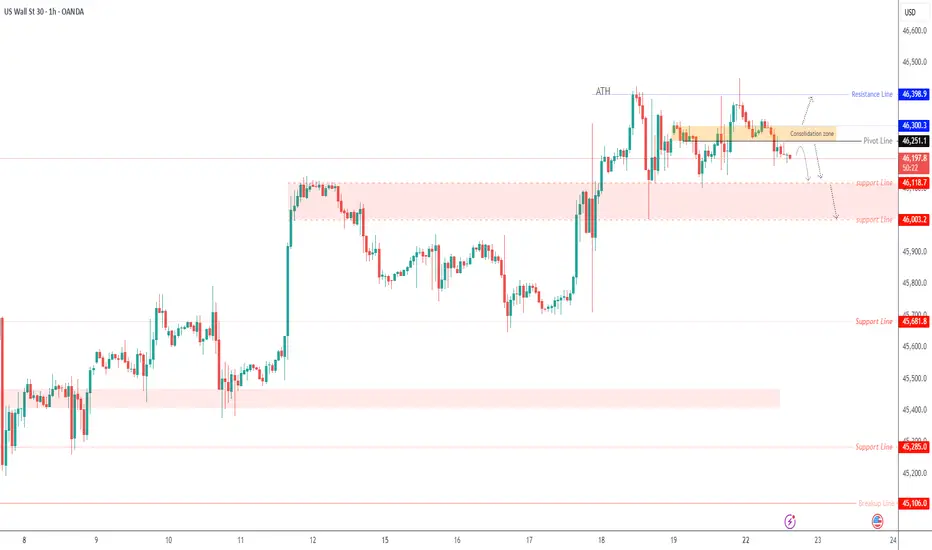
US30 – Bears Eye 46,000 Ahead of Key GDP ReleaseUS30 – Overview
The Dow Jones remains under bearish momentum as traders await the key U.S. GDP report.
Markets expect a sharp rebound from the previous -0.5% reading to around 3.3%.
A stronger-than-expected result would likely pressure US30 lower, while a print closer to 2.0% could spark volatility and choppy price action.
Technical View
Bearish Scenario:
Price is expected to test 46,000 first.
🔻 A confirmed 1H close below 46,000 would extend the bearish trend toward 45,680 → 45,520.
Bullish Scenario:
If price stabilizes above 46,120, US30 is likely to consolidate within the 46,120 – 46,300 range.
A confirmed breakout above 46,300 would open the way toward 46,400 → 46,620.
Key Levels
Pivot: 46,120
Resistance: 46,300 – 46,400 – 46,620
Support: 46,000 – 45,680 – 45,520
The GDP release will be the main driver.
Above 46,120: consolidation with bullish attempts.
Below 46,000: continuation of the bearish trend toward deeper supports.

US30 - Short Setup – Rising Channel (4H)I'm currently eyeing a short opportunity on US30 (Dow Jones Industrial Average) based on the 4H timeframe.

Us30 Trade Set Up Sep 23 2025Price swept PDH in London session and formed a SSL at Asia lows so if price sweeps it and closes above i will look for 1m IFVG and CISD to take higher but if price closes under i will look for sells to test 1h FVG

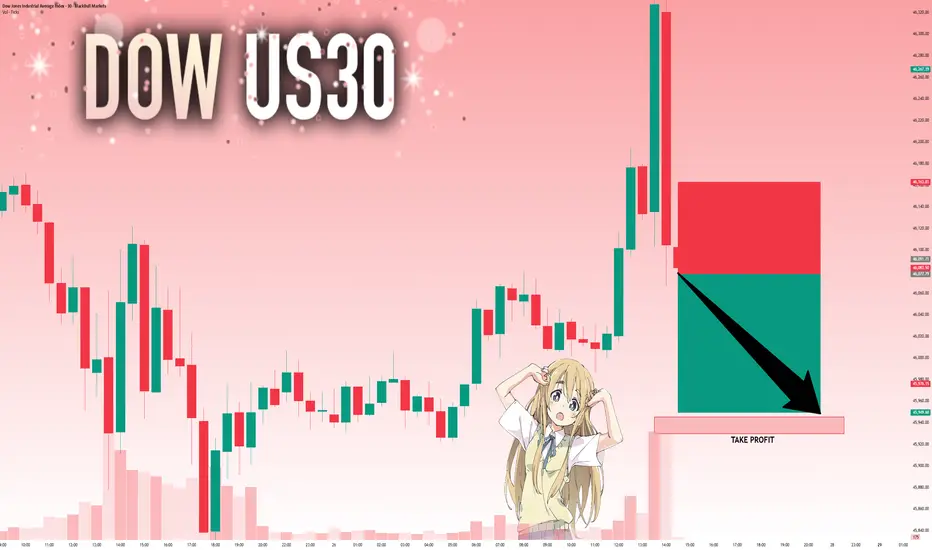
Dow at record highs, outperfoms peers! But are risks brewing?The Dow Jones DJIA surged to new record highs, driven by defensive sector strength and expectations of Fed rate cuts. Dow outperformed due to its heavier weighting in defensive sectors (industrials, financials, consumer staples), which are favoured during economic uncertainty and falling yields. Technical analysis suggests further upside potential, as investors seek stability and dividends in Dow components amid lingering recession risks. However, key support levels must hold to sustain the rally.
The Dow has completed a V-shaped recovery, breaking above previous double-top highs from 2024/2025 (45,150), now acting as support. An open triangle pattern was identified, with the current move likely the fifth wave to the upside. The index trades above all major moving averages, confirming bullish momentum, but RSI shows hidden bullish divergence, supporting the case for continued upside only if support holds after a pullback.
Dow has critical support at 45k, must hold to maintain bullish momentum. A drop below 45,581 could trigger a correction. Short-term upside shows 47k, with a major Fibonacci cluster and technical inflexion in focus. Intermediate levels sit at 46300/45900/45640, with important long-term Targets at 45k, 49500, 50k, 53k.
Risks & Potential Scenarios
Divergence: Despite strong momentum, technical divergence suggests a possible corrective move if the Dow falls below 45581.
Bullish : Holding above 45581 and 45k supports further upside toward 47k and beyond.
Bearish : A break below 45581 could trigger a deeper pullback before any renewed rally.
Market Sentiment :
The bond market’s caution contrasts with stock market optimism, so stay vigilant.
This content is not directed to residents of the EU or UK. Any opinions, news, research, analyses, prices or other information contained on this website is provided as general market commentary and does not constitute investment advice. ThinkMarkets will not accept liability for any loss or damage including, without limitation, to any loss of profit which may arise directly or indirectly from use of or reliance on such information.

US30: Target Is Down! Short!
My dear friends,
Today we will analyse US30 together☺️
The recent price action suggests a shift in mid-term momentum. A break below the current local range around 46,077.79 will confirm the new direction downwards with the target being the next key level of 45,945.23 and a reconvened placement of a stop-loss beyond the range.
❤️Sending you lots of Love and Hugs❤️
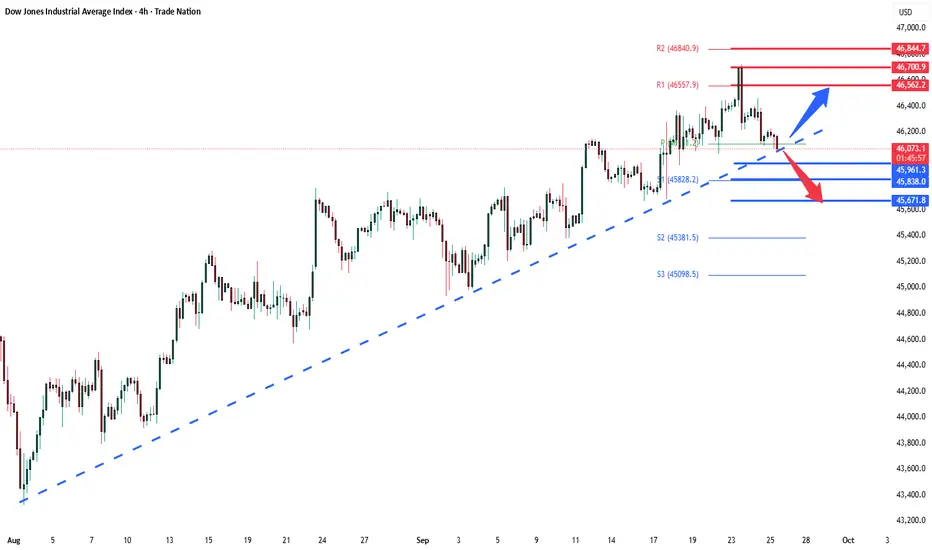
Dow corrective pullback - pivotal zone!Key Support and Resistance Levels
Resistance Level 1: 46560
Resistance Level 2: 46700
Resistance Level 3: 46845
Support Level 1: 46100
Support Level 2: 45960
Support Level 3: 45840
This communication is for informational purposes only and should not be viewed as any form of recommendation as to a particular course of action or as investment advice. It is not intended as an offer or solicitation for the purchase or sale of any financial instrument or as an official confirmation of any transaction. Opinions, estimates and assumptions expressed herein are made as of the date of this communication and are subject to change without notice. This communication has been prepared based upon information, including market prices, data and other information, believed to be reliable; however, Trade Nation does not warrant its completeness or accuracy. All market prices and market data contained in or attached to this communication are indicative and subject to change without notice.
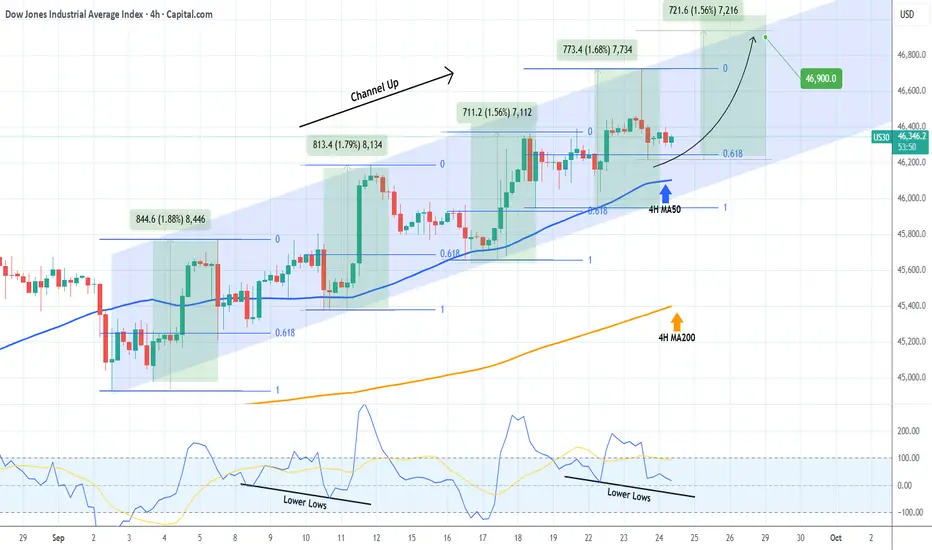
DOW JONES forming a bottom ahead of the next rally.Dow Jones (DJI) has been trading within a Channel Up since the start of September and right now it is consolidating after having hit the 0.618 Fibonacci retracement level, following a Higher High rejection at the top of the pattern.
As you can see, the 0.618 Fib was always pull-back tested after a Higher High, with the 4H MA50 (blue trend-line) also or at least coming very close to. As a result, the current 4H candle consolidation is technically a bottoming process before the new Bullish Leg.
The weakest Bullish Leg of this Channel Up has been +1.56%, which more than covers our 46900 Target.
-------------------------------------------------------------------------------
** Please LIKE 👍, FOLLOW ✅, SHARE 🙌 and COMMENT ✍ if you enjoy this idea! Also share your ideas and charts in the comments section below! This is best way to keep it relevant, support us, keep the content here free and allow the idea to reach as many people as possible. **
-------------------------------------------------------------------------------
💸💸💸💸💸💸
👇 👇 👇 👇 👇 👇
US30: Target Is Up! Long!
My dear friends,
Today we will analyse US30 together☺️
The recent price action suggests a shift in mid-term momentum. A break above the current local range around 46,620.50 will confirm the new direction upwards with the target being the next key level of 46,789.61 and a reconvened placement of a stop-loss beyond the range.
❤️Sending you lots of Love and Hugs❤️
Questions about the Macro environments $DJIthe recession succeeding the great depression all lacked scale and were distinct to the great depression. As long as the government doesn't begin seizing assets we should be alright to continue the bullish macro trends.

US30 – Record Highs as Fed Cut and Nvidia Deal Fuel MomentumUS30 – OVERVIEW
U.S. stocks hit fresh record highs on Thursday, supported by the Federal Reserve’s first rate cut of 2025, a drop in jobless claims, and news that Nvidia will invest $5 billion in Intel, boosting sentiment across the tech sector. The upcoming New York session is expected to drive additional volatility.
Technical Analysis
The Dow remains in a sensitive zone near key pivots.
🔹 As long as price trades below 46,250, bearish volatility could emerge, targeting 46,120 and, if broken, 46,000.
🔹 A decisive break above 46,300 would confirm bullish continuation toward 46,400 and 46,520.
Key Levels
Pivot Zone: 46,250 – 46,300
Resistance: 46,400 – 46,520
Support: 46,140 – 46,110 – 46,000
A clean move outside the 46,250–46,300 range will set the next direction, with the U.S. session likely to provide the catalyst for a breakout.

US30: Move Up Expected! Long!
My dear friends,
Today we will analyse US30 together☺️
The recent price action suggests a shift in mid-term momentum. A break above the current local range around 46,200.8 will confirm the new direction upwards with the target being the next key level of 46,261.6 and a reconvened placement of a stop-loss beyond the range.
❤️Sending you lots of Love and Hugs❤️
DOW JONES (US30): Your Plan to Trade FOMC Today
US30 keeps coiling on a recently broken daily key resistance
that turned into a support after a breakout.
To buy the market with confirmation after today's rate decision,
concentrate your attention on a double bottom pattern on a 4H time frame.
A bullish breakout of its neckline and a 4H candle close above 46850
will provide a reliable signal.
A bullish continuation will be expected to a current structure high then - 46087.
❤️Please, support my work with like, thank you!❤️
I am part of Trade Nation's Influencer program and receive a monthly fee for using their TradingView charts in my analysis.

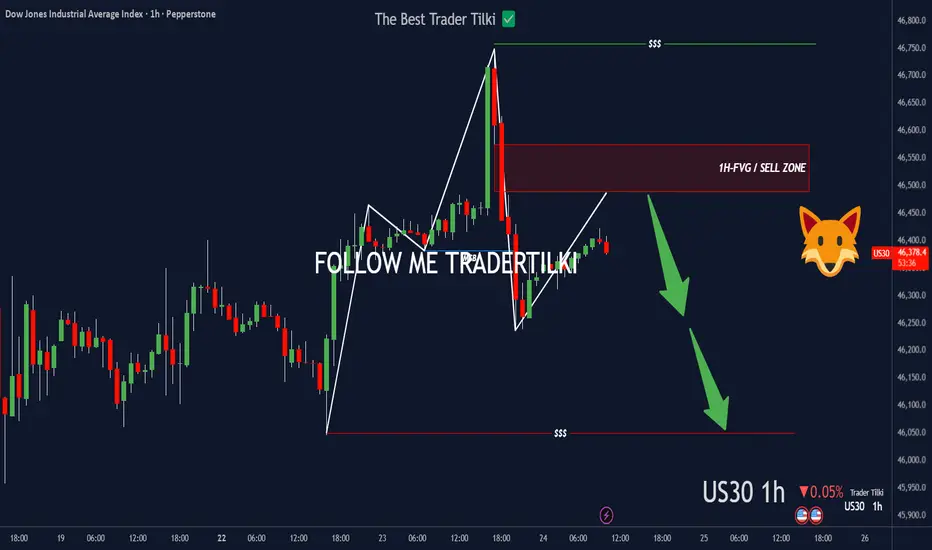
US30 left a footprint—FVG’s callin’.Hey Guys,
Once US30 hits my SELL zone, I’m pulling the trigger—targeting 46049.0
• Entry: 46574.5.0 or 46488.9
Set the stop point according to your own margin, my friends.
Every like you drop pushes me to share more setups like this. Big thanks to everyone showing support!
US30 – Fresh Record High with Bulls Targeting Higher LevelsUS30 – Overview
The Dow Jones Industrial Average recorded a new all-time high (ATH) at 46,520, extending its rally as markets continue to digest supportive macro drivers.
Optimism around Federal Reserve rate-cut expectations, along with strong corporate earnings and upbeat U.S. economic data, keeps investor sentiment constructive.
Focus now turns to upcoming Fed commentary and economic releases, which could provide the next catalyst for fresh highs or a short-term pullback.
Bullish Scenario
Price remains in a strong bullish trend as long as it trades above the 46,470 pivot zone.
Targets: 46,620 → 46,760.
A confirmed 1H close above 46,620 would signal continuation toward higher extensions if momentum strengthens further.
Bearish Scenario
To shift momentum lower, price would need to close at least a 1H candle below 46,400.
Targets: 46,300 → 46,120 on sustained selling pressure.
Further weakness could follow if Fed officials adopt a more hawkish tone or if key data surprises to the upside, reducing rate-cut bets.
Pivot: 46,470
Resistance: 46,620 – 46,760
Support: 46,400 – 46,300 – 46,120
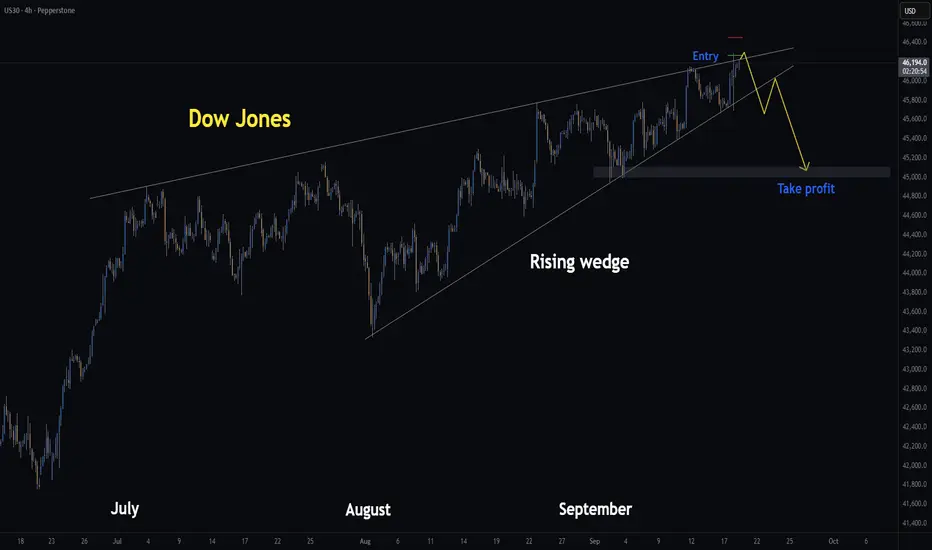
DowJones | H4 Rising Wedge | GTradingMethodHello Traders,
Yesterday I shared a short setup on the Dow Jones using the rising wedge pattern. I entered at 46,267 and exited with a small profit at 46,179. I exited because I did not like the reaction at that level and anticipating a better entry.
Today, I’m looking to re-enter if price reaches 46,343, which could form a potential double top on the chart.
🧐 Market Overview:
Rising wedges generally act as bearish reversal patterns, that said, the broader market remains bullish following the FOMC, so I’ll be risking less and proceeding with caution.
However, the VIX has been sitting near multi-month lows, which often precedes sharp moves. If volatility picks up post-FOMC, rising wedge patterns could act as early warning signs of a pullback.
So I am willing to risk a small amount and potentially be rewarded BIG!
📊 Trade Plan:
Risk/Reward: 6.7
Entry: 46,343
Stop Loss: 46,539
Take Profit 1 (50%): 45,000
Take Profit 2 (50%): 45,000
Also, if this plays out, I expect NAS and S&P to fall too which will likely drag crypto with it.
Thanks for checking out my post!
I would love to hear if you have any rising wedge trading tips? And if you are trading the Dow Jones or S&P today?
Please note: This is not financial advice. This content is to track my trading journey and for educational purposes only.
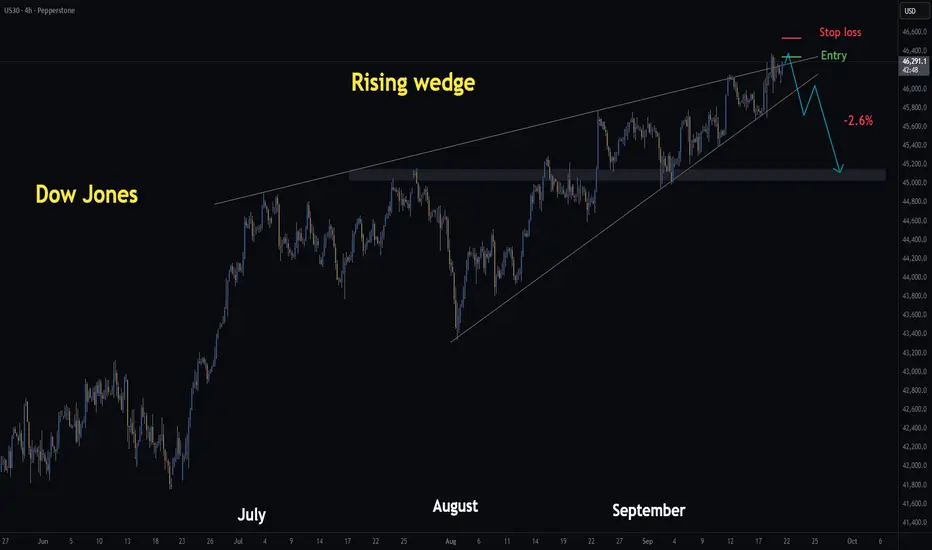
Dow Jones | H4 Rising Wedge | GTRadingMethod👋 Hello Traders.
Yesterday I mentioned I’d be watching for a breakout and retest setup — that plan still stands. However, I’ve also taken a short position off the diagonal resistance line.
🧐 Market Overview:
I’m currently seeing rising wedge structures across Nasdaq, S&P, Russell 2000, and Dow Jones. These patterns typically lean bearish, and I can’t ignore the confluence. That said, wedges can fail, and with the market leaning bullish after of the FOMC announcement, I’m aware this is swimming against the trend.
📊 Trade Plan:
Risk/Reward: 6.7
Entry: 46 267
Stop Loss: 46 450
Take Profit 1 (50%): 45 000
Take Profit 2 (50%): 45 000
(I’m already short from 46 267 and will look to add if price retests that level.)
💡 GTradingMethod Tip:
Bearish patterns like rising wedges can offer high R/R setups, but always remember — strong bullish backdrops (like major data events) can cause them to fail. Risk management is everything.
🙏 Thanks for checking out my post!
Make sure to follow me to catch the next idea and share your thoughts on what you think the markets will do today and how you would trade rising wedges :)
📌 Please note:
This is not financial advice. This content is to track my trading journey and for educational purposes only.
US30 buy order (5.72 RR)
Even though price did make a lower high , it has a higher low and when when price will reaches my order it means that bulls will be in charge of the market
Bullish price action will be validated when price reaches my level (higher highs , higher lows)
I will be targeting the new high made on Tuesday
Price went on a 2 day selloff after the new high
I have been waiting all week long for a trade (distracting myself with stocks ideas, need to stay in my jurisdiction)
The only clear setup I have seen this week
Price is creating a higher low on the 4h
Canceling order if price closes below 45 842.6 before triggering my order

Dow rolls over, shifting directional risksDirectional risks in the Dow Jones contract appear more balanced following the break of uptrend support earlier this week, a view supported by momentum indicators such as RSI (14) and MACD, which have also rolled over, delivering a neutral signal. More weight should be placed on price action in the near term rather than maintaining a specific bias.
If the price can hold above support at 45,762, longs could be established above the level with a stop beneath for protection, targeting the record high of 46,723 set earlier this month. Should the uptrend break lead to an extension of the bearish move beneath 45,762, the setup could be flipped, with shorts placed below the level and a stop above for protection. The 50DMA, 45,000 or 44,500 screen as potential targets.
Good luck!
DS

US30 – Key Pivot Zone Signals Next MoveUS30 – Overview
The Dow Jones remains under bearish momentum while trading below the 46,250 – 46,300 pivot zone, keeping pressure toward key supports.
📉 Bearish Scenario
Price targets a move toward 46,120 as long as it stays below 46,250 – 46,300.
🔻 A confirmed 1H close below 46,120 would strengthen the bearish trend, opening the path to 46,000.
📈 Bullish Scenario
If price pushes higher and achieves a 1H close above 46,300, bullish momentum would return, with upside targets at 46,400 and beyond.
Key Levels
Pivot: 46,250
Resistance: 46,300 – 46,400
Support: 46,120 – 46,000