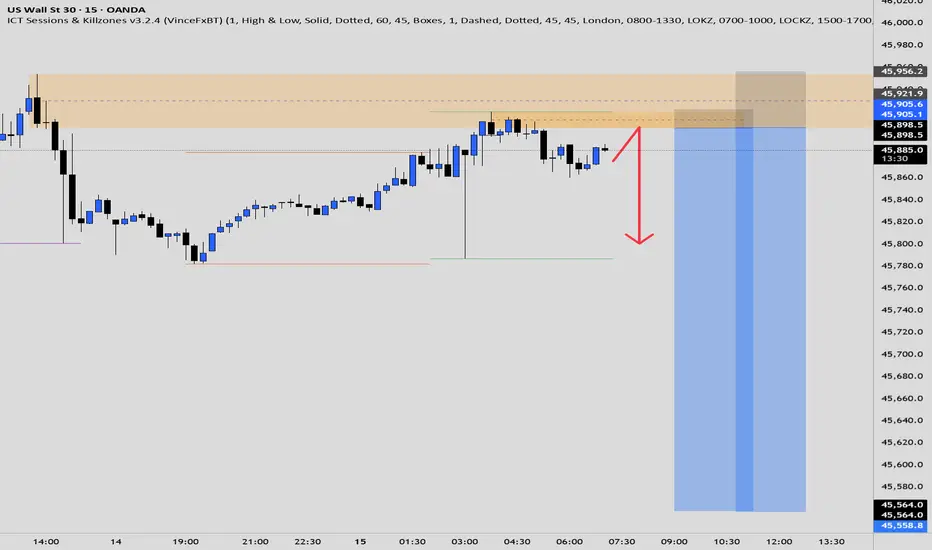
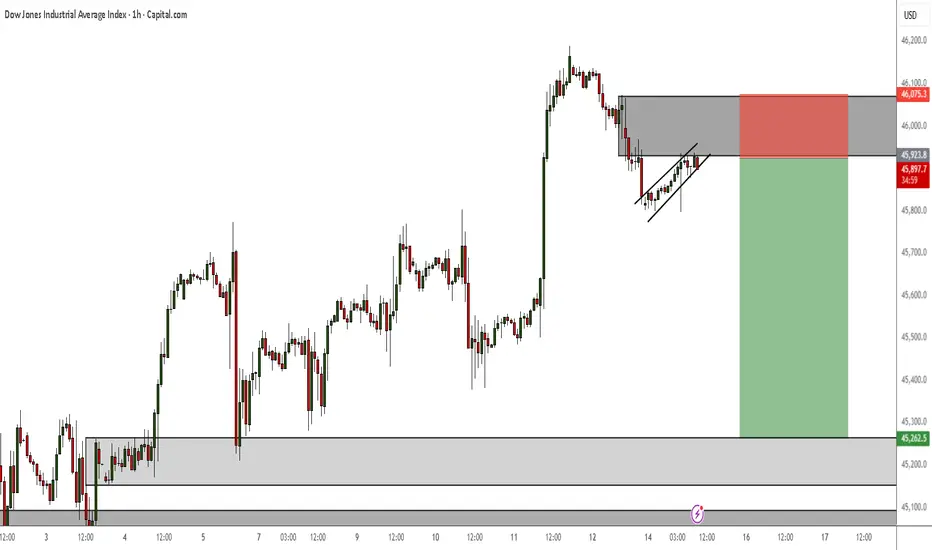
US30 ShortElite Analysis
Now we wait for price to come to us
Targeting lower liquidity pools
Executing 2 trades
US30FU trade ideas
US30 - Potential TargetsDear Friends in Trading,
Bull trend and HL series of demands remain intact despite FOMC week.
Let me know if anything is unclear.
I sincerely hope my point of view offers a valued insight.
Thank you for taking the time study my analysis.

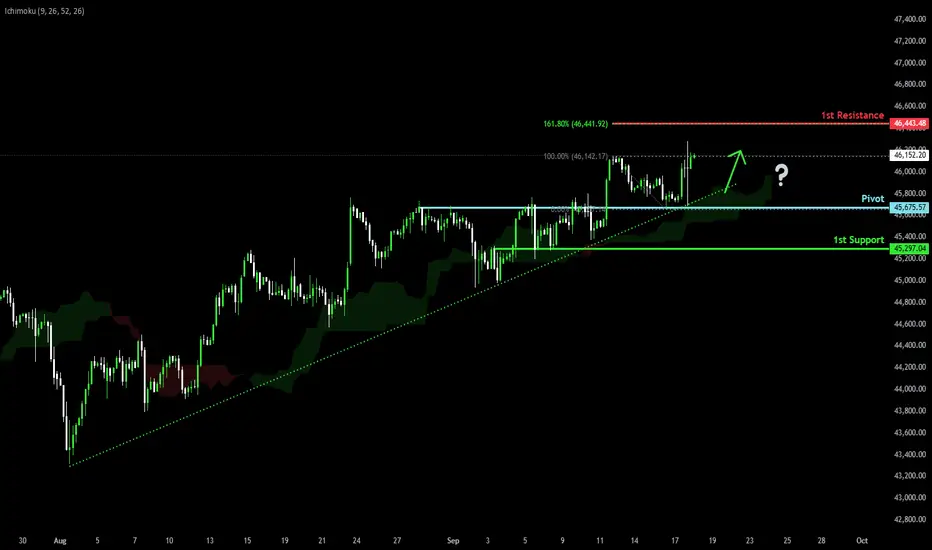
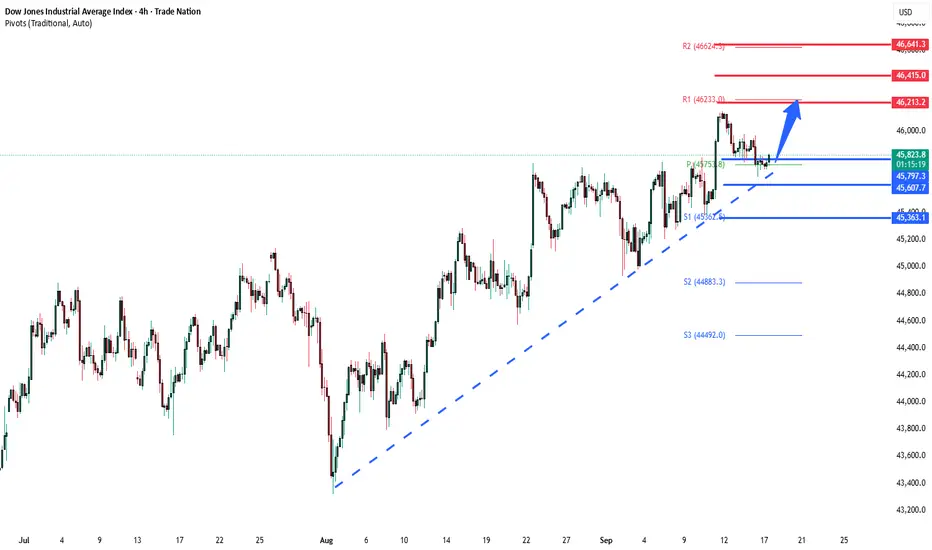
Bullish momentum to extend?Dow Jones (US30) has bounced off the pivot, which has been identified as a pullback support and could potentially rise to the 1st resistance which aligns with hte 161.8% Fibonacci extension.
Pivot: 45,675.57
1st Support: 45,297.04
1st Resistance: 46,443.48
Disclaimer:
The above opinions given constitute general market commentary, and do not constitute the opinion or advice of IC Markets or any form of personal or investment advice.
Any opinions, news, research, analyses, prices, other information, or links to third-party sites contained on this website are provided on an "as-is" basis, are intended only to be informative, is not an advice nor a recommendation, nor research, or a record of our trading prices, or an offer of, or solicitation for a transaction in any financial instrument and thus should not be treated as such. The information provided does not involve any specific investment objectives, financial situation and needs of any specific person who may receive it. Please be aware, that past performance is not a reliable indicator of future performance and/or results. Past Performance or Forward-looking scenarios based upon the reasonable beliefs of the third-party provider are not a guarantee of future performance. Actual results may differ materially from those anticipated in forward-looking or past performance statements. IC Markets makes no representation or warranty and assumes no liability as to the accuracy or completeness of the information provided, nor any loss arising from any investment based on a recommendation, forecast or any information supplied by any third-party.
DXY about to break down and send NAS and Gold higher?Full Analysis of DXY, XAG, XAU, WTI, NAS, S&P and DJ30. I go through my whole analysis for the day and week on the daily and the 1h timeframe applying my mutitimeframe approach and Stacey Burkes teachings to my whole basket.

Us30 Trade Set Up Sep 18 2025www.tradingview.com
Price has swept PDH and pushed down hard inverting 1h FVGs and creating a bearish 1h FVH so if price continues to make internal bearish structure i will look for sells down to PDH

DOW/US30 - TIME FOR A KILLTeam, we have not been trading DOW/US30 since last week's successful short
WHY, we wait for the rate decision to come out
NOW, investors' hope is invalid, no momentum for a rate cut
LETs short the beast at 46135-46160
STOP LOSS AT 46250- OR 46280
EASY TARGET AT 46117-46070 - take partial 50-70% and bring stop loss to BE
2ND TARGET at 45972-45955
LETS GO

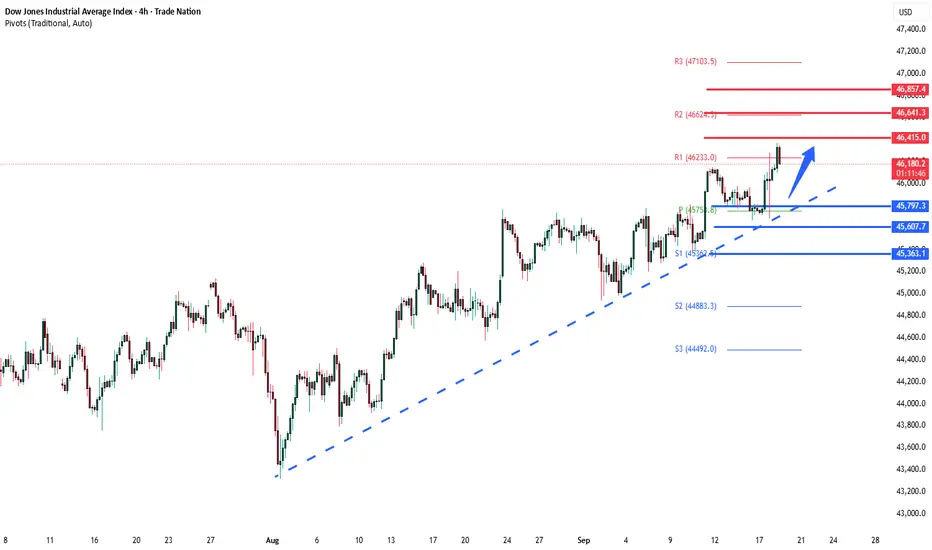
DowJones Key Tradin Levels - triple-witching dayKey Support and Resistance Levels
Resistance Level 1: 46415
Resistance Level 2: 46640
Resistance Level 3: 46860
Support Level 1: 45800
Support Level 2: 45600
Support Level 3: 45360
This communication is for informational purposes only and should not be viewed as any form of recommendation as to a particular course of action or as investment advice. It is not intended as an offer or solicitation for the purchase or sale of any financial instrument or as an official confirmation of any transaction. Opinions, estimates and assumptions expressed herein are made as of the date of this communication and are subject to change without notice. This communication has been prepared based upon information, including market prices, data and other information, believed to be reliable; however, Trade Nation does not warrant its completeness or accuracy. All market prices and market data contained in or attached to this communication are indicative and subject to change without notice.


DowJones Key Trading LevelsKey Support and Resistance Levels
Resistance Level 1: 46415
Resistance Level 2: 46640
Resistance Level 3: 46860
Support Level 1: 45800
Support Level 2: 45600
Support Level 3: 45360
This communication is for informational purposes only and should not be viewed as any form of recommendation as to a particular course of action or as investment advice. It is not intended as an offer or solicitation for the purchase or sale of any financial instrument or as an official confirmation of any transaction. Opinions, estimates and assumptions expressed herein are made as of the date of this communication and are subject to change without notice. This communication has been prepared based upon information, including market prices, data and other information, believed to be reliable; however, Trade Nation does not warrant its completeness or accuracy. All market prices and market data contained in or attached to this communication are indicative and subject to change without notice.
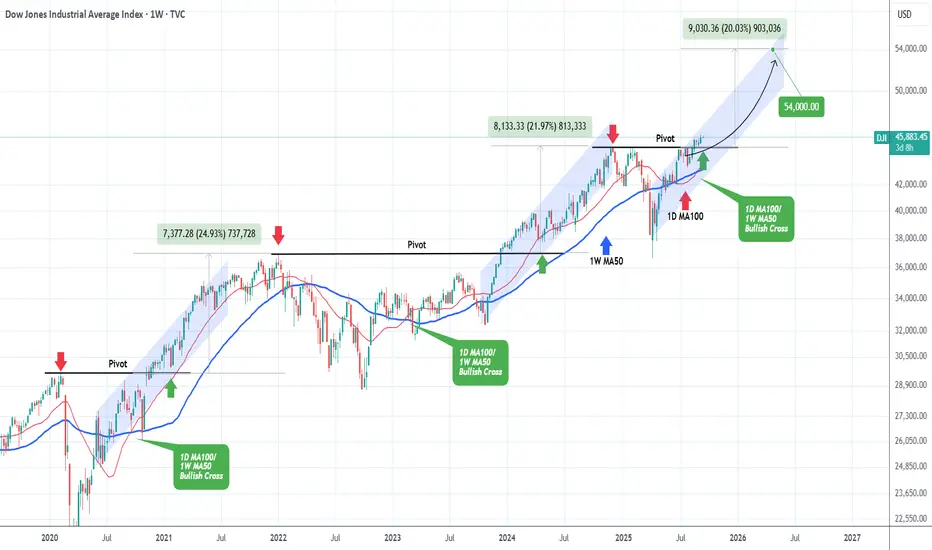
DOW JONES The Cyclical Pivot that MUST hold.Last week (Sep 03, see chart below) we gave a buy signal on Dow Jones (DJI) right at the bottom of its medium-term Channel Up, which quickly hit our 46100 Target:
This time we switch to a much wider and longer term outlook on the 1W time-frame as we are just a day before the Fed Rate Decision. The index has been trading within a strong Channel Up ever since the April 07 2025 market bottom, product of the Trade War correction early in 2024.
The 1D MA100 (red trend-line) crossed above the 1W MA50 (blue trend-line) forming a peculiar Bullish Cross, which interestingly enough, it is the 3rd time we see it since September 2020.
As a result, it is highly critical and as you can see, after such cross, the 1W MA50 has historically led the index higher.
What is perhaps even more critical however is the Pivot trend-line, which is essentially the former All Time High (ATH) turned into Support for the Channel Up pattern that have pushed the market higher since 2020.
As you can see, that level always held and the two rallies that we've had on the pattern like the current one, completed +25% and +22% rallies above it before an eventually correction that broke below the 1W MA50.
As a result, we could see another +20% rise at least, translating into a 54000 long-term Target, as long as both the 1W MA50 and the Pivot hold.
-------------------------------------------------------------------------------
** Please LIKE 👍, FOLLOW ✅, SHARE 🙌 and COMMENT ✍ if you enjoy this idea! Also share your ideas and charts in the comments section below! This is best way to keep it relevant, support us, keep the content here free and allow the idea to reach as many people as possible. **
-------------------------------------------------------------------------------
💸💸💸💸💸💸
👇 👇 👇 👇 👇 👇
DowJones Key trading levels ahead of Fed rate decisionKey Support and Resistance Levels
Resistance Level 1: 46210
Resistance Level 2: 46415
Resistance Level 3: 46640
Support Level 1: 45800
Support Level 2: 45610
Support Level 3: 45360
This communication is for informational purposes only and should not be viewed as any form of recommendation as to a particular course of action or as investment advice. It is not intended as an offer or solicitation for the purchase or sale of any financial instrument or as an official confirmation of any transaction. Opinions, estimates and assumptions expressed herein are made as of the date of this communication and are subject to change without notice. This communication has been prepared based upon information, including market prices, data and other information, believed to be reliable; however, Trade Nation does not warrant its completeness or accuracy. All market prices and market data contained in or attached to this communication are indicative and subject to change without notice.
US30 LONG/BUY Hello there
Looks like a high probability trade is forming on US30
1. Regular flat formation
2. MACD divergence 1HR TF forming
3. 3 WAVE corrective structure
4. 61.8 FIB retracement of impulsive move
Strategy: Entry at 61.8 FIB retracement entry
Entry: Current Market Price/ 45641 (little gap left)
Stop Loss: 45391
Take Profit: 46300
Trade with care
God Bless you

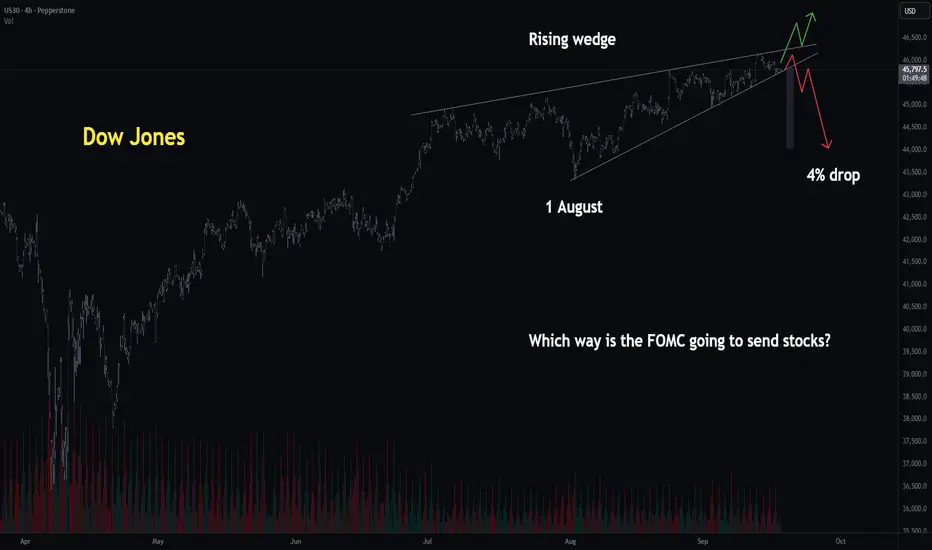
Dow Jones | H4 Rising Wedge | GTradingMethodHello everyone who reads this,
The big question on everyone’s mind: Which way will the FOMC interest rate decision send stocks and gold?
Here’s my two cents and how I plan to approach it.
🧐 Market Overview:
I’m seeing rising wedges on both the Dow Jones and the S&P500 across multiple timeframes. Rising wedges typically lean bearish.
Dow Jones: To play it safe, I’ll wait for a break + retest. If it breaks down, I’ll wait for the retest and then look to go short and vice a versa on the long side.
FOMC generally causes a lot of volatility and I don't want to get whipsawed around, hence I am taking a more conservative approach by trading the retest, which might only happen tomorrow.
S&P500: The hourly rising wedge has already broken to the downside. On the retest, I’ll be watching for short setups. If the retest holds, it would also confirm a double top, which adds further confluence.
If stocks break down on FOMC, expect BTC and alts to feel the pressure.
🙏 Thanks for checking out my post! It would be great to hear what your thoughts are about the interest rate decision and what trades you are looking at. Lets make money together!
📌 Please note: This is not financial advice. This content is to track my trading journey and for educational purposes only.
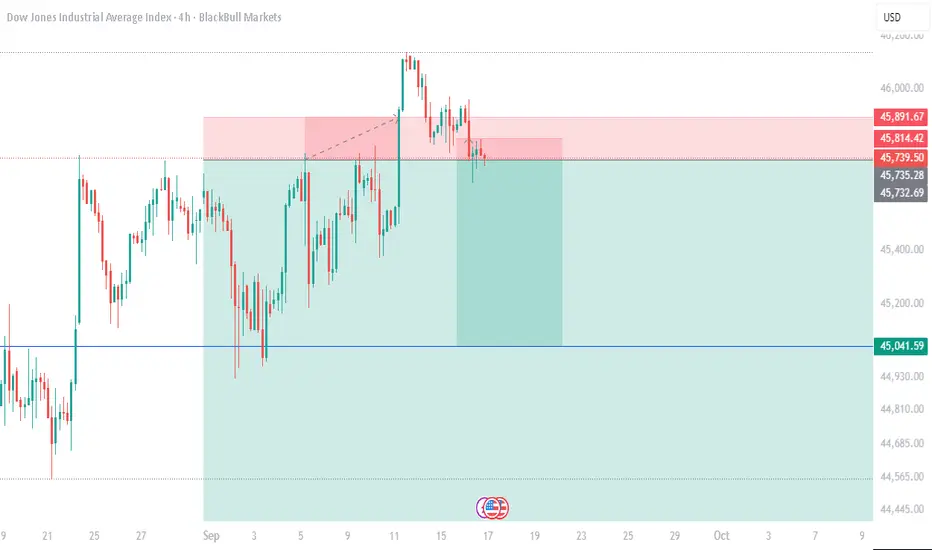
US30 Consolidates Ahead of Fed – Key Range 46,000 to 45,680US30 – Technical Overview
The Dow Jones continues to consolidate between 46,000 and 45,680 as traders await the Federal Reserve’s rate decision later this week.
Markets largely expect a 25 bps cut, but the key driver will be Chair Powell’s guidance on inflation, labor-market softness, and tariff risks—factors that could spark a breakout from the current range.
Technical Outlook
📉 Support test
Price remains inside a consolidation zone and is expected to retest 45,680 before attempting a rebound.
📈 Bullish continuation
A bounce from support could drive price back to 46,000, with a breakout above this level targeting 46,125.
A sustained move above 46,125 would open the path for a new ATH near 46,250 → 46,430, especially if the Fed signals a more dovish stance.
Key Levels
Pivot: 45,910
Resistance: 46,000 – 46,125 – 46,250
Support: 45,680 – 45,500
previous idea:

US30 AnalysisI expect US30 to remain bearish this week. Current price action suggests weakness, with momentum favoring sellers. If market conditions hold, we may see a continuation to the downside, and today’s session is also likely to close bearish. A short position looks favorable at this point, but as always, risk management is key.
XAUUSD long idea for 4hr playout looking at this setup to playout as we seem to be in CSD range and are coming from the lower bands of the CSD. Next two sessions should play out with something like this.

US30Success in forex and stocks comes from a combination of knowledge, discipline, and patience. Understanding market trends, economic factors, and company
fundamentals is crucial, but equally important is controlling emotions and sticking to a well-planned strategy. Continuous learning, adapting to changing conditions, and managing risk wisely can turn opportunities into consistent growth over time.
Consistency, not luck, separates successful traders from the rest.
Dow Jones: Market Ready for a New Upward ImpulseMarket Overview:
The Dow Jones Index is holding above the key support zone of 45,100–45,200, forming a bullish structure. After a consolidation phase, the index is showing signs of an upside breakout.
Technical Signals:
Fibonacci levels point to potential growth toward 46,100, 46,350, and 46,700.
EMA 144 supports the bullish scenario, staying below the current price.
AO indicator is turning positive, confirming strengthening bullish momentum.
Key Levels:
Support: 45,100 – 45,200
Resistance: 46,100 – 46,700
Scenario:
The main scenario remains bullish — if the index consolidates above 45,600, we expect growth toward 46,100–46,700. The alternative scenario is a breakdown below 45,100, which could lead to a move toward 44,800.

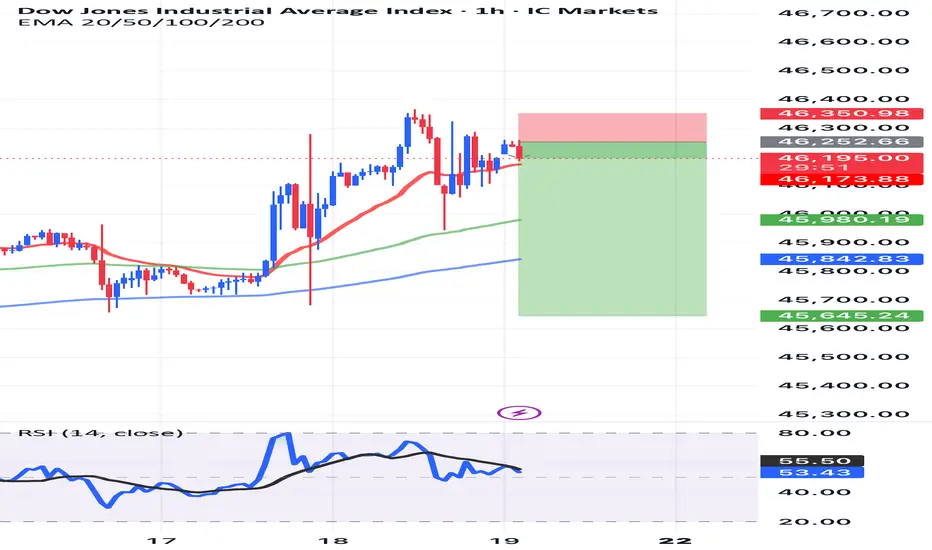
US30 – Rejected at 46,145, Holding Above 45,700 SupportThe Dow Jones Index faced rejection near the 46,145 resistance and is now pulling back toward the 45,700 support zone. Price action here will determine whether buyers can sustain momentum or if sellers push lower.
Support at: 45,700 / 45,000 / 44,000 🔽
Resistance at: 46,145 🔼
🔎 Bias:
🔼 Bullish: Holding above 45,700 could lead to another retest of 46,145, with a breakout opening room for higher highs.
🔽 Bearish: A break below 45,700 would shift focus toward 45,000, and further weakness could target 44,000.
📛 Disclaimer: This is not financial advice. Trade at your own risk.

Dow Jones is in a Bearish CorrectionThe downside correction for US30 will also continue as DXY pushes up this week.
Currently on M15 TF I am seeing a bearish correction pattern for shorting.
US30Success in forex and stocks comes from a combination of knowledge, discipline, and patience. Understanding market trends, economic factors, and company fundamentals is crucial, but equally important is controlling emotions and sticking to a well-planned strategy. Continuous learning, adapting to changing conditions, and managing risk wisely can turn opportunities into consistent growth over time. Consistency, not luck, separates successful traders from the rest.

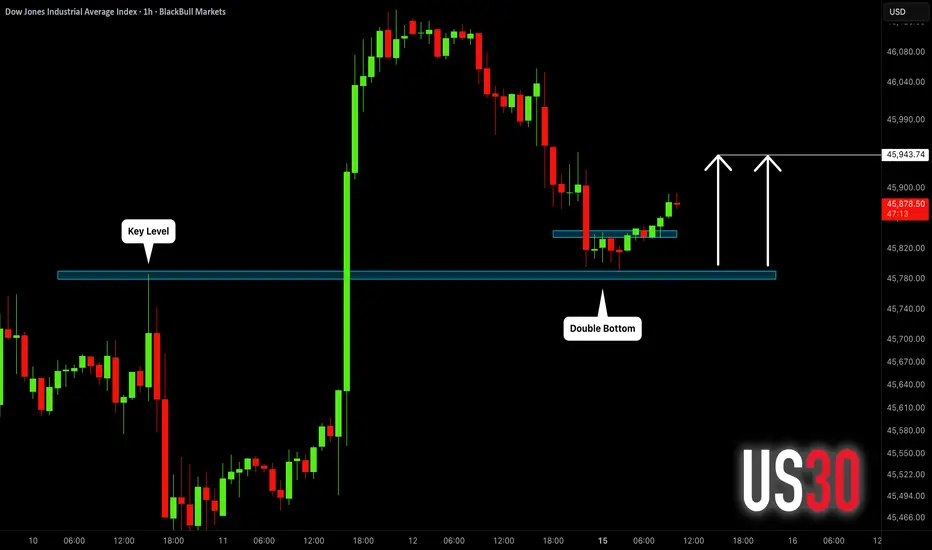
DOW JONES (US30): Pullback From Support Confirmed
Following our Friday's analysis, US30 retested a recently broken
major daily demand zone.
Testing the underlined horizontal key level, the price formed a tiny double bottom.
Its neckline breakout indicates a highly probably pullback.
Goal - 45940
❤️Please, support my work with like, thank you!❤️
I am part of Trade Nation's Influencer program and receive a monthly fee for using their TradingView charts in my analysis.
Bye Bye - Dow & IndicesThis is not financial advice but a 100% true method of market structure and what to expect in the future. Watch and see.... Believe it or not!
