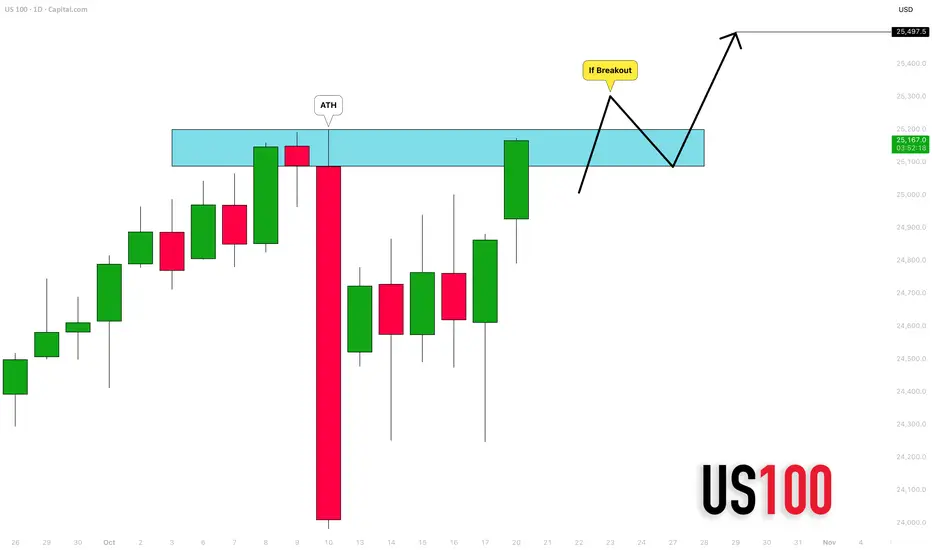
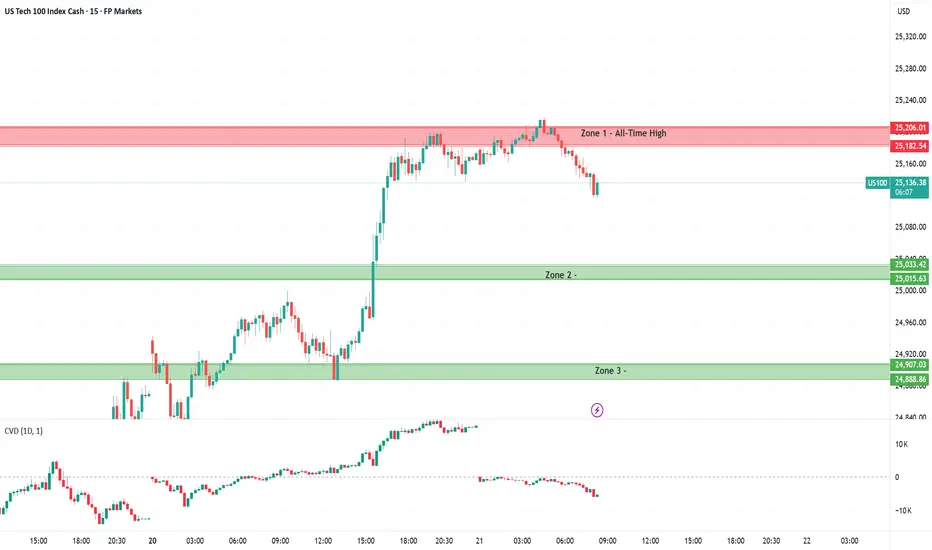
US100 on the Edge – Will Bulls Finally Break the All-Time HighZone 1: All-Time High / Major Supply Zone
This area represents the top of the market structure and the current all-time high region. Price has tested this level multiple times, forming a tight consolidation directly beneath it. This behavior indicates strong buying pressure but also clear absorption from sellers. Until the market shows a decisive breakout with volume confirmation, this zone acts as a heavy supply level. Traders should be cautious — breakouts near all-time highs often trigger fake moves before continuation.
Zone 2: Short-Term Demand / Breakout Retest Zone
Zone 2 marks the first layer of demand formed after the most recent breakout attempt. Buyers have consistently stepped in here to defend structure, suggesting it’s a valid short-term support area. If price remains above this level, the bullish structure remains intact. However, a clean break below Zone 2 would likely open the door for a retracement toward Zone 3.
Zone 3: Strong Demand / Breakout Base
This zone represents the base of the breakout — Monday’s low — where buyers aggressively entered and drove price upward through prior resistance. It’s a key liquidity pocket and the foundation of the current move. As long as the market holds above this zone, the bullish bias remains valid. A break below, however, would signal that momentum has faded and could trigger a deeper correction.
Sentiment
After a strong start to the week, the Nas100 is trading with a tone of cautious optimism. Monday’s momentum carried into Tuesday as easing US–China trade tensions and solid performances from major tech names helped maintain positive sentiment. However, with the index hovering near record highs, investors have turned more selective and defensive.
The broader market tone remains constructive — risk appetite is still present, but confidence is fragile. Many traders are waiting for fresh catalysts from corporate earnings and macro data to confirm whether the recent rally has more room to run. The ongoing US government shutdown continues to cloud visibility, delaying key data releases and adding an element of uncertainty.
Overall, sentiment around the Nas100 is positive but tentative: the market is stable and supported by tech strength and improved trade signals, yet stretched valuations and the lack of new macro clarity keep investors cautious at the top.
Trade ideas
20 OCT 2025: US100 MARKET RECAPSTUDY!!
WELCOME TO MY ONLINE JOURNAL
DISCLAIMER:
The owner of this page is an authorised Representative under supervision of TD MARKETS (PTY) LTD, an authorised Financial Services Provider (FSP No. 49128) licensed by the Financial Sector Conduct Authority (FSCA) under the Financial Advisory and Intermediary Services Act (FAIS).
The FSP is licensed to provide advice and intermediary services in respect of Category I financial products, including but not limited to derivative instruments, long-term deposits, and short-term deposits.
All investment ideas are provided in accordance with the scope of the FSP's license and applicable regulatory requirements. Derivative instruments is a leveraged products that carry high risks and could result in losing all of your capital, and past performance is not indicative of future results.
This idea and any attachments are informational/education and does not constitute a recommendation to buy/sell.
No guarantee is made regarding the accuracy or outcome of this trade idea.
If you choose to accept this idea, please do so at your own risk.

NASDAQ 100 MID-WEEK OPINION SHARING by MrPhotonIt still hasn't broken the all-time high level. In line with the latest news, I expect a 2%-2.3% correction in the first stage. If the price breaks the uptrend channel and falls below 24300, it is likely to consolidate IG:NASDAQ .

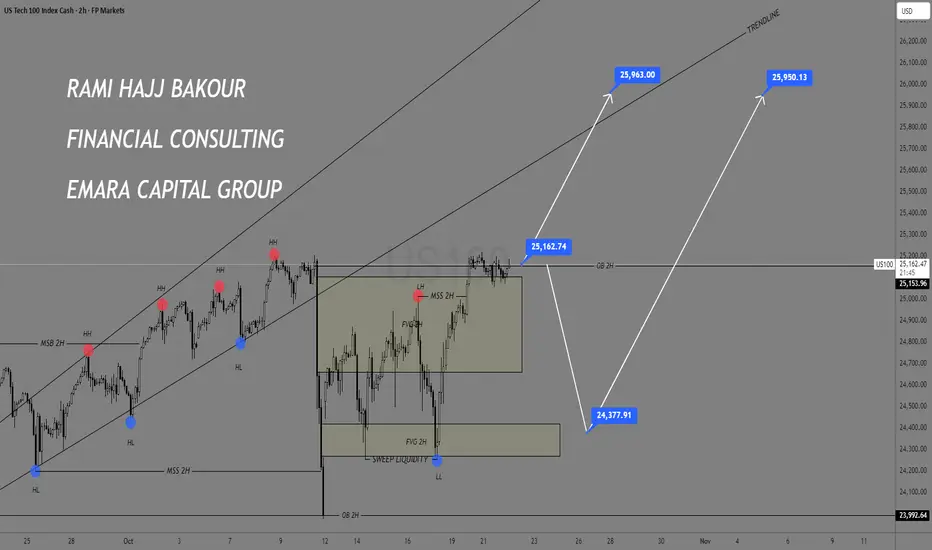
NASDAQ 100 (US100) Technical Analysis
The Nasdaq is moving within a rising channel on the 2H timeframe, after sweeping liquidity from previous lows and rebounding from the FVG 2H demand zone.
The likely scenario is a continuation of the bullish move toward 25,960 – 26,000, aligning with the upper trendline and potential resistance area.
However, a failure to hold above 25,160 may trigger a corrective pullback toward 24,380 before any renewed bullish momentum.
📊 Fundamental Outlook:
The Nasdaq remains supported by stable U.S. bond yields and easing Fed tightening expectations, along with positive earnings from major tech firms.
However, slower growth in parts of the tech sector and upcoming inflation data could temporarily limit further upside momentum.
📅 Short-term Bias: Bullish
🎯 Upside Targets: 25,960 – 26,000
📉 Pullback Target: 24,380
⛔ Invalidation Level: Below 23,990
#US100 #NASDAQ #TechnicalAnalysis #EmaraCapital #Rami_Hajj_Bakour #Trading #Markets
Bearish outlook on nasdaq Price to put the previous engineered liquidity, I would expect to see price fall lower to take out the origin of the move that went to take out the engineered bearish liquidity

QQQ - NASDAQ Has Never Been This ExpensiveQQQ relative to the money supply reveals that markets have never been this expensive in history. Despite the significant amount of money pumped in during the COVID-19 pandemic, the economy has not kept pace with all the zeros added to Gov debt.
If we can't lower deficits now at max employment, when will we?
Tulips!
Caution is in order despite what "experts" may tell you.
Click like Follow Subscribe, let's get to 5,000 followers.

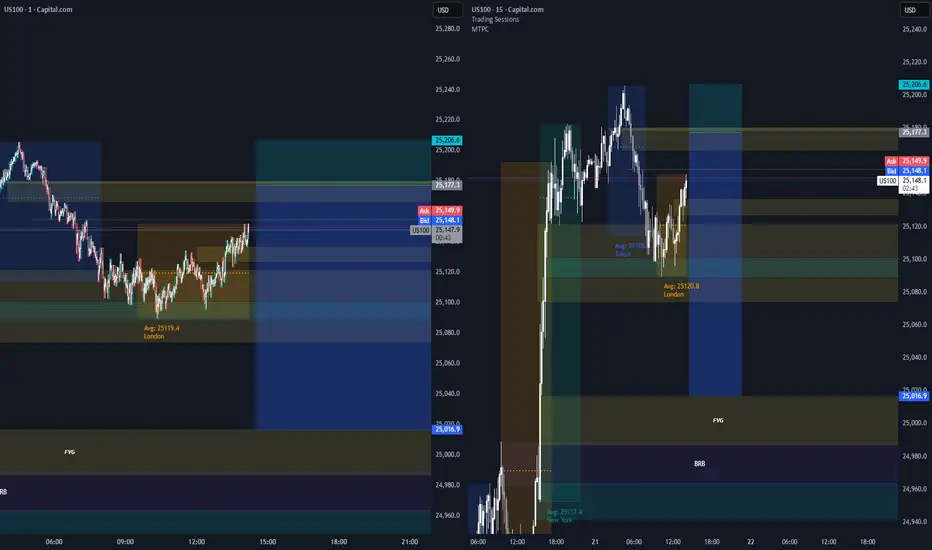
NAS100USD GOLD MIRROR EQ.1) NAS100USD — SNIPER ZONES (live levels from your charts)
Context: previous-week pivots you provided earlier (Tuesday/Thursday) and current price ~ 25,185.
Key levels (use these to draw horizontal zones on 1D / 4H / 1H / 15m)
Pivot Resistance (Prev Tue High): 25,228 (R1)
Immediate Resistance cluster: 25,250 – 25,300 (R2)
Current Bias / Mid: 25,185 (mid)
Support (session swing): 24,800 – 24,750 (S1)
Lower structural support (Prev Thurs Low): 23,998 (S2)
Draw these on 1D and 4H. On 1H/15m use the exact same horizontal lines and highlight the small intraday confluence zones inside them.
A — Bullish Sniper (Breakout + Pullback)
Trigger: Price closes above 25,228 on 15m or 1H and then pulls back into 25,150–25,200 zone (confluence: fib, VWAP or 1H/15m trendline).
Entry: Limit buy in 25,150–25,200 on the pullback (or market on confirmed rejection of the zone).
Stop: 25,100 (15–50 pts below entry depending timeframe; typical stop = 25–50 pts).
TP ladder:
TP1 = +30 pts → ~25,180–25,230 (close partial)
TP2 = +60 pts → ~25,260–25,320 (second partial)
TP3 = +100 pts → ~25,350–25,400 (final take)
R:R guideline: Aim ≥2.5:1 on full ladder (scale out).
Confirmation: Finviz breadth green & TimeMirror projection from Gold (see gold confirmation below) → increase size.
B — Bearish Sniper (Breakdown + Retest)
Trigger: Clear break and close below 24,800 with momentum OR rejection at 25,250 fails and price falls back under 24,800.
Entry: Sell on retest of 24,800–24,770 (rejection candle on 15m/1H).
Stop: 25,020 (approx 220 pts above, tighten for intraday to 25,000 if aggressive).
TP ladder:
TP1 = 24,500 (-30–50 pts)
TP2 = 24,200 (-100 pts)
TP3 = 23,900 (target S2 area)
Risk control: If CFTC shows net-long expanding (small-cap strength) or Finviz breadth strongly bullish, skip or reduce size.
C — Intraday Micro-Sniper (15m / 5m)
Range play between 25,228 and 24,800.
Entries: Look for wick rejections at zone edges on M15/M5. Tight stops (10–20 pts). TP small (20–40 pts). Only 1–2 units max per day.

take asia? nihaumaybe we can take out asia high today and revers?? double top out of the playbook like so many gurus wil say
full margin full risk best of luck to everybody we'll see in a moment

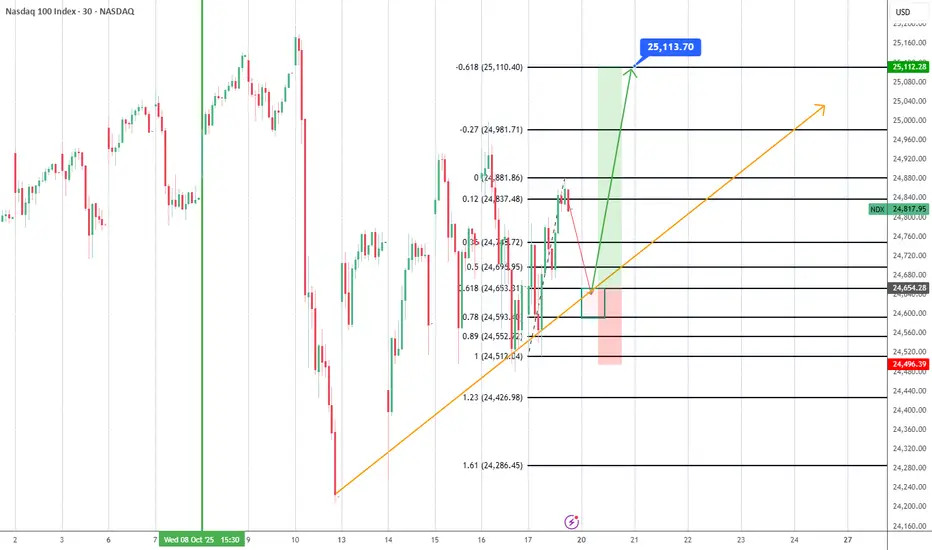
Will the second scenario come true? |October 17 2025Based on the evidence, price action, and fundamental news, it seems the second scenario is about to play out.
The Nasdaq index turned positive after recovering its losses when Trump responded “No” to a question about whether he would maintain the heavy tariffs on China.
From today, my outlook is bullish until the previous high gets hunted — after that, I’ll reassess whether we’re likely to see further downside or if the bullish outlook should remain.
If market conditions shift and a continuation of the downtrend becomes more likely, we can take a solid short position next week to catch the move.
But for now, my bias is bullish, and the second scenario will likely play out.
If price reaches the second high I marked in blue, we’ll probably see a reaction from that zone.
If I open a trade, I’ll share it with you.

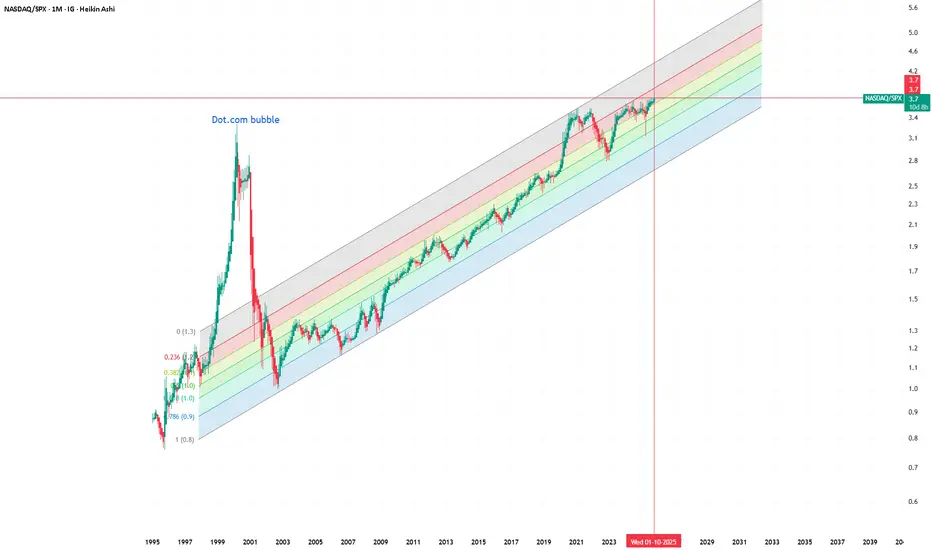
NASDAQ/SPX – Are We Really in an AI Bubble?This chart compares NASDAQ to the S&P 500 (NASDAQ/SPX) on a monthly timeframe, visualized with Heikin Ashi candles and a logarithmic regression channel for long-term context. It highlights the dot-com bubble, where the ratio reached extreme overvaluation levels far above the regression mean.
Recently, many investors have been calling the current market an “AI bubble.” However, when viewed through this historical lens, the ratio still remains within the long-term growth channel and far below the excesses of the early 2000s. This perspective suggests that, at least relative to the broader market, tech doesn’t appear to be in bubble territory yet.
It would still be valuable to compare the composition of the NASDAQ today versus in 2000, as the market structure has changed dramatically — with more diversified revenue streams, profitability, and balance sheet strength. Without this data, one can only speculate. But visually, this ratio helps challenge the popular narrative of an ongoing bubble and invites a more nuanced discussion about valuation, innovation cycles, and sector dominance.
#NASDAQ #SPX #Macro #Tech #AIbubble #DotCom #LongTerm #RatioAnalysis #HeikinAshi #MarketCycle
US NAS 100Preferably suitable for scalping and accurate as long as you watch carefully the price action with the drawn areas.
With your likes and comments, you give me enough energy to provide the best analysis on an ongoing basis.
And if you needed any analysis that was not on the page, you can ask me with a comment or a personal message.
Enjoy Trading ;)

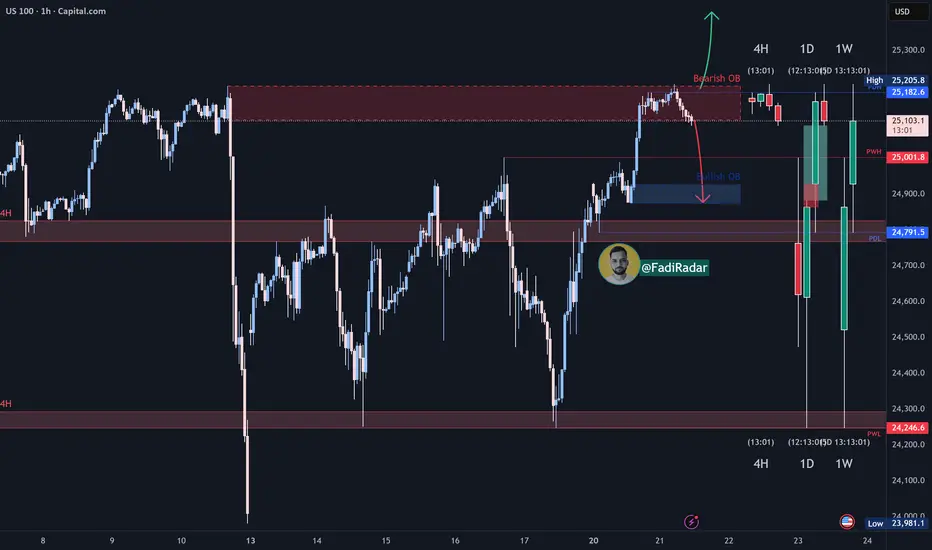
Nas100 Trade Set Up Oct 21 2025Price took PDH and is currently failing to break out of a strong daily resistance area so i will be looking for sells towards 4h FVG and SSL

Nasdaq short I think nq is going to go down and a retest in to that lower area is needed for a refuel to the upside.

USNAS100 – Overview | Bearish Correction From ATH ZoneUSNAS100 – Overview | Bearish Correction From ATH Zone
USNAS100 reached a new all-time high but has now stabilized below the supply zone, suggesting a bearish correction phase.
As long as price stays below 25,180, the index remains under pressure toward 25,035 → 24,960 → 24,860.
🕯 Technical View
A 1H close above 25,230 would shift momentum bullish, targeting 25,400 → 25,600.
Pivot: 25,180
Bias: Bearish below 25,180

US100 shortlooks like that the market wants to "fight" against the liquidity that has been built yesterday... NY-opening I love u <3 xD
NASDAQ ready to continue up.We are positioning for long entries in the Nasdaq, anticipating that the VIX will continue its decline toward calmer levels at Monday’s open. This aligns with the observed rotation out of defensive sectors and the increasing risk appetite in cyclical and growth-oriented sectors.
The setup suggests a risk-on environment, with potential for sectoral leadership shifts favoring tech and high-beta equities, as implied volatility contracts and market sentiment improves.
NAS100 H4 | Bullish Bounce from Key SupportNAS100 is falling towards the buy entry at 24,804.95, which is an overlap support that is slightly below the 38.2% Fibonacci retracement and could bounce from this level to the upside.
Stop loss is at 24,423.43, which is a pullback support.
Take profit is at 25,500.67, which lines up with the 127.2% Fibonacci extension.
High Risk Investment Warning
Trading Forex/CFDs on margin carries a high level of risk and may not be suitable for all investors. Leverage can work against you.
Stratos Markets Limited (tradu.com ):
CFDs are complex instruments and come with a high risk of losing money rapidly due to leverage. 65% of retail investor accounts lose money when trading CFDs with this provider. You should consider whether you understand how CFDs work and whether you can afford to take the high risk of losing your money.
Stratos Europe Ltd (tradu.com ):
CFDs are complex instruments and come with a high risk of losing money rapidly due to leverage. 66% of retail investor accounts lose money when trading CFDs with this provider. You should consider whether you understand how CFDs work and whether you can afford to take the high risk of losing your money.
Stratos Global LLC (tradu.com ):
Losses can exceed deposits.
Please be advised that the information presented on TradingView is provided to Tradu (‘Company’, ‘we’) by a third-party provider (‘TFA Global Pte Ltd’). Please be reminded that you are solely responsible for the trading decisions on your account. There is a very high degree of risk involved in trading. Any information and/or content is intended entirely for research, educational and informational purposes only and does not constitute investment or consultation advice or investment strategy. The information is not tailored to the investment needs of any specific person and therefore does not involve a consideration of any of the investment objectives, financial situation or needs of any viewer that may receive it. Kindly also note that past performance is not a reliable indicator of future results. Actual results may differ materially from those anticipated in forward-looking or past performance statements. We assume no liability as to the accuracy or completeness of any of the information and/or content provided herein and the Company cannot be held responsible for any omission, mistake nor for any loss or damage including without limitation to any loss of profit which may arise from reliance on any information supplied by TFA Global Pte Ltd.
The speaker(s) is neither an employee, agent nor representative of Tradu and is therefore acting independently. The opinions given are their own, constitute general market commentary, and do not constitute the opinion or advice of Tradu or any form of personal or investment advice. Tradu neither endorses nor guarantees offerings of third-party speakers, nor is Tradu responsible for the content, veracity or opinions of third-party speakers, presenters or participants.

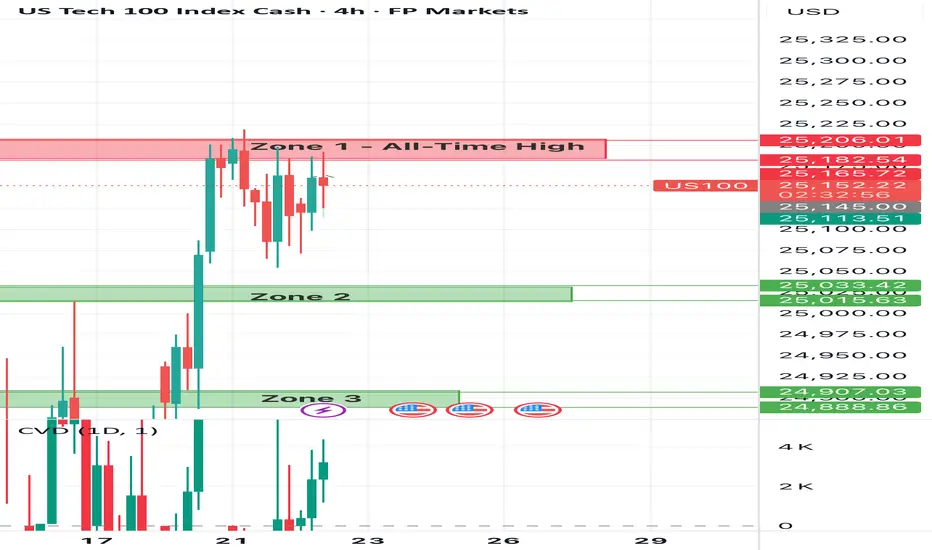
NASDAQ (US100) Analysis:The NASDAQ index recently tested its all-time high and is now showing signs of a potential corrective pullback after a strong bullish run.
📉 Expected scenario:
The price may retrace toward the 24,900 demand zone, which serves as an important support area.
If the index bounces from this level, it could resume its upward movement to form a new high.
However, if the price breaks below 24,900 and holds, a deeper move toward 24,600 is likely.
📈 Best buy zone: On a confirmed rebound from 24,900
📍 Best sell zone: On a confirmed rebound from 25,100, or Below 24,900 after confirmation
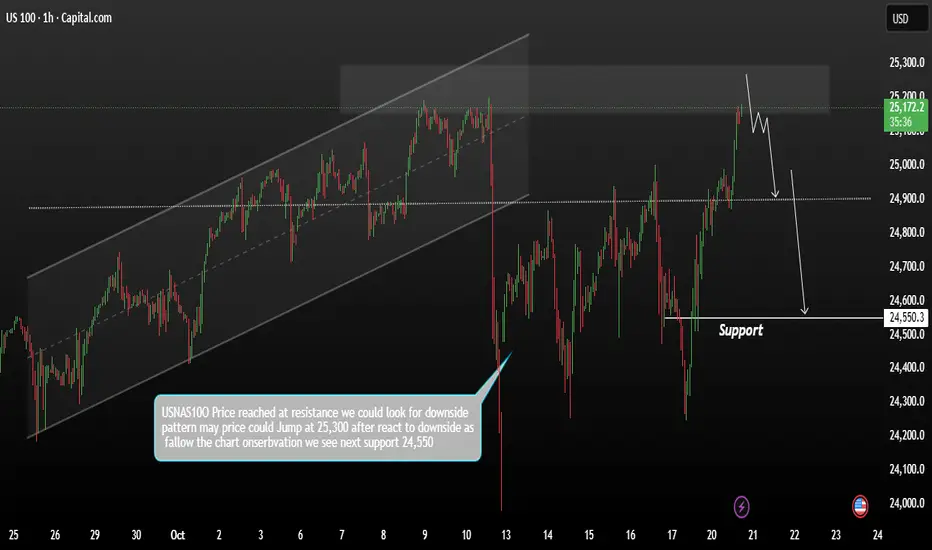
USNASDAQ100 Consolidation to downside correctionThe NASDAQ 100 started the week on solid ground, supported by gains in mega-cap stocks. However, investor sentiment remains cautious ahead of a wave of corporate earnings and a critical inflation report, both of which could determine the next major market move.
🔍 Outlook
If sellers maintain control, the USNAS100 could correct toward 25,300 initially. A break below this level would open the door toward the 24,550 support area. However, a rebound from 25,300 could trigger a short-term recovery — but the broader outlook remains bearish unless price regains ground above 26,000.
You may find more details in the chart.
Trade wisely best of Luck Buddies.
Ps; Support with like and comments for better analysis Thanks for Supporting.
US100: Needs a healthy pullback before breaking highs🧭 SKILLING:US100 (30-Min Chart) – The Market Needs a Pause Before the Breakout
After a strong recovery from the 24,200 area , the US100 has shown an impressive upward acceleration, forming a steep speed line that pushed price back toward the previous highs around 25,150 – 25,250 — a major resistance zone where sellers previously dominated.
However, as price reaches this area, the bullish momentum is starting to fade. Smaller candles and indecisive movements reveal hesitation — buyers are still in control, but the strength that carried the market this far is beginning to weaken.
If we look closely at the market structure, it’s clear that the index has been trying to reclaim the entire prior range, but that effort hasn’t come easy. After such a fast rally, the market looks overextended, and bulls may need a healthy pullback to gather enough energy for a real breakout.
________________________________________
🔍 Technical Outlook
• The 25,150 – 25,250 zone remains the key resistance area. If price keeps getting rejected here, short-term sellers might step in.
• A corrective move toward 24,850 – 24,950 (the pink zone) would not be surprising.
• That area should be watched closely — if buyers defend it strongly, it could become the launchpad for another push toward new highs.
________________________________________
🎯 Personal View
The overall structure still favors the bullish side, but momentum needs a reset.
A short-term pullback shouldn’t be seen as weakness — it’s an opportunity for the market to rebalance before the next leg up.
If the 24,850 zone holds, the probability of a true breakout above 25,250 increases significantly, potentially opening room toward 25,400 – 25,500 in the next sessions.
________________________________________
💬 In summary:
The US100 has worked hard to reclaim lost ground, but breaking above the previous top will require fresh momentum. A short-term correction could be exactly what the market needs to build a stronger foundation for a sustainable rally.
Please like and comment below to support our traders. Your reactions will motivate us to do more analysis in the future 🙏✨
Harry Andrew @ ZuperView

US100 Consolidates Below All-Time Highs-Can Bulls Break Through?US100 – 4H Technical Zone Analysis
Zone 1: All-Time High
This area represents the current all-time high and a clear supply zone where sellers previously absorbed aggressive buying pressure. It remains the strongest resistance in the current structure, a breakout above must be confirmed by sustained acceptance and volume before it can be trusted. Otherwise, this level continues to offer short opportunities or liquidity traps for late buyers.
Zone 2: Key Demand
This zone served as resistance before the most recent breakout and now acts as the first layer of demand. It’s a technical “flip zone,” where buyers stepped in to defend structure after the breakout attempt. As long as price holds above Zone 2, short-term bullish momentum remains valid. A clean break back below, however, would suggest a failed breakout and likely pull price toward deeper liquidity below.
Zone 3: Strong Buy Zone
This zone represents Monday’s low, the point where buyers stepped in decisively and drove the breakout move higher. It’s effectively the foundation of the current leg up and acts as a strong demand pocket created by institutional buying. As long as price remains above this area, market structure stays firmly bullish. A clean break below would invalidate the recent bullish impulse and indicate weakening buyer control.
Today’s market mood and outlook for US100
The US100 is holding a cautiously optimistic tone today, extending the strength seen on Monday. Yesterday’s rally was fueled by gains in major tech names, particularly Apple, alongside renewed hopes for progress in US–China trade relations and growing expectations of future Fed rate cuts.
That optimism continues into today, though investors remain wary. Falling oil prices and concerns about slowing global demand are tempering enthusiasm, and with the US government shutdown still delaying key data releases, visibility remains limited.
Overall, sentiment stays positive but measured, markets are leaning risk-on, supported by tech momentum and easing trade tensions, yet the rally remains vulnerable to any negative macro or geopolitical surprises.
Nasdaq Long Position Nasdaq has reached my set target of $25,000, a minor correction occurred but nonetheless we still in the bull run. Will Nasdaq reach $26,000? Let's wait and see

NASDAQ INDEX (US100): Get Ready for Breakout
Nasdaq index is currently testing a resistance based on a current
all-time high.
With a high probability, the market is going to break that.
A daily candle close above will confirm a violation.
A further growth will be expected at least to 25500 level then.
❤️Please, support my work with like, thank you!❤️
I am part of Trade Nation's Influencer program and receive a monthly fee for using their TradingView charts in my analysis.