NASDAQDO YOU KNOW WHATS BEHIND THIS OR OTHER IDEAS?? in bio.
Preferably suitable for scalping and accurate as long as you watch carefully the price action with the drawn areas.
With your likes and comments, you give me enough energy to provide the best analysis on an ongoing basis.
And if you needed any analysis that was not on the page, you can ask me with a comment or a personal message.
Enjoy Trading ;)
Trade ideas

NAS100 Trade Set Up Nov 26 2025Price remains in a bullish trend so as long as it stays closed above 1h swing low/London low i will look for internal SSL sweep to then target buys to higher BSL

USNAS100: Key Breakdown Levels Ahead — 24150 Next?USNAS100 | Technical Overview
The Nasdaq index continues to show weakness below 24460, keeping bearish pressure dominant in the short and medium term.
Technical Outlook
As long as the price remains below the pivot line at 24460, the bearish momentum is expected to continue toward 24150.
A break below 24150 opens the door for a deeper move toward 23930.
If the market closes a 4H candle below 23930, this will confirm a stronger bearish trend targeting 23700.
On the other hand, bullish momentum will only be activated if the price closes a 1H or 4H candle above 24760, which would signal a reversal toward higher levels.
Key Levels
Pivot Line: 24460
Support: 24150 · 23930 · 23700
Resistance: 24580 · 24760 · 25200

$NDX - Grab my strong handSame thing as SP:SPX
Buyers looking to close >24,700
Sellers looking to contain below <24,700
OUTLOOK = Mixed, buy dips // sell rips
**** Weekly view below

NAS100 LONG SETUP These pair previously banged our sl with a temporary breakout of the uptrend channel. Now the price is back on the uptrend, safe entries above 25.217

NAS100 I Potential break of 25,217 Resistance Welcome back! Let me know your thoughts in the comments!
** NAS100 Analysis - Listen to video!
We recommend that you keep this on your watch list and enter when the entry criteria of your strategy is met.
Please support this idea with a LIKE and COMMENT if you find it useful and Click "Follow" on our profile if you'd like these trade ideas delivered straight to your email in the future.
Thanks for your continued support!

Price action Price currently testing an order block that was pervious rejected looking to go to the downside managed to fix my chart this is a clear sell
NAS100 Trade Set Up Nov 25 2025Price remains bullish making HH/HL on the 1h so i will be looking to take buys above PDH to target higher BSL levels but first i will wait for more internal structure on the 5m

NAS100 Bullish Setup on 1hrNAS100 Bullish Setup on 1hr
Bullish Setup presented on 1hr
- Bullish divergence
- 1hr FVG created in this crazy sell off
- 1hr unfinished candle at my TP level
Entry: 24160
TP: 25000
SL: 23980
RR: 1:5.71

NAS100 –Long Liquidation, Short Squeeze,LVN Above Still a MagnetNasdaq futures just went through a classic two-step sequence:
Thursday – long liquidation (b-profile)
Fast drop from ~25 200 down to ~23 700.
Single-print style profile, almost no rotations, no absorption.
Price sliced straight through a low-volume void (LVN) between 25 150 → 24 650 – basically “air”.
Friday – short covering (P-profile)
Buyers stepped in around 23 700–23 900 and pushed price back to ~24 5xx.
The daily/session profile built a clear P-shape:
fat upper node around 24 380–24 480, long lower tail.
This is typical short squeeze / covering, not clean accumulation.
From a market-profile / order-flow perspective, that big LVN above is still unfinished business. Markets usually like to come back and “repair” such areas after a liquidation event.
Key Profile Levels
🔵 Thursday VPOC / support: 23 950–24 050
🔵 Friday HVN / acceptance: 24 380–24 480
🔵 Major LVN (thin air): 24 650 → 25 150
🔵 Pre-liquidation VPOC / destination: ~25 150
The rotation path that makes the most sense for me is:
23 950 → 24 380 → 24 650 → 25 150
…as long as we don’t get a fresh macro shock.
Trading Plan (not a signal, just how I see it)
Bias:
Cautiously bullish as long as price holds above 23 950–24 000, looking for the market to rotate back into the LVN above.
1️⃣ Long scenario (base case)
Ideal: early dip / chop above 23 950–24 050, then rotation higher.
First magnet: 24 380–24 480 (Friday HVN).
If price accepts above that zone (multiple 15m / 1H closes and volume building there), I expect a push into the 24 650 LVN edge, with potential extension toward 25 000–25 150 to “repair” the pre-crash profile.
2️⃣ Retest-lower scenario
If sellers hit us right from the open and we break below 24 100, I’m watching 23 950–24 000 as must-hold support.
A clean bounce from there still fits the rotation idea toward 24 380 → 24 650.
Acceptance below 23 900 would invalidate the bullish repair scenario for me and re-open the door to the weekly low 23 700 and even 23 150 HTF demand.
Invalidation
For this LVN-fill view I consider it wrong if:
We build value below 23 900,
Or we see a fresh b-profile / liquidation day under Thursday’s low.
In that case I’d step aside and reassess – that would mean the market is not finished with the downside.
How I’ll Use Order Flow
On intraday order-flow charts (NQ futures):
Looking for buying imbalances / absorption around 23 950–24 050 if we retest it.
Watching 24 380–24 480 for the battle between new sellers and short covering:
Acceptance above → bullish continuation toward 24 650+.
Sharp rejection with heavy sell imbalances → we might just be in a bigger range and the LVN can stay unfilled longer.
Final Thoughts
Thursday looked like forced-out longs (b-profile).
Friday looked like shorts scrambling to cover (P-profile).
There is still a huge LVN above, and these areas are often magnets once the panic phase is over.
As always, this is not financial advice, just my personal read of the auction.
Manage your own risk and sizing – especially after such high-volatility days.

Could the drop be over?Technical: The index is sitting around 22,078 points, dropping approximately 2.15%.
Fundamental: The decline is linked to a reversal of momentum after NVIDIA Corporation’s strong earnings; although the results were solid, the market interpreted that risks related to interest rates and valuations may still persist.
Key: Keep an eye on the upcoming Federal Reserve interest rate decision and the evolution of employment data, as the market remains sensitive to whether rate cuts will occur or not.

NASDAQDO YOU KNOW WHATS BEHIND THIS OR OTHER IDEAS?? in bio..
Preferably suitable for scalping and accurate as long as you watch carefully the price action with the drawn areas.
With your likes and comments, you give me enough energy to provide the best analysis on an ongoing basis.
And if you needed any analysis that was not on the page, you can ask me with a comment or a personal message.
Enjoy Trading ;)

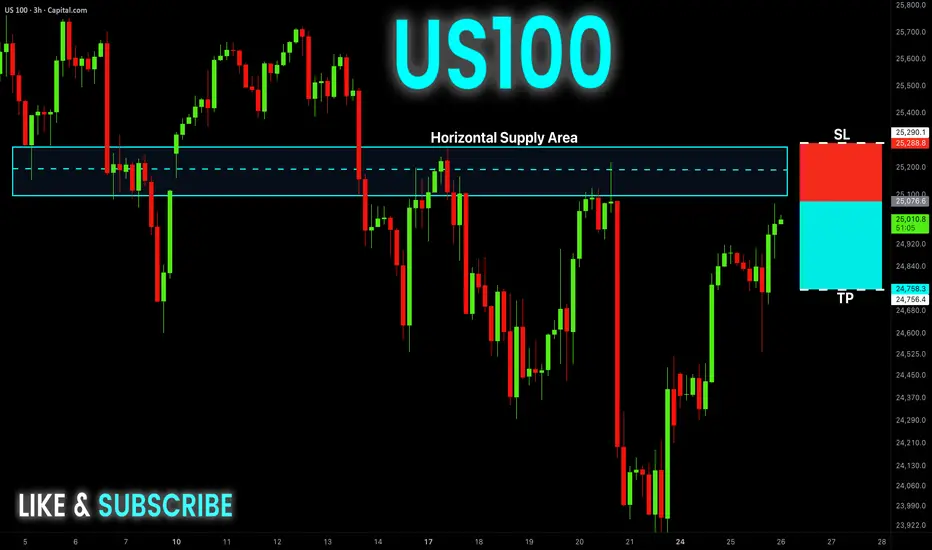
US100 Free Signal! Sell!
Hello,Traders!
US100 has swept internal liquidity and is now approaching the horizontal supply but hasn’t retested it yet. If the retest confirms distribution, SMC flow favors a drop toward the next sell-side liquidity zone.
--------------------
Stop Loss: 25,288
Take Profit: 24,756
Entry: 25,076
Time Frame: 3H
--------------------
Sell!
Comment and subscribe to help us grow!
Check out other forecasts below too!
Disclosure: I am part of Trade Nation's Influencer program and receive a monthly fee for using their TradingView charts in my analysis.
NAS100 H4 | Bearish Reversal Off Key ResistanceMomentum: Bearish
Price is showing rejection from the sell zone, which aligns with the 78.6% Fibonacci retracement level. The market remains below the descending trendline, supporting a bearish continuation bias.
Sell Entry: 24,926.07
Overlap resistance
78.6% Fibonacci confluence
Stop Loss: 25,314.56
Positioned above pullback resistance
Take Profit: 24,447.49
Pullback support zone
High Risk Investment Warning
Stratos Markets Limited (tradu.com ), Stratos Europe Ltd (tradu.com ):
CFDs are complex instruments and come with a high risk of losing money rapidly due to leverage. 70% of retail investor accounts lose money when trading CFDs with this provider. You should consider whether you understand how CFDs work and whether you can afford to take the high risk of losing your money.
Stratos Global LLC (tradu.com ): Losses can exceed deposits.
Please be advised that the information presented on TradingView is provided to Tradu (‘Company’, ‘we’) by a third-party provider (‘TFA Global Pte Ltd’). Please be reminded that you are solely responsible for the trading decisions on your account. Any information and/or content is intended entirely for research, educational and informational purposes only and does not constitute investment or consultation advice or investment strategy. The information is not tailored to the investment needs of any specific person and therefore does not involve a consideration of any of the investment objectives, financial situation or needs of any viewer that may receive it. Past performance is not a reliable indicator of future results. Actual results may differ materially from those anticipated in forward-looking or past performance statements. We assume no liability as to the accuracy or completeness of any of the information and/or content provided herein and the Company cannot be held responsible for any omission, mistake nor for any loss or damage including without limitation to any loss of profit which may arise from reliance on any information supplied by TFA Global Pte Ltd.

NAS100How to become successful in forex and stock trading: 1.Master fundamentals and technical analysis. 2,Build and follow a solid trading plan. 3.Apply strict risk management (1–2% rule). 4.Stay disciplined—control fear and greed. 5.Record and analyze every trade. 6.Focus on high-quality setups only. 7.Diversify across assets and markets. 8.Keep evolving—study, adapt, and grow daily.
Nasdaq : 24,000 Holds Strong — Next Stop 25,800?Price action on the Nasdaq 100 is telling a clear story: 24,000 (AVWAP + HVN confluence + Round number) is acting like a magnet for institutional buyers.
This suggests that accumulation is happening at these levels, positioning for a potential run toward 25,800 if momentum holds.
Are we front-running a breakout, or should we wait for confirmation above 25,000 first?

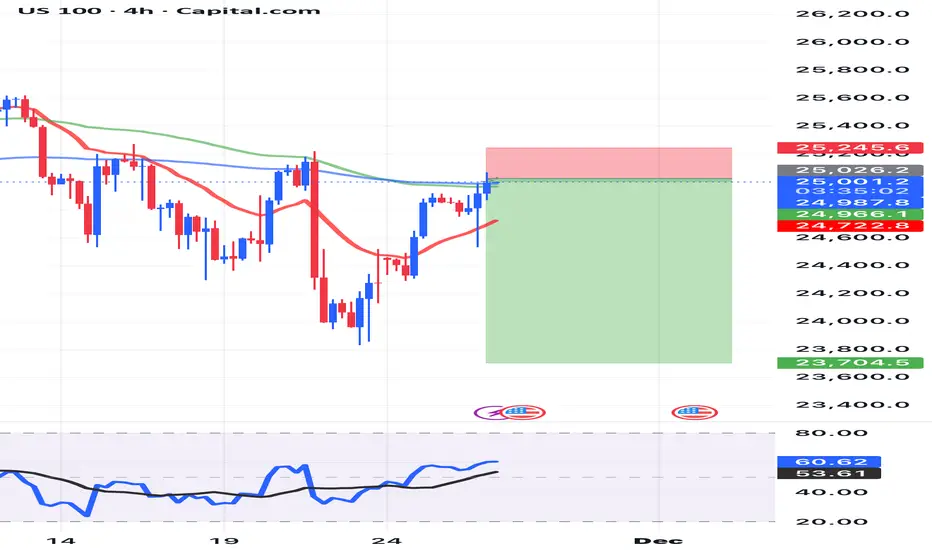
Nasdaq NAS100 Analysis: The Conditions I Need Before Going ShortI'm keeping a close eye on NAS100 (Nasdaq) right now. 📉✨ On the 4H timeframe, price remains in a clean, sustained bearish trend, and I'm anticipating a potential continuation lower.
If price rejects the current level and fails to retrace through the 1H imbalance, and we see a rotation followed by a bearish break of structure, I'll be preparing for a short opportunity. 📊🔻
Not financial advice.

Bullish signalsThe price is bouncing from 100-day EMA and VWAP from late June low on US100 chart (not on NDX though). WXY correction structure looks complete. It can still go lower to test 0.618 fib from August 1 low to top or August 13 peak. RSI shows 2h bullish divergence on all Nasdaq and S&P500 charts. A reversal to new ATH is highly probable from this area (or atleast a high bounce to draw another right shoulder).

US100 Reversal Map – Hull MA + Heikin Ashi Confirmation🧠 US100 / NASDAQ100 Profit Pathway Setup — The Thief’s Bullish Escape Plan! 💰🚀
📊 Market Bias: Bullish (Day Trade Setup)
The Thief Trader has spotted a golden pathway in the NASDAQ100 (US100)!
Here’s the breakdown of the plan — straight from the thief’s vault 🕵️♂️📈
🎯 Plan Overview
Bias: Bullish continuation confirmed
Technical Confirmation:
✅ Double Pullback on Hull Moving Average
✅ Retest Zone successfully defended
✅ Heikin Ashi Bullish Doji signaled a trend reversal confirmation
💡 Momentum is shifting upward — the trend has officially changed!
💎 Entry Strategy (Layered Thief Style)
The Thief Strategy applies a layered entry method — multiple buy limits to average into strength.
📥 Buy Limit Layers:
25,300
25,400
25,500
25,600
(Traders can adjust or add more layers based on risk appetite and confirmation zones.)
🛡️ Stop-Loss Setup
This is the Thief SL @ 25,100
⚠️ Note to Thief OG’s:
I’m not recommending my SL as your SL — always customize risk and secure your own bag. Manage your position with discipline and independence! 💼
🎯 Take-Profit Zone
Target: 26,200
🚨 The Police Barricade Zone acts as a strong resistance — overbought levels spotted and potential bull trap alert!
Kindly exit with profit before the officers arrive. 😎
⚠️ Note: Profit-taking is at your discretion. Book and Run!
📈 Related Pairs to Watch (Correlation Insight)
NASDAQ:NDX / CAPITALCOM:US100 / NASDAQ:QQQ : All mirror NASDAQ movement.
SP:SPX / AMEX:SPY : Often correlate with NASDAQ’s momentum (watch divergence for clues).
TVC:VIX : If volatility spikes, expect pullbacks on tech-heavy indices.
TVC:DXY : A weak dollar often fuels US100 bullish legs — keep an eye on it.
NASDAQ:AAPL / NASDAQ:MSFT / NASDAQ:NVDA : Leading drivers of NASDAQ — if they pump, the index follows. 💪
🧩 Key Insights
Hull MA alignment confirms momentum shift.
Retest + bullish Heikin Ashi Doji = market reversal confirmation.
Layered entries give flexibility in volatile intraday conditions.
Dynamic risk management is key — never marry a position.
✨ “If you find value in my analysis, a 👍 and 🚀 boost is much appreciated — it helps me share more setups with the community!”
#US100 #NASDAQ100 #ThiefTrader #DayTrading #IndexTrading #HullMA #HeikinAshi #LayeredEntries #TechnicalAnalysis #TradingSetup #PriceAction #MarketReversal #TradingCommunity #BullishPlan #SmartMoneyFlow #TradeIdeas #ThiefStrategy

NSDQ100 oversold rally reaching resistance at 25285Equities:
Risk appetite improved again, with the S&P 500 +0.91% marking a third straight gain, and futures pointing higher this morning (+0.31%). The move was reinforced by a drop in yields, with the 10yr Treasury down to 4.00%, a four-week low.
Drivers of the Rally:
Dovish Fed momentum: Markets leaned further into December rate-cut expectations after softer US data. Bloomberg headlines that Kevin Hassett is now the frontrunner for Fed Chair added to the dovish tilt.
Geopolitics: European equities tracked higher (STOXX 600 +0.91%), supported by reports of progress in Ukraine peace talks.
US Data – All Dovish:
Consumer Confidence (Nov): 88.7, below every estimate and the lowest since April’s turmoil.
ADP private payroll proxy: Averaged –13.5k over the latest four weeks, signalling labour softness.
September revisions:
Retail Sales +0.2% (vs +0.4% expected).
PPI +0.3% (in line), but still consistent with cooling demand.
Stocks in Focus:
Nvidia –2.59% underperformed as Google’s Gemini 3 launch signalled intensifying AI competition.
Geopolitics:
Bloomberg reported the US sent negotiators to meet Putin in Moscow next week to discuss a Ukraine peace proposal, adding to the constructive tone in Europe.
Trading Takeaway
Rates: Further downside bias in yields if today’s data stays soft; the 4.00% level on the 10yr is key support.
Equities: Momentum remains positive, but tech leadership is wobbling—watch for rotation into cyclicals, financials, and Europe.
FX: Dovish Fed expectations should pressure USD on the margins.
Geopolitics: Peace-talk headlines may continue to support European assets and risk sentiment.
Key Support and Resistance Levels
Resistance Level 1: 25285
Resistance Level 2: 25466
Resistance Level 3: 25390
Support Level 1: 24750
Support Level 2: 24600
Support Level 3: 24450
This communication is for informational purposes only and should not be viewed as any form of recommendation as to a particular course of action or as investment advice. It is not intended as an offer or solicitation for the purchase or sale of any financial instrument or as an official confirmation of any transaction. Opinions, estimates and assumptions expressed herein are made as of the date of this communication and are subject to change without notice. This communication has been prepared based upon information, including market prices, data and other information, believed to be reliable; however, Trade Nation does not warrant its completeness or accuracy. All market prices and market data contained in or attached to this communication are indicative and subject to change without notice.

Nasdaq (sell)**Disclaimer (Smart Money Concepts Analysis)**
This analysis is based on Smart Money Concepts (SMC) and represents only the analyst’s personal perspective. All marked levels, scenarios, and the two potential entry points are provided strictly for educational purposes and should not be considered financial advice, investment guidance, or a buy/sell signal.
Any trade you choose to take is entirely your own decision and must be executed with proper risk management and full personal responsibility. Market conditions may shift at any time and may invalidate the outlined scenarios.
This analysis is not a substitute for professional financial or investment advice. It is recommended to:
* Always use a **stop-loss**
* Follow a **clear risk management plan**
* Verify setups with your own analysis
* Be aware that the market can move unpredictably
By using this analysis, you acknowledge that all trading decisions and outcomes are solely your responsibility.

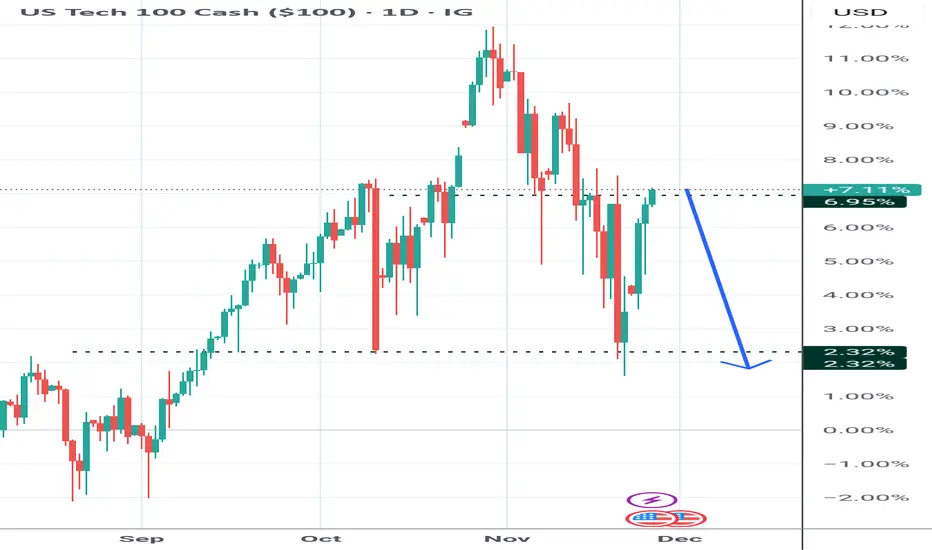
Nasdaq 100 Ahead of the HolidaysNasdaq 100 Ahead of the Holidays
As the chart shows, the Nasdaq 100 has rebounded from its roughly 2.5-month low recorded on 21 November. At that point, bearish sentiment was driven by fears of an “AI bubble”, expectations of higher interest rates, and other news-related pressures.
The recovery from that level was strong — in less than a week the index gained around 5.3%, signalling robust demand. This not only offsets last week’s concerns but also injects optimism into the near-term outlook.
Technical Analysis of the Nasdaq 100 Chart
Examining recent price action in the Nasdaq 100, we can outline an ascending channel in which:
→ the median line acted as support until mid-November;
→ support at the lower boundary helped form the 21 November low.
From the perspective of buying pressure:
→ The November dip appears to be an intermediate correction within a broader emerging uptrend.
→ The brief move below the psychological 24k level (where the notable September and October lows lie) resembles a Liquidity Grab pattern, suggesting so-called Smart Money may have used sellers’ liquidity to build long positions — a sign of bullish intent.
From the perspective of selling pressure:
→ the market remains within a corrective structure (highlighted in red);
→ today, the Nasdaq 100 is trading near 25,265, a level that acted as resistance on 17–20 November.
It is possible that trading near the channel’s median line will encourage a balance between buying and selling forces — just as market participants head off to celebrate Thanksgiving.
This article represents the opinion of the Companies operating under the FXOpen brand only. It is not to be construed as an offer, solicitation, or recommendation with respect to products and services provided by the Companies operating under the FXOpen brand, nor is it to be considered financial advice.

NAS 2 MOON ?Ok so i made my oblivion call
where i expect incomprehensible shorting wothon the us stock market however i see one last impulse cooking up might react at the red levels and tank there before it goes my way idk but my bias is bullish and $27295 is my target
weekly timeframe keeps making higher highs if it breaks structure well game over
