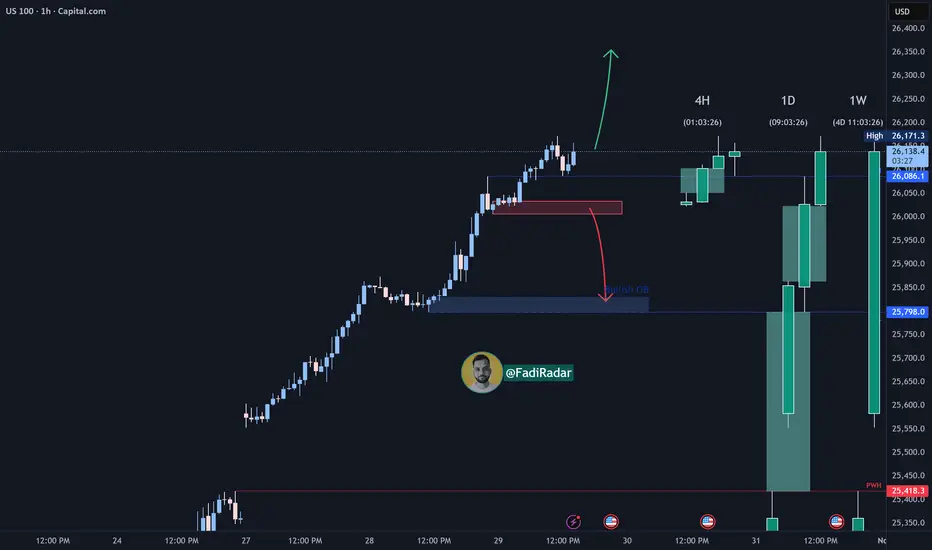
NASDAQ Index Analysis (US100)The NASDAQ index continues its strong bullish trend, currently trading near a new all-time high around 26,140.
📉 A minor correction is expected toward the 26,000 support zone.
If the price breaks and holds below this level, a further decline toward 25,800 is likely.
📈 However, if the price bounces from 26,000, the index may retest the recent high or even create a new record high.
💡 Key Trading Levels:
✅ Buy: On confirmed bounce from 26,000 or 25,800.
🔻 Sell: Below 26,000 after confirmation.
Trade ideas
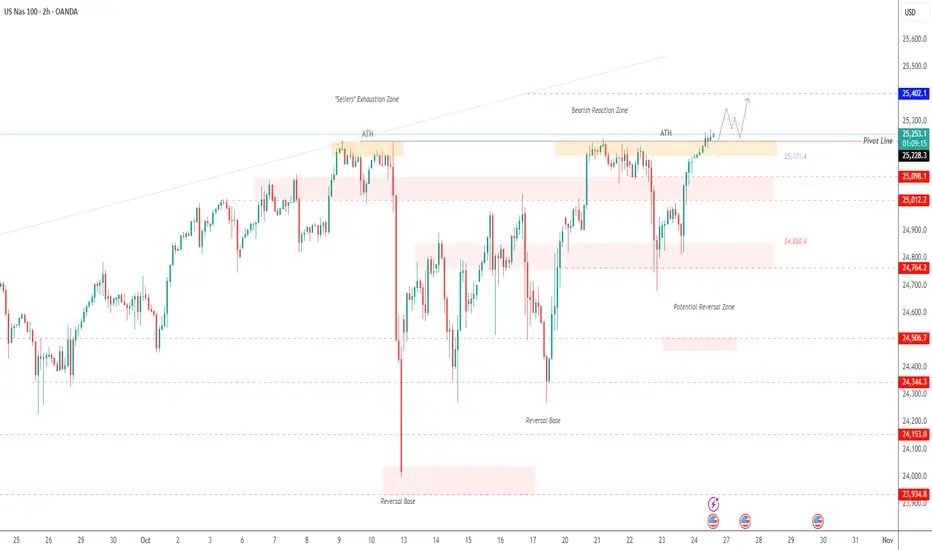
USNAS100 Extends Rally to New All-Time Highs?USNAS100 | Bullish Continuation Toward New Highs
The index recorded a new all-time high (ATH) and has already stabilized above it, supporting further bullish momentum toward 25,400 → 25,550.
The main driver behind the move remains strong corporate earnings.
However, to confirm a bearish reversal, the price must close a 1H candle below 25,170, which would expose 25,100 → 25,010.
A sustained break below those levels could extend the decline toward 24,850.
Pivot Line: 25,230
Resistance: 25,400 – 25,550
Support: 25,100 – 25,010 – 24,860
Position Sizing: The Math That Separates Winners from LosersMost traders blow up their accounts not because of bad entries, but because of terrible position sizing. You can have a 60% win rate and still go broke if you risk too much per trade.
The 1-2% Rule (And Why It Works)
Never risk more than 1-2% of your account on a single trade.
Here's why this matters:
Risk 2% per trade → You can survive 50 consecutive losses
Risk 10% per trade → 10 losses = -65% drawdown (you need +186% just to break even)
Risk 20% per trade → 5 losses = game over
The Position Sizing Formula
Position Size = (Account Size × Risk %) / (Entry Price - Stop Loss)
Real Example:
Account: $10,000
Risk per trade: 2% = $200
Entry: $50
Stop loss: $48
Risk per share: $2
Position Size = $200 / $2 = 100 shares
If stopped out → You lose exactly $200 (2%)
If price hits $54 → You make $400 (4% gain, 2:1 R/R)
Different Risk Frameworks
Conservative (1% risk)
Best for: Beginners, volatile markets, high-frequency trading
Survivability: Can take 100+ losses
Growth: Slower but steady
Moderate (2% risk)
Best for: Experienced traders, tested strategies
Survivability: 50 consecutive losses
Growth: Balanced risk/reward
Aggressive (3-5% risk)
Best for: High conviction setups, smaller accounts trying to grow
Survivability: 20-33 losses
Growth: Faster but dangerous
Warning: Never go above 5% unless you're gambling, not trading.
The Kelly Criterion (Advanced)
For traders with significant backtested data:
Kelly % = Win Rate -
Example:
Win rate: 55%
Avg win: $300
Avg loss: $200
Win/Loss ratio: 1.5
Kelly % = 0.55 - = 0.55 - 0.30 = 25%
But use 1/4 Kelly (6.25%) or 1/2 Kelly (12.5%) - Full Kelly is too aggressive for real markets.
Common Position Sizing Mistakes
❌ Revenge trading larger after a loss
✅ Keep position size constant based on current account value
❌ Risking the same dollar amount regardless of setup quality
✅ Risk 0.5% on B-setups, 2% on A+ setups
❌ Ignoring correlation risk
✅ If you have 5 tech stocks open, you're really risking 10% on one sector
❌ Not adjusting after drawdowns
✅ If account drops 20%, your 2% risk should recalculate from new balance
The Volatility Adjustment
In high volatility (VIX > 30):
Cut position sizes by 30-50%
Widen stops or risk less per trade
Market can gap past your stops
In low volatility (VIX < 15):
Can use normal position sizing
Tighter stops possible
More predictable price action
My Personal Framework
I use a tiered approach:
High conviction setups (A+): 2% risk
Good setups (A): 1.5% risk
Decent setups (B): 1% risk
Experimental/learning: 0.5% risk
Maximum combined risk: Never more than 6% across all open positions.
The Bottom Line
Position sizing is the only thing you have complete control over in trading. You can't control:
Where price goes
Market volatility
News events
But you CAN control how much you risk.
The traders who survive long enough to get good are the ones who master position sizing first.
What's your current risk per trade? Drop it in the comments. If it's above 5%, we need to talk.
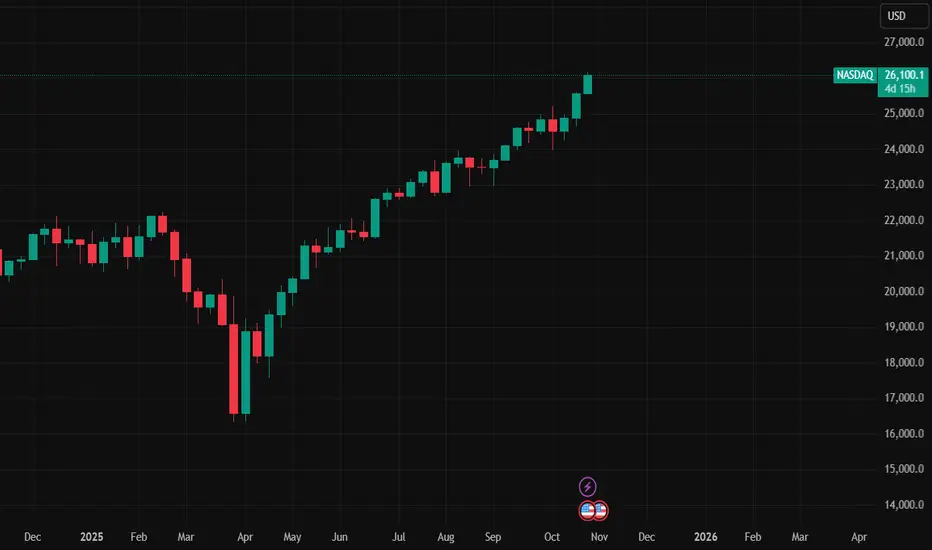
NASDAQ to 26,000 before year end - September, 2025No doubt this idea will be controversial as a majority of ideas published on the platform call for a bearish outlook.
Earlier this year paper hands were flushed out of the market on tariff scares. They couldn’t exit the market fast enough, some didn’t actually know why they were selling as emotions were in full control.
Today those same traders and investors sit in cash as they wait for an opportunity to buy in. Others betting heavily against the trend for Armageddon. All the while the market grinds upwards and onwards.
Two very simple questions everyone must ask when entering or betting against the market:
1. What is the trend?
2. Support and resistance, which is it?
You cannot maintain a bearish bias should you answer both of those questions positively. That’s emotion. Do you find yourself scanning lower timeframes to look for bias confirmation? You'd be in majority then. Notice how many published ideas you see operating in the 15 and 30 minute charts with 2 to 3 month forecasts? Always makes me smile, but it will not change the facts of the chart.
The Trend
Higher lows are evident on the daily chart below, marked out in black. The trend is your friend until the end.
Support & resistance
Look left. On the daily chart we can see multiple support tests with confirmation on past resistance. If the levels do not at first appear, zoom out using a higher timeframe. A majority will zoom in instead to confirm bias, that’s a red flag.
The Put / Call ratio
Retail traders are aggressive in their attempts to “short” this market. Nowhere is that more evident than the Put/Call ratio. Anytime you see dumb money move the put call ratio to 90 and above, the market rips. Just recently short sellers moved the ratio beyond this level. The chart below provides a comparison with the NDX to show what happens next. The rally that follows will typically last up to 2 months on average after this signal.
Why 26000?
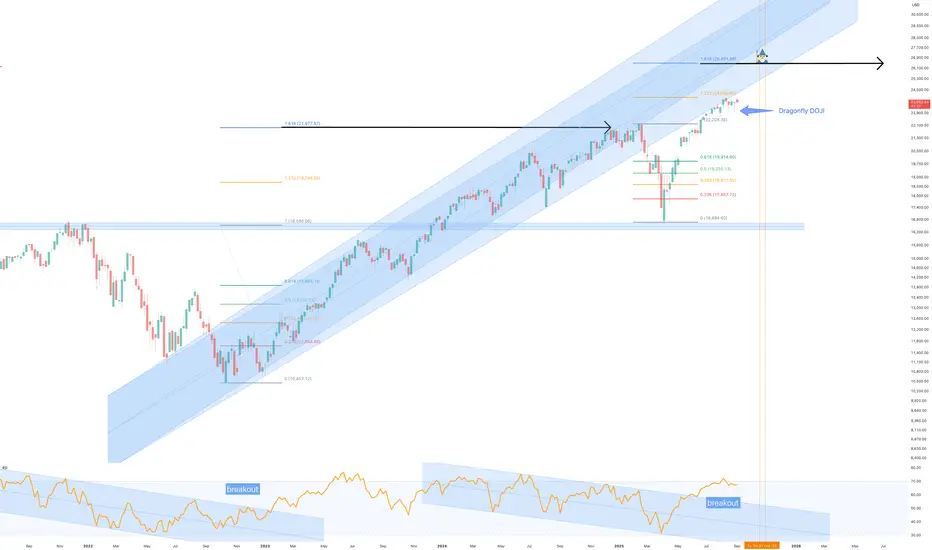
The market entered price discovery after the previous all time high breakout of 22k. The forecast area was previously published, see linked ideas. The same conditions that allowed those forecasts now repeat. In addition the Fibonacci extensions; the NDX repeatably rallies to the 1.618 extension after each and every emotional flush out. It’s a gift horse of an opportunity.
Previous years:
Conclusion
Markets climb walls of worry, and this moment is no different. The loudest voices today call for collapse, but the charts, price action, and sentiment data are telling another story entirely. Higher lows, confirmed support, extreme put/call ratios, and Fibonacci extensions all align with one clear outcome: continuation.
A move to 26,000 on the NASDAQ before year-end is not a wild stretch of imagination, but the logical conclusion of repeating market behaviour. Every emotional flush out has historically created the runway for price discovery to the 1.618 extension, and this time is no different.
If you’re betting against the trend, you’re not fighting the market, you’re fighting math, structure, and history. The bears may dominate headlines but that just News. The market is not listening to fear. It’s grinding higher, and the destination is 26,000.
Ww
Bullish channel breakout on USTEC, potential for further gains? USTEC rose to fresh highs as AI demand and strong semiconductor orders bolstered investor sentiment.
SK Hynix customers have secured its entire memory chip lineup for 2026, reinforcing confidence in tech earnings momentum. Attention now turns to upcoming earnings from Big Tech to gauge the sustainability of the USTEC's rally.
From a technical perspective, USTEC broke out of the ascending channel's upper bound at 26000. If the index sustains its bullish momentum above the 26000 threshold, the price could gain upward momentum toward the 127.2% Fibonacci Extension and resistance at 27200. Conversely, if USTEC returns within the channel and 26000 threshold, the index may retest the support at 25200.
By Li Xing Gan, Financial Markets Strategist Consultant to Exness

USNAS100 ForecastThe US100 chart shows strong bullish momentum, breaking above key resistance levels. Price is expected to retrace slightly toward the 25,750–25,500 support zone before resuming its upward move toward the 26,400–26,500 target area. Overall trend remains bullish with higher highs and higher lows formation.
"Thank you for your support! If you found this idea valuable or learned something new, please consider liking and leaving a comment. I’d really appreciate hearing your feedback and thoughts."

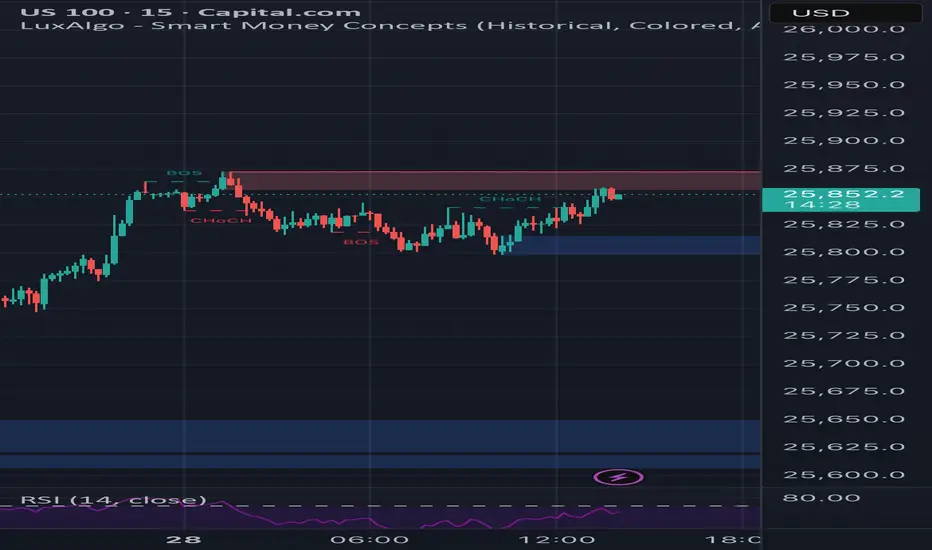
US100 – Buyers Take Full Control as Market Breaks Out4H Technical Zone Analysis
Zone 1: Monday’s All-Time High
This zone marks Monday’s all-time high, where the market initially paused after a strong impulse move. The breakout above this level signals clear bullish dominance, but as price extends into record territory, this zone now serves as a potential pivot area. Should price revisit it, traders will be watching for whether former resistance can act as support — a successful retest here would confirm the breakout’s strength and validate continued upward momentum.
Zone 2: Tuesday’s Demand Base
This area represents the level where buyers decisively regained control during Tuesday’s session, driving a sharp rally that broke above prior highs. It reflects the origin of the latest bullish leg and highlights strong demand from institutional participants. As long as price holds above Zone 2, intraday sentiment remains bullish and pullbacks into this area are likely to attract renewed buying interest. A sustained move below, however, would suggest momentum exhaustion and open the door for a deeper retracement.
Sentiment Overview
The Nas100 surged yesterday, driven by a wave of optimism following encouraging headlines on both the macro and geopolitical fronts. Markets rallied after reports of a “constructive” round of US-China trade talks in Malaysia, which eased fears of renewed escalation and reignited risk appetite across global equities. At the same time, a softer-than-expected US CPI print reinforced hopes that inflation pressures are moderating, prompting renewed speculation that the Federal Reserve could adopt a more dovish tone once government operations resume.
Tech and semiconductor stocks once again led the advance, supported by strong earnings and continued enthusiasm around AI and digital infrastructure. The index pushed into fresh record territory, underscoring how dominant the tech sector remains as a driver of sentiment.
Heading into today’s session, the tone is cautiously constructive. The market is buoyed by improved trade relations and stable inflation expectations, yet traders are aware that valuations are stretched and macro visibility is limited due to the ongoing US government shutdown. With key data releases delayed and the index at all-time highs, volatility could spike on any unexpected headlines or shifts in tone from policymakers.

AI bubble is just startingKeeping it very simple.
It looks like Tech just broke out of the trend to the upside similar to 2nd Stage trend of the Internet bubble.
Compounding factors
-debt cycle turned spiral
-AI circle economy/ Ponzi

NAS100 (1H) Market Outlook📈 NAS100 (1H) Market Outlook
NASDAQ is approaching a major resistance zone, with price currently extending within the upper boundary of a rising channel.
We may see a short-term bullish continuation into the top trendline, followed by a potential corrective drop back toward the 25,300–25,400 demand zone.
🧭 Key Levels:
🟥 Resistance Zone: 26,100 – 26,200
🟩 Support Zone: 25,300 – 25,400
⚙️ Potential setup: Wait for rejection confirmation before short entry.
📊 Market structure remains bullish overall, but extended exhaustion near the top trendline could trigger a pullback before continuation.
✨ Precision. Patience. Profit.
#NAS100 #US100 #IndexTrading #Forex #StressFreeTrading

NasdaqHello traders! Last Friday, we had a major selloff in the 25,000 region, which quickly sent the Nasdaq crashing by more than 4% in just a few hours. In technical analysis, 24,000 is a price that has been broken previously and is now being tested as weekly support. If we expand this movement, we project a target price of 26,000, continuing the upward movement. The technology sector remains promising with advances in artificial intelligence, and we have no news of a Federal Reserve interest rate hike. Happy trading!

Nasdaq 100 Trade ideaLet’s see how it reacts to this BISI, could be seeking for the highs it just created.

NAS100 Trade Set Up Oct 28 Price is trading above PDH and making ATH so i am bullish but first i want to see a pull back into 1h FVG or sweep internal 15m SSL before making 1m-5m IFVG/CISD to continue higher

NASDAQ CRASH TO OBLIVION FY25-26my bias is short term bearish from the current level finding resistance around past higher high then bullish continutaion till the 26k levels where
im expecting a reversal in price to the yellow zones the proper exit ewill be specified once the reversal points confirm and present us with a down trend what i can say is there will be breaks of sructure on the weekly timeframe
like comment follo

Sell in NasdaqUpdated Nasdaq Market Analysis (as of October 28, 2025 – Current Price: 25,809)
Current Price: Nasdaq Composite (^IXIC) at 25,809
Intraday Change: Up +1,605 points (+6.63%) from prior close (~24,204)
Context: This marks an explosive breakout, shattering all-time highs with the strongest single-day surge in over a year. The move is driven by blowout earnings from Nvidia (NVDA), Microsoft (MSFT), and Meta (META), reigniting AI frenzy, alongside dovish Fed signals and U.S.-China trade thaw rumors.
Despite the euphoria, this is a textbook “sell the news” top — and 25,809 is an ideal short entry. Here’s why:
Why It’s a Strong Sell at 25,809
1. Extreme Overbought Conditions (Technical Exhaustion)
• RSI (14-day): 92+ → Highest since March 2000 (dot-com peak).
Anything above 80 is extreme; 90+ is a screaming reversal signal.
• Distance from 200-day MA: Now +22% above — the most extended in 25 years.
• Bollinger Bands: Price 3+ standard deviations above the 20-day mean — a classic “blow-off top” pattern.
• Volume Spike + Distribution: Today’s volume is 2.5x average, but declining stocks outnumber advancers 1.8:1 beneath the surface — institutional selling into strength.
Verdict: This is not sustainable momentum — it’s FOMO capitulation.
2. Valuations at Absurd Levels
Metric
Current
Historical Avg
Implication
Nasdaq Forward P/E
42.1x
25x
Priced for perfection
Price-to-Sales (NDX)
9.8x
4.5x
AI hype detached from revenue
Nvidia P/E
78x FY26
35x (growth stocks)
One miss = 30% drop
Even if AI growth continues, the market has already priced in 5+ years of flawless execution.
3. Earnings “Sell the News” Setup
• Nvidia: Beat estimates by 12%, but guidance only in-line — no upside surprise.
• Microsoft/Azure: Growth slowed from 33% → 29% YoY — first deceleration in 2 years.
• Options Flow: Massive call unwinds post-earnings → smart money taking profits.
History: 8 of the last 10 times Nasdaq surged >5% in a day on earnings, it corrected 7–15% within 2 weeks.
4. Macro & Event Risks Clustering
Event
Date
Risk
U.S. Elections
Nov 5
Policy uncertainty (tariffs, regulation)
Fed Meeting
Oct 29–30
Dovish cut already priced in — hawkish surprise risk
CPI (Oct)
Nov 13
Sticky inflation → rate cut delay
China Stimulus Fade
Q4
Early 2025 growth slowdown
Risk-on sentiment is at peak — any disappointment triggers rotation out of tech.
5. Sentiment & Positioning Extremes
• CFTC Data: Speculative net longs at all-time highs.
• AAII Bull-Bear Spread: +48% (top 5% historically).
• X (Twitter) Sentiment: “Nasdaq to 30,000” trending — contrarian sell signal.
Everyone is in → No one left to buy.
Trading Signal: SELL (Short) Nasdaq at 25,809
Entry
25,809 (current) or on bounce to 25,900–26,000
Target 1
24,500 (-5%)
Target 2
23,800 (-8%) – 50-day MA
Stretch Target
22,000 (-15%) – 200-day MA
Stop-Loss
26,300 (above psychological 26k)
Risk/Reward
1:3 to 1:5
Execution Options:
• Short Nasdaq Futures (/NQ) or Inverse ETFs (SQQQ, PSQ)
• Put Options: NDX Dec 25,000 puts (high liquidity, defined risk)
• Trailing Stop: Use 1.5% ATR (~400 pts) or previous day’s low
Why Now Is the Perfect Sell
• Parabolic move complete — check
• Earnings catalyst exhausted — check
• Valuations unsustainable — check
• Everyone bullish — check
• Major events ahead — check
This is the top of the AI bubble Phase 1.
The next 5–10% down will be fast and violent — sell strength, don’t chase.
Final Note: Long-term, AI and tech remain dominant. But 25,809 is a generational shorting opportunity. Lock in gains, raise cash, and prepare to buy the dip at 22,000–23,000.
Position sizing: Max 2–3% risk per trade. Use stops religiously.
Monitor: Fed statement (Oct 30), U.S. election polls, China PMI (Oct 31).
US 100 Index – Yesterday Saw New Record Highs, What Next?Fresh optimism regarding the potential for a US-China trade deal saw the US 100 rise to a new record high of 25889 early this morning, a daily gain of 2% and an unbelievable rise of 58% from its April 6th low at 16324 when trade tensions were at their height.
Now, across the rest of this week, US 100 traders may be focused on several key events to decide the next directional moves for the index. These are, the Federal Reserve (Fed) interest rate decision, earnings from five of the Magnificent Seven corporates, and the face-to-face meeting between US President Trump and Chinese President Xi. Let’s briefly discuss each one.
On Wednesday at 1800 GMT the Fed are fully expected to cut interest rates 25bps (0.25%) when they release the outcome from their 2-day policy meeting (FOMC). What is less certain is what comes next. Markets are still pricing in a high probability of another 25bps cut at the Fed’s next meeting in December, however any indication that this may not be a sure thing could lead to a more negative outcome for the US 100. The comments made by Fed Chairman Powell in the press conference, which starts at 1830 GMT, could be crucial in this regard.
Once the Fed press conference ends on Wednesday, traders may be absorbed by the release of earnings from Alphabet, Microsoft and Meta, which are followed by the updates from Amazon and Apple after the market close on Thursday. Remember, it wasn’t that long ago that worries about an AI bubble negatively impacted the US 100, and so the focus in these results could be on AI spending, future revenue growth and costs.
The final event is the face-to-face meeting between President’s Trump and Xi which takes place in South Korea on Thursday, the first in 6 years. Current expectations are for the heads of the world’s two biggest economies to agree a series of deals on rare earth metals, soybeans, shipping levies and export controls. Whether these agreements match up to expectations could be pivotal to the direction of the US 100 into the weekend.
Technical Update: Mind The Gaps!
CFD price activity typically forms in relatively smooth patterns, rising in uptrends or falling in downtrends. While brief corrections may occur, they’re often limited in scope and duration before the prevailing trend resumes, unless a shift in sentiment triggers a directional reversal.
Occasionally, within an orderly price advance or decline, acceleration phases emerge, which can result in gaps in price activity. These gaps occur when a CFD closes one session and then opens higher in an uptrend or lower in a downtrend the next day, reflecting a surge in trader interest in the direction of the prevailing trend.
Within technical analysis, there are three types of price gaps, each offering insight into trader sentiment and directional risk. Below is a brief overview of each.
Breakaway Gap: Typically seen at the start of a new trend, this gap reflects strong trader conviction, buyers are willing to pay higher prices at the open in an uptrend, or sellers accept lower prices in a downtrend. It can often be seen to complete a reversal pattern and signals a possible shift in sentiment.
Continuation Gap: Forming within an established trend, this gap can confirm ongoing sentiment, buyers continue to pay higher prices in an uptrend, or sellers accept lower prices in a downtrend. It reinforces confidence in the prevailing move.
Exhaustion Gap: Found in mature trends, this gap reflects late-stage trader entry at already overextended levels, reflecting poor timing, as most of the move has already occurred. It may signal panic buying or selling, with positioning then heavily skewed in the direction of the prevailing trend.
When positioning becomes overly one-sided, with no buyers left in an uptrend or sellers in a downtrend, price can be most vulnerable to a sentiment reversal, often triggering corrective moves.
US 100 Index: Watching the Gaps
The eagle-eyed among you will have noticed that the charts used to illustrate gap concepts above feature the activity of the US 100 Index, which since the April 7th low, is possibly a good example of these gaps in price action.
The latest gap, formed between last Friday’s close and Monday’s open, is labelled as both a possible continuation and exhaustion gap, as it’s unclear at present what this move currently represents. It could signal a continuation of the uptrend from the April lows, or mark an exhaustion point, raising the risk of a sentiment reversal.
Monitoring future price action may help determine whether the latest gap reflects continuation of the uptrend or signals exhaustion, suggesting the risk of price weakness.
If Latest Activity Proves to be a Continuation Gap
If the gap from Friday’s 25374 close is a continuation gap, it could signal a further phase of price strength. This would imply that if price action holds above 23474, upside momentum may still be evident.
If the US 100 Index holds above support at 25374 it may then go on to challenge the next resistance at 25937, which is the 61.8% Fibonacci extension. A break above this level might even open the path toward 26393, which is the 100% extension.
If Latest Activity Proves to be an Exhaustion Gap
If the latest gap activity reflects exhaustion, with positioning skewed too far to the long side, it may lead to a phase of price weakness following the recent advance. A closing break below 25374 could build on these themes and even suggest possibilities of a more extended phase of price weakness.
A move below 25374 could signal fading buying support, suggesting a shift toward lower levels. If evident, downside risks may extend to 25079, which is the 38.2% Fibonacci retracement, potentially even toward 24668, a level marking the 61.8% retracement.
The material provided here has not been prepared accordance with legal requirements designed to promote the independence of investment research and as such is considered to be a marketing communication. Whilst it is not subject to any prohibition on dealing ahead of the dissemination of investment research, we will not seek to take any advantage before providing it to our clients.
Pepperstone doesn’t represent that the material provided here is accurate, current or complete, and therefore shouldn’t be relied upon as such. The information, whether from a third party or not, isn’t to be considered as a recommendation; or an offer to buy or sell; or the solicitation of an offer to buy or sell any security, financial product or instrument; or to participate in any particular trading strategy. It does not take into account readers’ financial situation or investment objectives. We advise any readers of this content to seek their own advice. Without the approval of Pepperstone, reproduction or redistribution of this information isn’t permitted.

NAS100 ShortElite analysis
Both possibilities played out
Price liquidated NY high
Price reacted off of 4h structural liquidity
Targets lower liquidity pools

USNAS100 | Retest Phase Before Next Bullish LegUSNAS100 – MARKET OVERVIEW | Bullish Bias With Possible Retest 🇺🇸
The NASDAQ 100 recorded a new all-time high, maintaining strong bullish pressure, especially while trading above 25,890.
Currently, the price appears to be entering a short-term retest phase toward 25,700 before resuming its upward momentum.
A confirmed 1H candle close above 25,890 will reinforce the bullish continuation, targeting 26,040 → 26,200.
However, if the index trades below 25,890, a technical correction toward 25,700 is likely.
To confirm a bearish trend, the price must stabilize below 25,660, opening the path toward 25,340.
Key Technical Levels
Pivot Line: 25,890
Support: 25,700 · 25,340
Resistance: 26,040 · 26,200
Outlook:
NASDAQ remains bullish above 25,890, but expect short-term volatility near record highs.
A daily close above 26,040 would signal renewed strength, while sustained trading below 25,660 could trigger a deeper correction phase.

NAS100 – Price Enters Uncharted TerritoryZone 1: New All-Time High
This zone marks where the US session closed yesterday, establishing a new all-time high. Price has never traded this high before, putting the market in uncharted territory. Momentum remains strong, but with no historical structure above, traders should watch for signs of exhaustion or potential profit-taking as price explores this fresh high ground. A clean break and hold above the zone would confirm continued bullish control, while early rejection could spark a minor pullback.
Zone 2: Asia Session Open
Price opened around this level during Monday’s Asia session before accelerating sharply higher. The strong reaction from this area confirms it as an intraday demand zone and the first meaningful layer of support if price retraces. Should the market revisit this level today, traders will be watching closely for renewed buying pressure to defend the short-term uptrend.
Zone 3: Previous All-Time High
This zone marks last week’s US session close and the previous all-time high before the breakout. It now serves as deeper structural support, the base of the current rally. As long as price holds above Zone 3, the broader bullish structure remains intact. A clean break below, however, could suggest fading momentum and open the door for a deeper correction toward the prior range.
Today's sentiment
The Nas100 continues to trade with a cautiously positive bias after last week’s sharp rebound. Optimism is underpinned by improving risk sentiment, strong momentum in mega-cap tech, and renewed hopes that the Federal Reserve could adopt a more accommodative stance as inflation pressures ease. The partial US government shutdown, however, has delayed key macroeconomic releases, leaving markets “flying blind” and amplifying the potential impact of every new headline.
Geopolitical developments also remain in focus: progress in US–China trade dialogue has helped calm nerves, but investors are aware that tensions over technology exports and global supply chains could resurface quickly.
For traders, the setup favors tactical flexibility. Tech remains the market’s driving force, but with valuations stretched and volatility likely to spike on sparse data or political noise, short-term positioning and disciplined risk management are essential. In short, sentiment is constructive, but fragile.

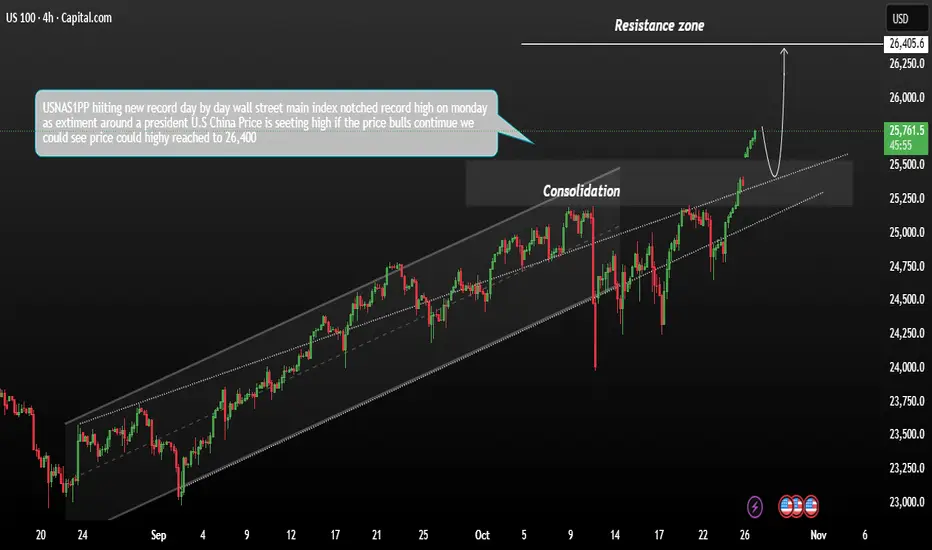
USNAS100 Consolidation Growth pattern The USNAS100 hit a new record high on Monday, driven by growing expectations of U.S. Federal Reserve interest rate cuts that continue to boost risk appetite. Optimism surrounding a potential U.S.–China trade agreement also supported sentiment at the start of a week dominated by major tech earnings.
Technically, the Wall Street index extended its bullish run, confirming strong upward momentum. However, a price test of near-term support could occur before the next leg higher. If the price holds and reacts positively at support, it could open the path toward the next resistance level at 26,400.
You my find more details in the chart.
Trade wisely best of Luck Buddies.
Ps; Support with like and comments for better analysis Thanks for Supporting.
NAS100 – Technical Analysis | Bulls Take ChargeNAS100 extended its bullish rally after breaking above 25,190.00 and 25,600.00, confirming strong buyer control. The index continues to print higher highs, with momentum favoring further upside as long as price remains above the breakout zone.
Support at: 25,600.00 🔽 / 25,190.00 🔽 / 25,000.00 🔽
Resistance at: 25,900.00 🔼 / 26,000.00 🔼
🔎 Bias:
🔼 Bullish: Sustained trading above 25,600.00 supports continuation toward 25,900.00 and possibly 26,000.00.
🔽 Bearish: A drop back below 25,190.00 could trigger a correction toward 25,000.00.
📛 Disclaimer: This is not financial advice. Trade at your own risk.

NASDAQ Watching 24,975 for Fresh Bounce in Ongoing UptrendHey Traders,
In tomorrow’s trading session, we are monitoring NAS100 for a buying opportunity around the 24,975 zone. NASDAQ remains in a broader uptrend and is currently undergoing a healthy correction, approaching the key 24,975 support and resistance area that aligns with the ascending trend structure.
If buyers step in at this level, we could see a continuation of the bullish momentum in line with the prevailing trend.
Trade safe,
Joe

$NDX Reaches 161.8% Fib ExtensionNASDAQ:NDX has again reached the 161.8% Fib Extension in its latest move of this Bull Market. The last time this occurred was July 10th, 2024. A key difference this time is that SP:SPX is not concurrently reaching the same extension, and is instead lagging in pace.
