NSDQ100 key trading levelsKey Support and Resistance Levels
Resistance Level 1: 25180
Resistance Level 2: 25300
Resistance Level 3: 25500
Support Level 1: 24655
Support Level 2: 24490
Support Level 3: 24330
This communication is for informational purposes only and should not be viewed as any form of recommendation as to a particular course of action or as investment advice. It is not intended as an offer or solicitation for the purchase or sale of any financial instrument or as an official confirmation of any transaction. Opinions, estimates and assumptions expressed herein are made as of the date of this communication and are subject to change without notice. This communication has been prepared based upon information, including market prices, data and other information, believed to be reliable; however, Trade Nation does not warrant its completeness or accuracy. All market prices and market data contained in or attached to this communication are indicative and subject to change without notice.
Trade ideas

NASDAQ is Nearing an Important Resistance Line.Hey traders, in tomorrow's trading session we are monitoring NAS100 for a selling opportunity around 25,500 zone, NASDAQ is trading in a downtrend and currently is in a correction phase in which it is approaching the trend at 25,500 support and resistance area.
Trade safe, Joe.

SELL NAS100 - WE TRY AGAIN!Good afternoon Traders
Trade what you feel and not what you see.
Good luck.

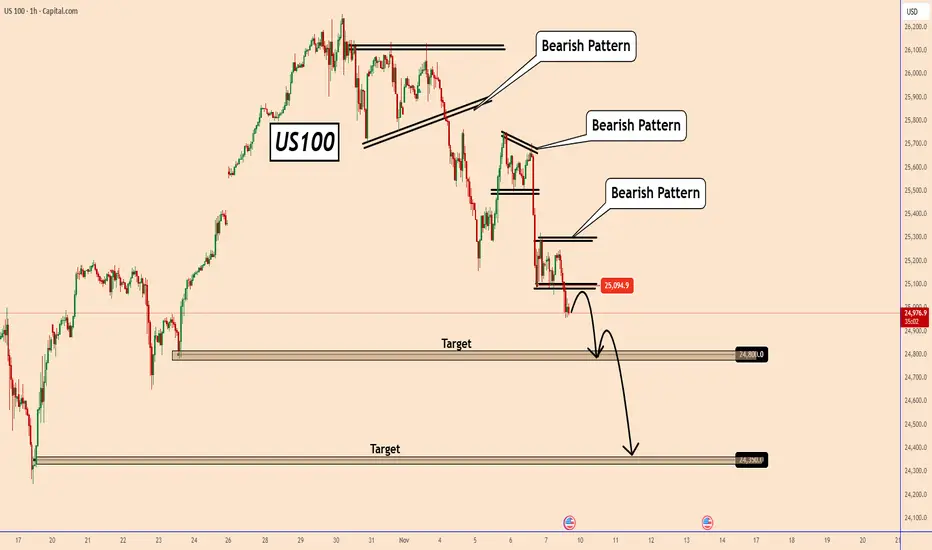
US100: Ready To Start a Downward Move?US100: Ready To Start a Downward Move?
A few days ago I posted an bullish forecast for US100.
US100 couldn't manage to break above the triangle pattern, and the price turned bearish.
Currently, we can see several bearish patterns one after the other. This sell-off started yesterday and may continue further in the coming days.
It could be related to earnings reports, AI bubble fears, etc. However, all indices were also heavily overvalued.
If the price respects this new bearish structure, we could see US100 falling to 24800 and 24350 first.
I will keep you all updated.
You may find more details in the chart!
Thank you and Good Luck!
❤️PS: Please support with a like or comment if you find this analysis useful for your trading day❤️
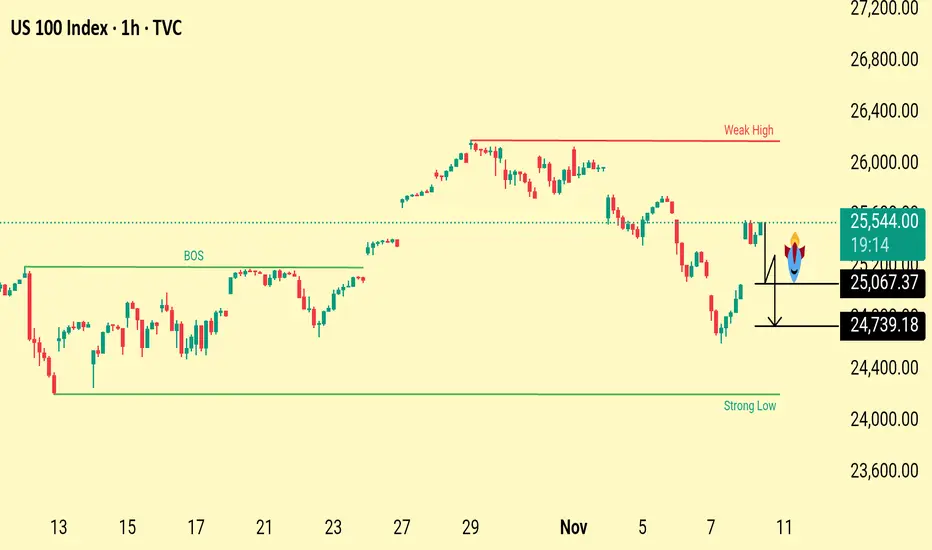
US100 Price Action Outlook Weak High Target&Liquidity SweepZonesThe chart highlights a weak high above current price action, suggesting potential upside liquidity targets. Below, key downside levels at 25,067 and 24,739 mark liquidity pools and possible retracement zones if price rejects current resistance. The structure shows a recent break of structure with both bullish and bearish scenarios in play.
Price is reacting near a resistance area after a recent bounce. The weak high above suggests liquidity may be targeted before any reversal. If price rejects this zone, the next downside levels to watch are 25,067 and 24,739, where liquidity sits and buyers may step in. Structure remains mixed, with both upward liquidity grabs and potential pullbacks likely
USNAS1OO Appear Breakout phase, with bullish pressure building.The USNAS100 (NASDAQ 100) appears to be in a consolidation-to-breakout phase, with bullish pressure building.
U.S. stock index futures are advancing on Monday following positive developments in Washington toward ending the U.S. government shutdown the prolonged shutdown had delayed key economic data releases and increased uncertainty over growth. Renewed optimism for resolution has improved risk sentiment, prompting buying momentum in equity futures.
If price sustains above 25,000 and momentum continues, bulls could “shut down” the recent NASDAQ decline by pushing toward 25,750 – 26,005 a strong breakout with volume could trigger further upside toward 26,250–26,500, aligning with the next major resistance zone.
You may find more details in the chart,
Trade wisely best of Luck Buddies.
Ps; Support with like and comments for better analysis Thanks for Supporting.

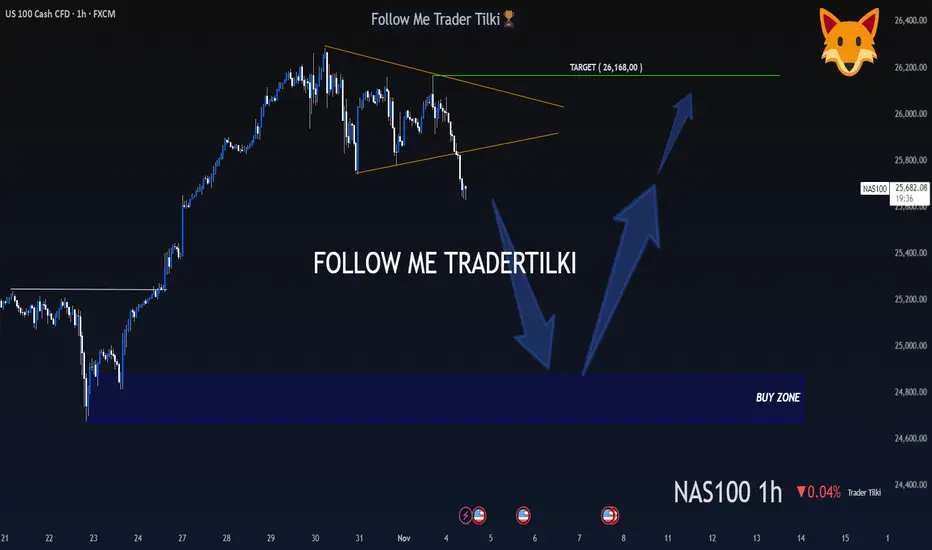
A Hunter Waits Patiently, Then Strikes Like a Lion - US100 - 1HMy dear friends, greetings,
My friends, I have set the buy levels for US100 at 24,872 and 24,677.
I will never enter a trade or put myself at unnecessary risk before these levels are reached.
My friends, in order to consistently win in this market and to become a successful trader, patience is essential.
If you act with patience and strategy, you will always be a winning trader, just like me.
I would also like you to know that my target is set at the 26,168 level.
My friends, every single like from you is my greatest motivation to share these analyses.
I sincerely thank everyone who supports me with their appreciation.
With my respect and love.
This is a "buy-the-dip" (bullish) strategy for NAS100.Wait for the price to pull back into the support area between the 0.5 Fibonacci level (25,144.7) and the 0.618 level (25,006.7).
Do not buy just because it touches the zone. Wait for a 4-hour candle to close within or above this zone, which confirms buyers are stepping in.
Your targets to take profit are the 0 level (25,725.5) and the -0.5 level (26,306.3).
Your stop loss would be placed below the 1 level (24,564.0), where the move started.
PS. The FIB never lies.

NAS 100Analysis in favor of the trend we see that there is liquidity and it should go to liquidate and make the movement you can see that it is a deep retreat to go for its new movement alcita

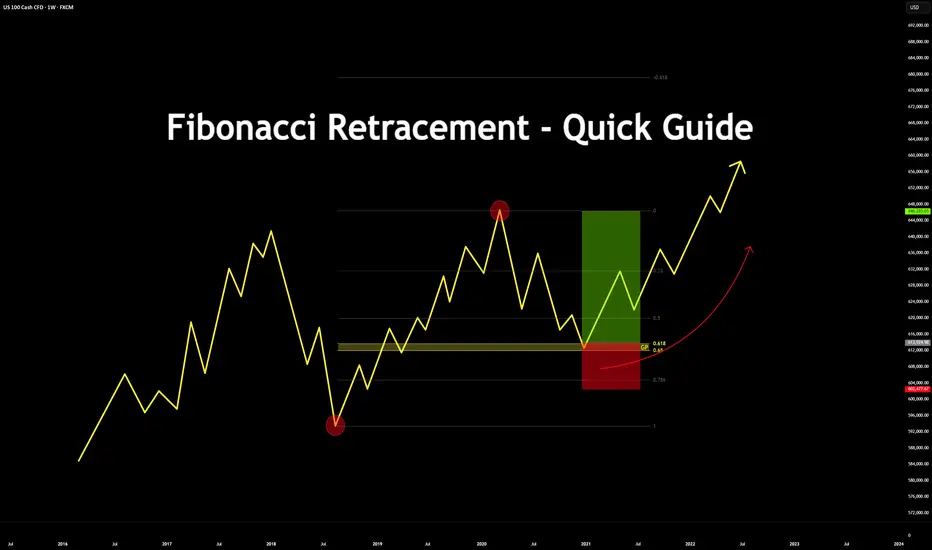
Fibonacci Retracement - Quick Guide in 5 StepsTrading the Fibonacci Retracement - Quick Guide in 5 Steps.
What is the Fibonacci tool?
The Fib Retracement Tool is a tool used widely across many charts. From crypto to stocks.
It assists in identifying the Golden Pocket, along with any potential Support and Resistance zones based on the sequence in Fibonacci.
Investors & Traders draw it from a previous high/low or low/high.
On a chart, each key level shows where price might pause or reverse during a pull back, before it continues the trend.
In this guide you will learn how to use the Fibonacci tool in 5 steps.
1. Configurations
Open up your Fib Retracement Tool's settings, apply the below configurations.
(You can change the color to your choice)
2. Identify High/Low's
Identify, recent highs and lows of your current chart/pair.
3. Applying Fib Retracement
Select your Fib Retracement tool. Place it on your chart starting from the swing low to the swing high.
4. Once completed
Highlight the Golden Pocket Field in the zone (0.65-0.618)
5. Review Entry
Price will eventually make it's way back down to the Golden Pocket to retest and reverse.
SL Placement would be on a previous low or key level, TP placement would be at a previous high or key level.
Bonus:
See the real time example below:
Please like, comment and follow if this guide was useful to you.
If you have any requests on analysis or tutorial requests, let me know and I'll be happy to make one!
NASDAQ Excellent rebound on the 1D MA50. Bullish.Nasdaq (NDX) has been trading within a 6-month Channel Up and last Friday made another 1D MA50 (blue trend-line) test exactly at the bottom (Higher Lows trend-line) of the pattern, and rebounded.
This has market the last two bottoms of the Channel Up and kickstarted the Bullish Legs, which have both been at +9.59%. As you realize, this it technically the pattern's strongest Support and most optimal buy entry for the medium-term.
We expect at least another +9.59% rally on the emerging Bullish Leg, targeting 26950.
-------------------------------------------------------------------------------
** Please LIKE 👍, FOLLOW ✅, SHARE 🙌 and COMMENT ✍ if you enjoy this idea! Also share your ideas and charts in the comments section below! This is best way to keep it relevant, support us, keep the content here free and allow the idea to reach as many people as possible. **
-------------------------------------------------------------------------------
💸💸💸💸💸💸
👇 👇 👇 👇 👇 👇

NASDAQ 100 — Key Intraday Reaction Zone (11 Nov)NASDAQ 100 (NDX) is currently trading inside a crucial intraday reaction zone around 25,550–25,650.
This area marks the intersection of previous structural resistance and short-term order flow buildup.
A clear break above this zone could signal continuation of bullish momentum, while failure to sustain may invite a short-term pullback.
Keeping an eye on how price behaves here during the U.S. session — this zone is likely to define the next directional move.
#NDX #NASDAQ100 #USMarket #PriceAction #TradingView #MarketAnalysis

NQ1 high probable shortsNas should be on a correction today for the H1 and H4 sells. I anticipate nas either breaking its bullish level where sellers sit in the next 2-3 days or continuing down for the next week or two.

US100 Free Signal! Buy!
Hello,Traders!
US100 Price has retraced back into a premium supply area after internal liquidity sweep. Smart money is likely to reprice lower, targeting inefficiency and equal lows beneath the recent range.
---------------------
Stop Loss: 25,256$
Take Profit: 24,951$
Entry Level: 25,133$
Time Frame: 3H
---------------------
Sell!
Comment and subscribe to help us grow!
Check out other forecasts below too!
Disclosure: I am part of Trade Nation's Influencer program and receive a monthly fee for using their TradingView charts in my analysis.

NASDAQ100 WATCH FOR HIGH PROBABILITY BUY SETUP SOON!!!🚨 NAS100 HIGH PROBABILITY BUY SETUP 🚨
* Here We Can See Clearly The Next Potential Moves For US100 Coming Hours/Days.
* Keep Your Eyes Close On Your Trading Positions.
* Happy PIP Hunting Traders.
FXKILLA.

Possible undercutIf this is an expanding ending diagonal, wave (4) can be considered complete. But according to fibs drawn from wave (1) beginning to top and wave (3) beginning to top one more undercut is possible to 0.76-0.786 and 0.86-0.886 area intersaction at VWAP from August 2 low. Shorting from here is risky, but that area may be a good spot to buy.

New Highs Before a Major Correction?The NASDAQ remains firmly within its main ascending trend channel, respecting both the upper and lower boundaries since mid-2023. After a sharp dip triggered by tariff-related headlines, the index quickly recovered, reaffirming bullish momentum and establishing a new support base along the lower trendline.
We’re now approaching the 2nd Fibonacci extension level drawn from the previous major top to the last significant bottom — a key confluence area that historically signals potential exhaustion of the current leg up.
Based on the current price trajectory, this zone could act as a probable top region, marked by the green resistance box on the chart. If the market reacts here, a technical correction or consolidation phase could unfold, retracing back toward the support zone around the mid-channel (highlighted in green).
The “500 Days Rich Man Theory” line (July 2026) may coincide with a macro cycle inflection point, suggesting a timing window for trend reversal or cooling period before the next long-term advance resumes.

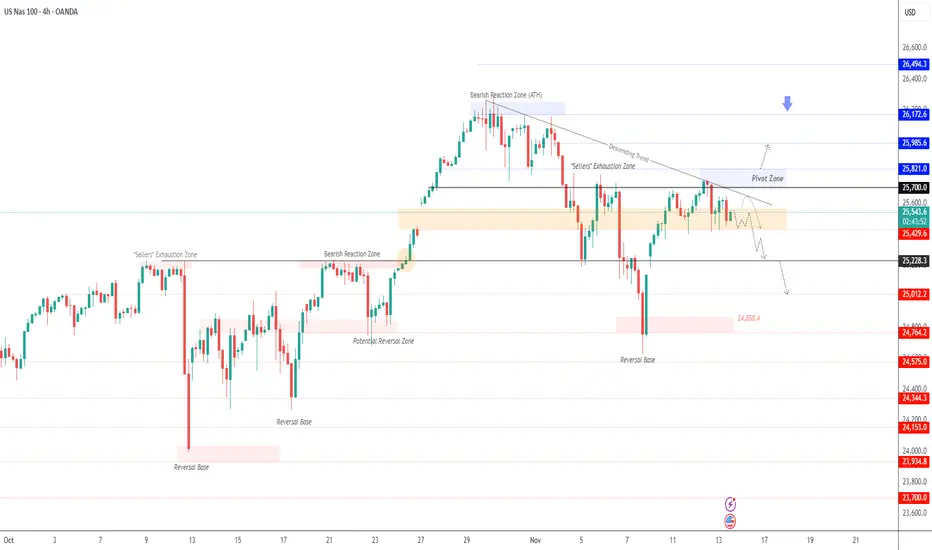
Nasdaq Holds Firm After Support Rebound| Focus on 25820 BreakoutUSNAS100 | Overview
The price retested our support at 25430 and bounced perfectly, just as outlined in the previous analysis.
After reaching the resistance zone, the index is now consolidating between 25700 and 25820, awaiting a decisive breakout.
A 1H close above 25820 would confirm bullish continuation, targeting 25960 and 26170.
However, a 4H close below 25700 would indicate the start of a bearish correction, with downside potential toward 25570 and 25430.
Pivot Line: 25700
Resistance: 25820 · 25960 · 26170
Support: 25570 · 25430 · 25230
Outlook:
USNAS100 remains bullish while above 25700, with upside targets at 25960–26170.
A confirmed 4H close below 25700 would shift the short-term tone to a bearish correction toward 25570–25430.

Tech Sector Pauses|USNAS100 Awaits Direction Between 25430–25700USNAS100 | Overview
The price is currently consolidating between 25430 and 25570, showing a slight bearish bias as momentum weakens near resistance.
As long as the index trades below 25570 and 25700, the outlook remains bearish, with downside potential toward 25430 and 25220.
A confirmed break below 25220 would accelerate losses toward 25010.
However, if the price closes a 4H candle above 25700, it would signal a bullish reversal, opening the path toward 25820 and 25985.
Pivot Line: 25570
Resistance: 25700 · 25820 · 25985
Support: 25430 · 25230 · 25010
US100 REBOUND AHEAD|LONG|
✅US100 is approaching a defined demand level where discount pricing aligns with bullish order flow. A potential rebound may deliver price toward the imbalance above. Time Frame 5H.
LONG🚀
✅Like and subscribe to never miss a new idea!✅

Smart Money Positioning on US100 – Liquidity Flow ExplainedRepeated failed highs, deep liquidity sweeps, and a tightly trapped range — the US100 is showing textbook smart money behavior.
Let’s decode how liquidity pockets, fake breakouts, and institutional accumulation are shaping the next 600+ point move.
🧭 Market Story – Where We Are Now
The US100 has been in a broad liquidity cycle after a strong rally.
Price is consolidating within a re-accumulation or distribution phase, hinting that smart money is positioning quietly before expansion.
🔹 Key Liquidity Zones
🟩 Breakout Level – 25,600
The make-or-break point.
Holding above 25,600 = bullish continuation potential.
Losing it = likely sweep back into liquidity below.
🔵 Liquidity Pocket – 26,150 → 26,350
This zone is loaded with stop liquidity.
Multiple failed breakouts = engineered liquidity traps.
A decisive breakout with volume could unleash a sharp institutional expansion toward 26,600–26,800.
🔴 Weekly Low Zone – 24,660 → 24,610
Where the market performed a major liquidity sweep before reversing.
Strong reaction = signs of accumulation.
A revisit here could form the final liquidity grab before the next rally.
🧩 Structure Breakdown
Sweep of Lows → Reaction — liquidity collected below prior swing lows.
Box Phase → Accumulation or Distribution — institutions building orders.
Trendline Rejections → Liquidity Creation — every “failed attempt” tells a story.
Compression Phase → Expansion Loading — pressure building before the breakout.
⚖️ Possible Scenarios
🚀 Bullish Breakout
Price holds above 25,600
Clean break above 26,150–26,350 liquidity pocket
Expansion move likely toward 26,600–26,800
🩸 Bearish Liquidity Trap
Rejection from 25,600 → 24,823 / 24,660 zone
Final liquidity sweep before strong reversal
Watch for aggressive bullish recovery candles
💡 Institutional Insight
Each failed breakout isn’t weakness — it’s intent.
Smart money builds liquidity where retail enters wrong.
When both sides’ liquidity is consumed, true direction begins.
👉 Liquidity is not just a zone — it’s market psychology visualized.
🧠 Educational Takeaway
The US100 demonstrates the full liquidity cycle at work:
Sweep → Trap → Accumulate → Expand.
Every fakeout clears inefficiency and builds the fuel for the next impulse.
Don’t chase — track where liquidity builds and follow the flow.
📊 Final Thoughts
The index is coiling between 25,600 and 26,350 — volatility is loading.
Above → Expansion Phase (trend continuation)
Below → Liquidity Sweep Phase (bullish trap setup)
Patience > Prediction.
Let the liquidity tell the truth — not emotions.
💬 Your Turn:
Do you expect a clean breakout or another trap before lift-off?
Share your bias below — let’s discuss how liquidity might play it out!

Wall Street Tech Rally Resumes | USNAS100 Holds Firm Above 25440USNAS100 – MARKET OUTLOOK | Bullish Bias Above 25440
The Nasdaq continues to trade with bullish momentum after stabilizing above 25440, supported by strength in tech stocks and improving market sentiment.
Above 25440: Bullish continuation toward 25700 → 25820 → 26170 (ATH).
Below 25430: Bearish correction possible toward 25230 → 25000 → 24760.
Pivot: 25440
Support: 25230 · 25000 · 24760
Resistance: 25570 · 25700 · 25820
USNAS100 remains bullish while above 25440, but a confirmed 1H close below 25430 could trigger a short-term bearish correction toward 25230–25000.

NASDAQ-100 (USTEC) | Elevated risks arise Sentiment:
- Extreme Fear in the market (F&G = 23)
- Investors are bearish (49% bearish vs 37% bullish)
- Volatility elevated but not extreme (VIX 20)
- Higher Put activity and an elevated put/call ratio (1.11)
- Hedge funds unwinding crowded AI longs (50% market cap concentration)
- Record institutional options activity positioning for Q4 2025-Q1 2027
- COT report: No latest data due to the US government shutdown
Interpretation:
- Put hedge elevated = cautious as institutional hedging and distributing stocks to retail
- Extreme Fear + High Bearishness = Potential buying opportunity (later stage)
- When sentiment is this negative, often near bottoms
Fundamental:
- Valuation Concerns:
- 24-25x Forward P/E - vs 20-22 for 5-year average
- 3.08-3.37x P/S ratio - 2.35-2.41 for 5-year average
- Dec Fed cut probability is declining
Technical:
- USTEC broke the ascending trendline and EMA21, indicating potential mean reversion to EMA78, which is just above the support cluster at around 24000.
- Breaking below 24000 may prompt a decline to the following support cluster at around 23000, which is a prominent zone for sentiment contrarians step into the market if market fear remains at an extreme level.
My take on this:
- The distributing process may last for a while before reaching more extreme panic sentiment, prompting consideration of a contrarian approach based on technical levels.
- Therefore, we need to watch the price action to determine the best entry setup for the Long position. Then, for now, short-term pressure is the better take.
Analysis by: Dat Tong, Senior Financial Markets Strategist at Exness
