TRBUSDT.3L trade ideas


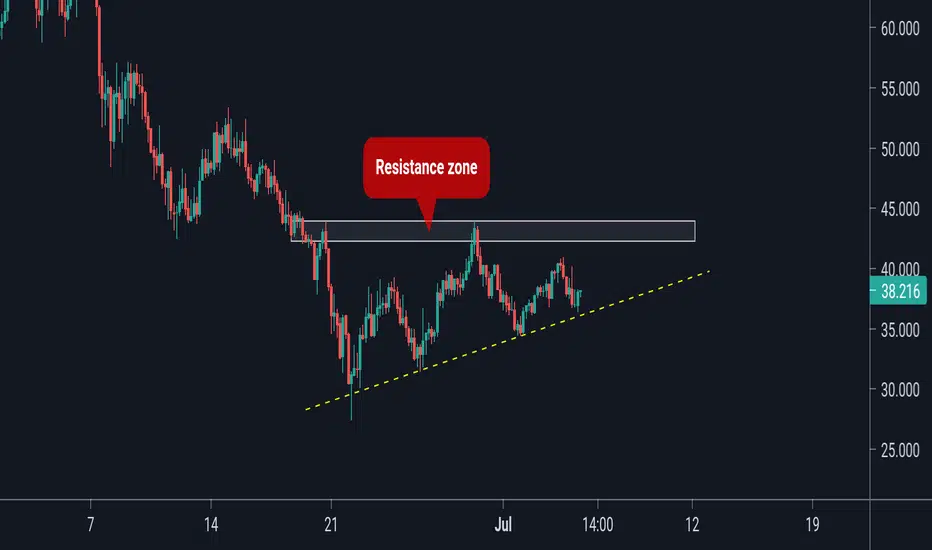
Watch for breakout or for bounceTRB in range and in a symmetrical triangle, you could enter on the breakout from triangle but safer on some of the levels break or bounce ...


TRB Ascending TriangleTRB / USDT
Ascending Triangle
I will be bullish after break and hold above the upper resistance
Best of luck


TRB/USDT Long Short-Term TradeIndicators
4H & 1H RSI shows that TRB/USDT is looking to break 50s level after ending a small bearish pattern three days ago as graph shows strong support in that area.
MA CROSS (50,100) lines are about to confirm a bullish cross after almost three weeks in 4h & in the 1H chart bullish cross is just running but facing sideways daily crosses.
ADX (4H) on DMI below 20 which often indicates "non-existent trend" and reached a line resistance between 14-15 points, bearish for now. DMI+ (4H) battling trend reversal with DMI- with no trend power from ADX.
Pattern
(4H) Measured Move Up (1H, 30 min) Bullish Symmetrical Triangle Break
Conclusion
Conclusion
Trade set up based on short term support @38.00 as well as a 12-day bullish trend. Price just bull broke the triangle pattern and confirmed by bouncing off midterm bearish trend line. As it holds up, target is to find profit off this breakout of the overall bearish momentum in the crypto market. Profit targets were set up based on the Long Position tool upon the already marked support and resistance prices. Entry Level must be from a lower price range to gain short term RSI strength to then proceed to first target just discussed. The four profit targets shall go to 7% while max downside is 3%.

TRBUSDT - Long - Potential 51.20%TRBUSDT - Long - Potential 51.20%
Exchanges: Binance, Huobi.pro
Signal Type: Regular (Long)
Entry Zone:
31.562 - 35.0825
Take-Profit Targets:
1) 37.324
2) 42.345
3) 53.046
Stop Targets:
1) 27.199
Entry Triggers- Big reversal incoming, RSI signalling a buy here.


TRB Potential Channel Break OutHello Everyone, If You Like The Idea, Do Not Forget To Support With A Like And Comment .
If You Want To See Any Coins Technical Analyse Put The Name On Comment .
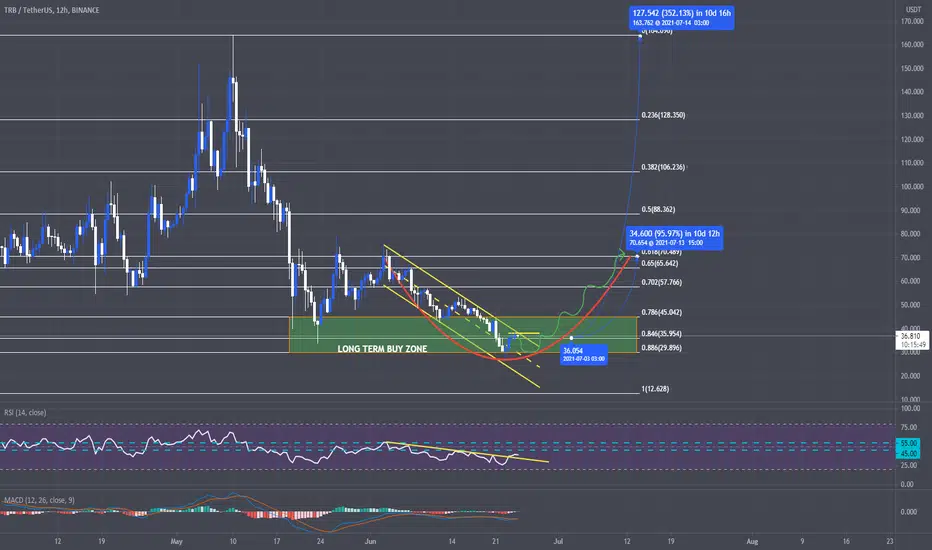
TRB Has 63M Cap . Launched In 2019 But Listed On Major Exchanges Like Binance And Coinbase Pro . Finished First Big Formation ( Cap and Handle ) And Now Has A Nice Downward Channel Which Can Take It To Cap Again . I WIll Wait Clear Break To Trade In Short Term . In Long Term Its Sitting On Long Term Buy Zone , Has Low Profit But📍📍📍 TRB Looks Like On Of The Gem Proje In Polygon Ecosystem . Listed On So Many Exchanges And On Coinbase Pro When Market Was Bearish . I Think 2nd Leg Would Be Very Bullish .
Note : Its Long Time Market Dont Allow Good Buy Opportunities To Buy Alts And HODL . Alts Doesn't Have Deep So No One Can Catch The Dip If BTC Break 30K . I'm Going To Add Coins To My Bag Which Entered Long Term Buy Zone With Using Strategy Sell 50% On Every 100% Profit .
Warning : This LvLs Are Gate Of New Session So Don’t Enter Altcoins All In . Personally Planning Bought Alts With 20% Portfolio .
Important : Please Use RM (Risk Management) and MM (Money Management) If You Decide To Use My Ideas, There Will Always Be Unprofitable Ideas, This Will Definitely Happen, The Goal Of The System Is That There Will Be More Profitable Ideas At A Distance


TRBUSDT going down to 63There is head and shoulders pattern with the tp of 63 in the 15 and 30 min timeframe.
The trend line being broken also confirms this analysis. The top black line is the top of a long term channel to which the price has shown reaction being aligned with the top line of the triangle.
We see also a rising triangle in the hourly timeframe with the 5th wave remained to be completed from top the lower line of the triangle shown with the blue line making the price lower to 62-63


🆓Tellor (TRB) May-28 #TRB $TRBTRB has just been rejected from 75$ zone and is heading to 55$ zone then may generate new rally up to 90$ or even 130$ zone in June. But if it loses 55$ zone, it will fall down to retest 40$ zone again or fall deeper to 20$ zone. So we need to pay attention to 55$ zone
📈BUY
-Buy: 53-57$ if A. SL if B
-Buy: 73-77$ if A. SL if B
📉SELL
-Sell: 73-77$. SL if A
-Sell: 88-92$. SL if A
-Sell: 127-133$. SL if A
♻️BACK-UP
-Sell: 53-55$ if B. SL if A
-Buy: 39-41$. SL if B
-Buy: 19-21$. SL if B
❓Details
🕯Timeframe : 1 Day
📈Red Arrow : Main Direction as BUY and SELL section
📉Blue Arrow : Back-Up Direction as BACK-UP section
🟩Green zone : Support zone as BUY section
🟥Red zone : Resistance zone as SELL section
🅰️A : The Close price of candlestick is Above the zone
🅱️B : The Close price of candlestick is Below the zone


TRBUsdt #318this is not pro analyse pls chekc others first ::::))
rank is #318 on coin market map
TRB in good channel now in correction adn rdy for going up
PROTECTION is :
80.379
resisdance :
95.544
106.059
TARGETS :
114.825
125.243
140.844
GOAL is :
164.174
199.006
long TP :
253.320
327.760
GL

TRBUSDT say hello to us ^-^If it does not lose its level of resistance, it can record the new price ceiling for itself.
