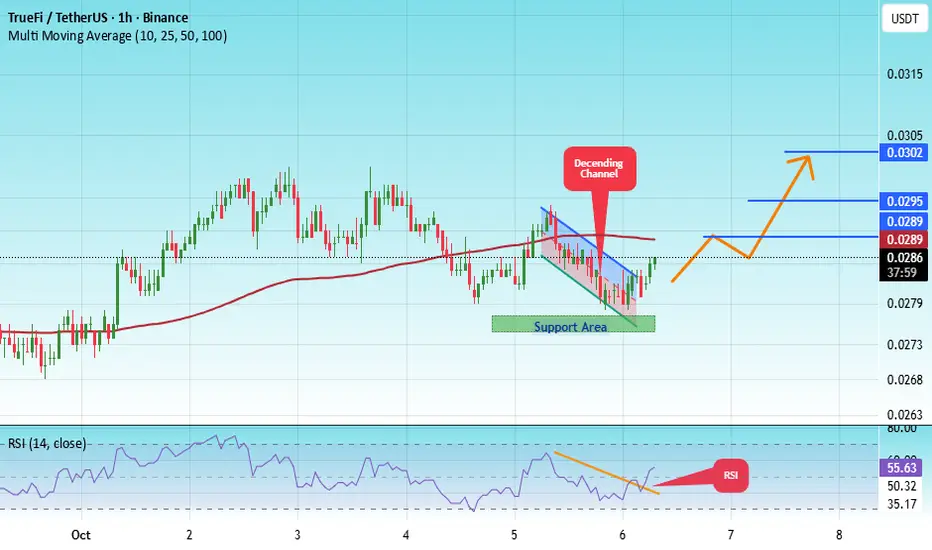
#TRU/USDT Forming Falling Wedge ? #TRU
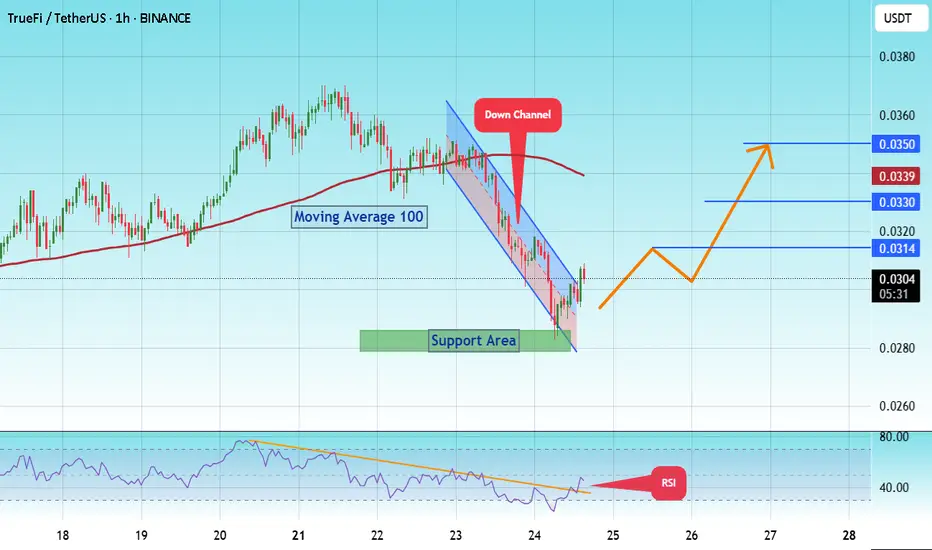
The price is moving within a descending channel on the 1-hour frame, adhering well to it, and is heading for a strong breakout and retest.
We have a bearish trend on the RSI indicator that is about to be broken and retested, which supports the upward breakout.
There is a major support area i
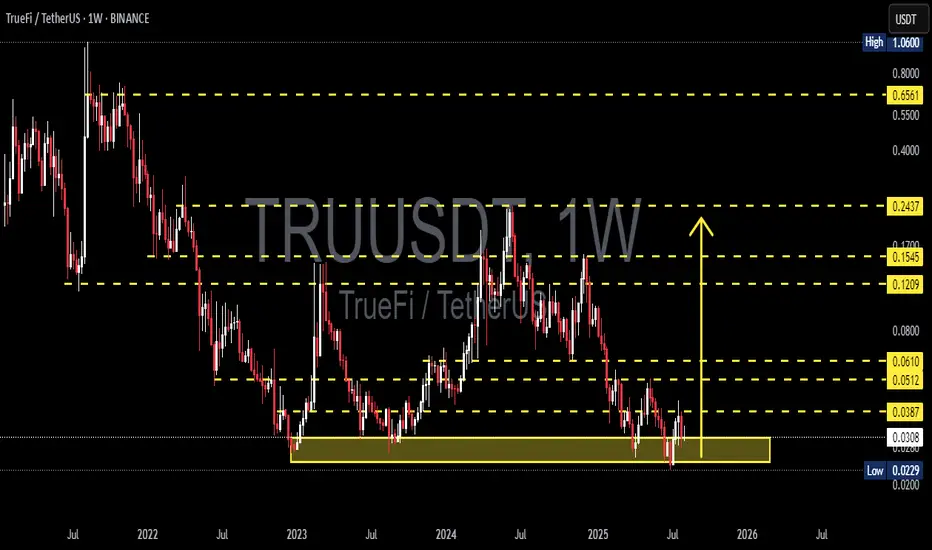
TRUUSDT Setup – Real World Asset DeFi Play | Buy Zones + Target📌 Coin: TRU (TrueFi)
💰 Buy Levels:
✅ First Entry: $0.0378
✅ Second Entry: $0.0325
✅ Third Entry: $0.0270
🛑 Panic / SL Level: Weekly close below $0.0240
🧠 Fundamental Analysis (FA) – In Short
*️⃣ Sector: DeFi / Real World Assets (RWA) Lending
*️⃣ Use Case: TrueFi is a decentralized credit protocol f
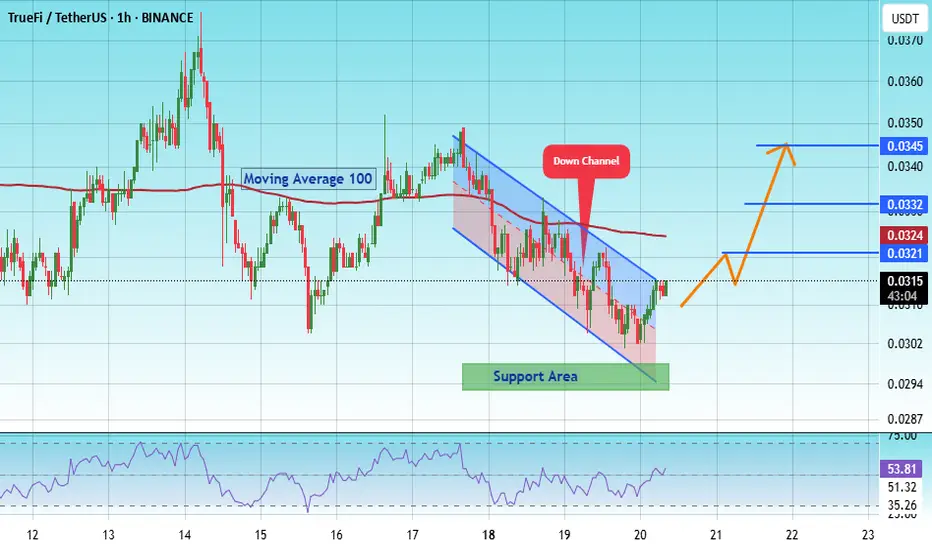
#TRU/USDT Forming Falling Wedge ? #TRU
The price is moving within an ascending channel on the 1-hour frame, adhering well to it, and is on track to break it strongly upwards and retest it.
We have support from the lower boundary of the ascending channel, at 0.0295.
We have a downtrend on the RSI indicator that is about to break a
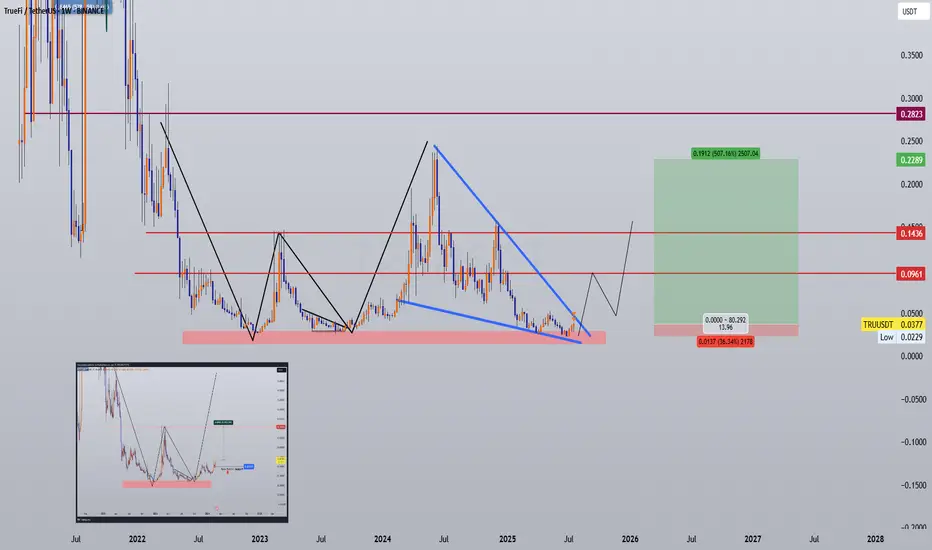
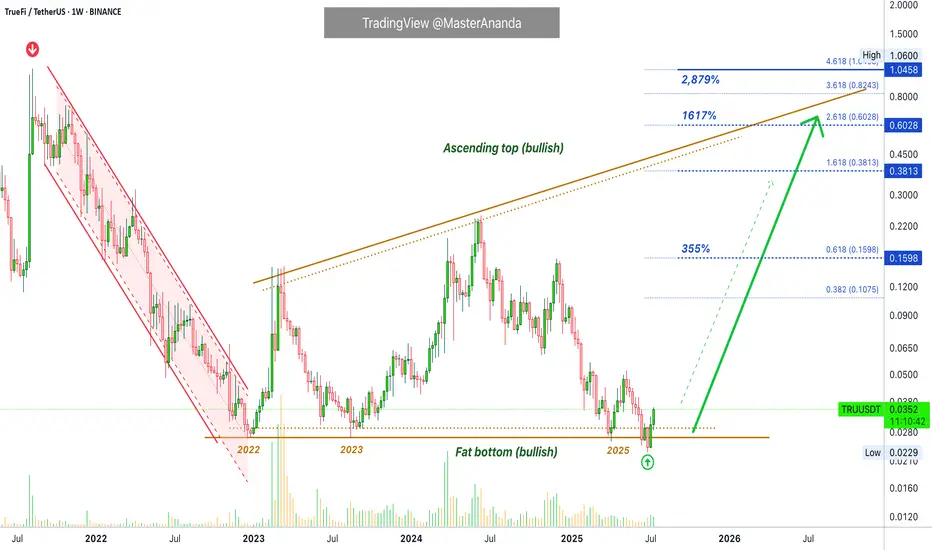
TRU/USDT Weekly – On the Verge of a Reversal or Breakdown?📌 Overview:
TRU/USDT is currently trading within a key long-term demand zone between $0.0229–$0.0307 — an area that has consistently acted as a strong bounce level since early 2023. Now that this zone is being tested again, the outcome could define the next major move for TrueFi.
---
🔍 Market Str
TRUUSDT Forming Falling WedgeTRUUSDT is currently exhibiting a Falling Wedge Pattern, a well-known bullish formation that often signals the end of a downtrend and the beginning of a strong upward move. This pattern is characterized by descending trendlines that converge, showing reduced selling pressure and a potential shift in
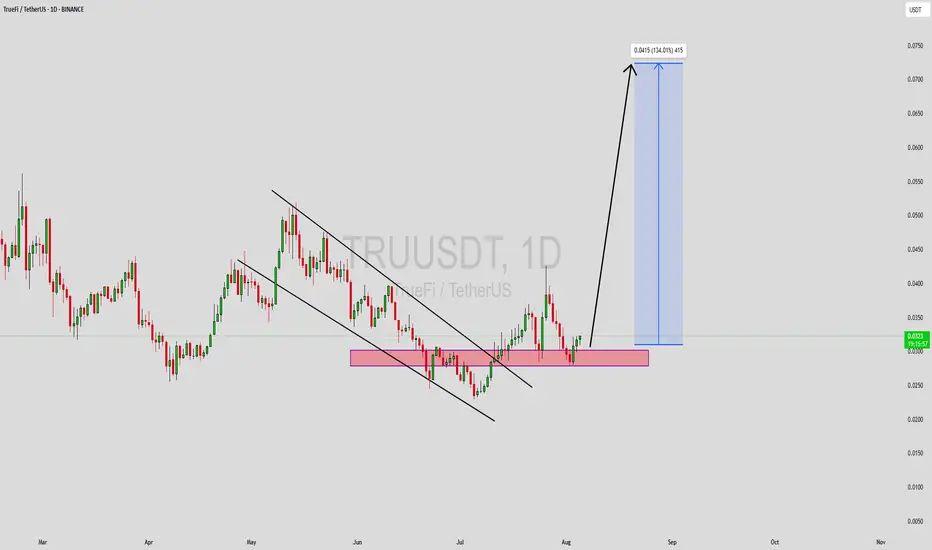
#TRU/USDT Low Risk vs High Rewards#TRU
The price is moving within a descending channel on the 1-hour frame and is expected to break and continue upward.
We have a trend to stabilize above the 100 moving average once again.
We have a downtrend on the RSI indicator that supports the upward break.
We have a support area at the lowe
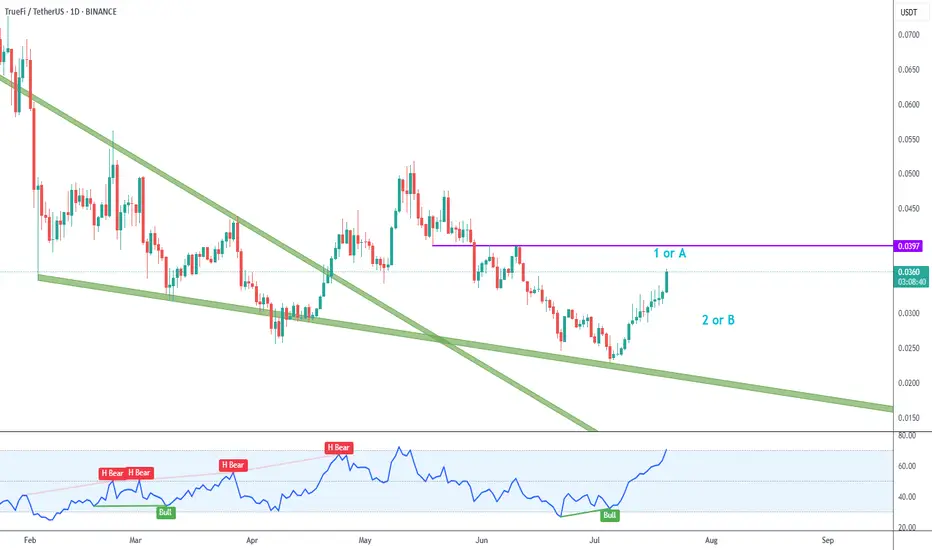
TRU Upside Reversal
Truefi´s recent upside after touching the green descending trendline looks convincing, with a motive wave and bullish RSI divergence.
I´m labeling this as wave 1/A.
Right now price is overbought, so I´ll wait for wave 2/B pullback to look for long trades.
Next key resistance zone is just below 0
TrueFi · Bitcoin vs the Altcoins · Low Risk vs High RewardsTrueFi is trading at bottom prices. Notice the big difference between this pair and the ones that are trading high, near resistance or at a new all-time high. This is the difference I want to point out to new buyers.
If you are entering the market just now, you should be considering pairs like this
TrueFi (TRU)#TRU
The price is moving within a descending channel on the 1-hour frame and is expected to break and continue upward.
We have a trend to stabilize above the 100 moving average once again.
We have a downtrend on the RSI indicator that supports the upward break.
We have a support area at the lowe


See all ideas
Summarizing what the indicators are suggesting.
Oscillators
Neutral
SellBuy
Strong sellStrong buy
Strong sellSellNeutralBuyStrong buy
Oscillators
Neutral
SellBuy
Strong sellStrong buy
Strong sellSellNeutralBuyStrong buy
Summary
Neutral
SellBuy
Strong sellStrong buy
Strong sellSellNeutralBuyStrong buy
Summary
Neutral
SellBuy
Strong sellStrong buy
Strong sellSellNeutralBuyStrong buy
Summary
Neutral
SellBuy
Strong sellStrong buy
Strong sellSellNeutralBuyStrong buy
Moving Averages
Neutral
SellBuy
Strong sellStrong buy
Strong sellSellNeutralBuyStrong buy
Moving Averages
Neutral
SellBuy
Strong sellStrong buy
Strong sellSellNeutralBuyStrong buy
Displays a symbol's price movements over previous years to identify recurring trends.