TRON/USDT: Watching Head and Shoulders FormationHi guys!
I’m watching TRON/USDT on the 1-hour chart, and we’re nearing the end of a compression phase (highlighted in the chart). The price has been consolidating, and I believe a breakout could happen soon.
What stands out to me is the Head and Shoulders pattern forming . I’ve marked the Left Shoulder, Head, and Right Shoulder on the chart. If the price breaks the neckline, I’m expecting a bullish move to follow (around 0.3466 ).
I’m also keeping an eye on the descending trendline. If the price breaks above this trendline, it could strengthen the case for an upward move.
In short, if the price breaks the neckline and the trendline, I’m expecting a bullish move to around 0.3466. If these breaks happen, I’ll be watching for further upside potential.
TRXUSDT.3L trade ideas

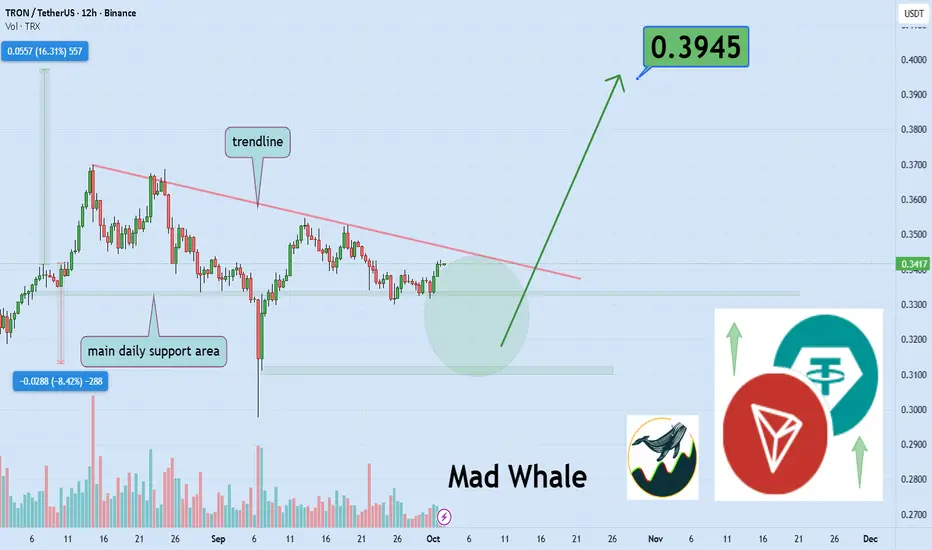
Traders watch TRX for 16% rebound to $0.3945Hello✌️
Let’s analyze Tron’s price action both technically and fundamentally 📈.
🔍Fundamental analysis:
TRON’s first perpetual DEX, hit $30M TVL as Proposal #789 cut network fees by 60%.
These moves could boost TRX demand across derivatives and micro-transactions, though risks remain.
📊Technical analysis:
BINANCE:TRXUSDT is testing a key daily support, with the daily trendline poised for a breakout; if confirmed, a potential 16% upside toward $0.3945 could unfold. 📈🚀
📈Using My Analysis to Open Your Position:
You can use my fundamental and technical insights along with the chart. The red and green arrows on the left help you set entry, take-profit, and stop-loss levels, serving as clear signals for your trades.⚡️ Also, please review the TradingView disclaimer carefully.🛡
✨We put love into every post!
Your support inspires us 💛 Drop a comment we’d love to hear from you! Thanks, Mad Whale
Tron Poised for Bullish mov...Trx Breaks 1hr resistance , that is a good Bullish signal to go long targeting daily order block

TRX/USDT – Long-Term Buying Opportunity?1. Quick Market Recap
Since the double top near 0.37 in mid-August, TRX has been under pressure. A strong spike down early September briefly shook the market, but buyers stepped in quickly, recovering the price back into the 0.35 zone.
However, momentum faded, and the coin started to roll back again.
2. Key Question
Is this pullback simply a healthy correction in a broader bullish trend, or the start of a deeper breakdown?
3. Why I Lean Toward a Buying Opportunity
• The overall trend remains bullish despite the correction.
• The quick recovery from the September spike showed strong buyer interest.
• Supports at 0.30 and 0.2750 align with attractive long-term accumulation zones.
4. Trading Plan
• If price breaks below 0.33, I will watch for a retest of the 0.30 support — a strong level that held earlier this month. For me, this is a medium to long-term entry opportunity.
• If the correction extends deeper toward 0.2750, I plan to DCA (dollar-cost average) into the position.
• My medium/long-term target remains 0.50, aligning with the bullish structure of TRX.
5. Final Note
Corrections in bullish markets are often where the best opportunities appear. TRX fits this pattern well, and in my opinion, it’s shaping up as a solid candidate for accumulation with a 0.50 target 🚀

TRX LONG TRADE SETUPNew Trade Setup: TRX-USDT
LONG
Entry: 0.3452 or CMP
Target: TP1: 0.3514, TP2: 0.3576, TP3: 0.3638, TP4: 0.3701
Stoploss: 0.3290
Leverage: 2X
Technical Analysis: TRX/USDT is taking support from its support area there is high change of short term of trend reversal, we can see up trend in short term.

Troncoin long back to $0.34500 areaJust now opened up a long position on trx.
Market got rejected strongly and looks likely to continue trending up a bit more before lower prices.
Sl: 0.33893
roughly 2RR

TRXUSDT The chart BINANCE:TRXUSDT was deep spike but this is exit seller from game and entry again byers. We can buy in supports (0.3330 to 0.3450) but for hold in.
Please control risk management for your trades.

TRONJust a line I drew while I'm drinking.
TRX is forming a strong ascending structure after a long consolidation. Price has broken above the mid-level resistance and is now retesting it as support. If this level holds, we could see a breakout toward the next resistance zone around 0.4184 USDT, which is a potential 16% move from current levels.

DeGRAM | TRXUSD rebound📊 Technical Analysis
● TRX/USD rebounded sharply from 0.3212 support, breaking above the descending channel’s upper boundary and signaling a shift toward bullish momentum.
● Price is consolidating near 0.3345 resistance; a sustained break higher opens the way to 0.3420 and potentially 0.3500.
💡 Fundamental Analysis
● TRON’s TVL expansion and rising stablecoin transfers provide fresh tailwinds, while improved crypto sentiment from BTC stability supports altcoin recoveries.
✨ Summary
Bullish above 0.3345; targets 0.3420 → 0.3500. Invalidation on a close below 0.3212.
-------------------
Share your opinion in the comments and support the idea with a like. Thanks for your support!

TRX/USDT Technical (1W Timeframe)Overall Trend:
TRX has clearly broken out of a long-term descending resistance line (bearish trendline) and has been in a sustained uptrend since.
The breakout was followed by a steady series of higher highs and higher lows, confirming bullish market structure.
The ascending black trendline is holding well, confirming strong buyer interest on dips. If TRX stays above this line, bullish continuation is favored.
Bullish: As long as TRX holds above $0.3030 and the rising trendline, the outlook remains positive.Next Targets: A break above $0.3682 could push TRX toward $0.4515, and a successful breakout above that may open the door toward $0.50+ in the mid-term.
Risk: A breakdown below the ascending trendline and $0.3030 support could trigger a correction back toward $0.2576 or even $0.2073.

Troncoin short back to $0.34190Sl: 0.34964-0.35
Monitor for closure around $0.34385
Full exit at $0.34190

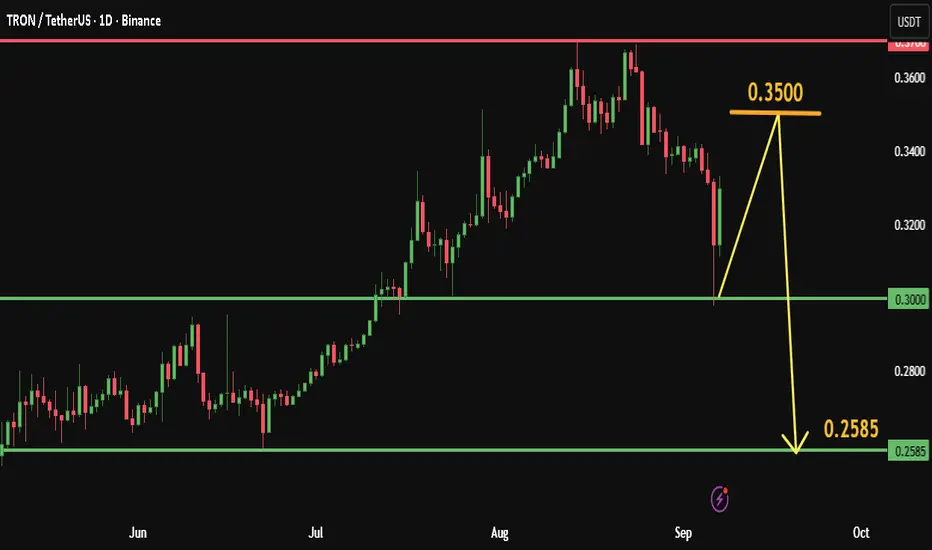
TRX Will Test Resistance Before drop, Liquidity Weakness SignalsI’ve noticed over the past few days that liquidity indicators on the TRON network (TVL – Total Value Locked) have started to decline significantly.
Outflows from lending protocols and centralized exchanges are usually a short-term weakness signal, since it means that funds previously locked are now being pulled out.
📊 On the TRX/USDT chart, the price is currently ranging between the strong resistance at 0.3700 and the solid support at 0.3000.
🔼 The price may rise to test the resistance level at 0.3500,
then potentially retrace back toward 0.3000.
The main support is around 0.3000; if broken, it could push the price down to the next support at 0.2585.
Liquidity behavior often precedes price movement.
Personally, as someone who focuses on liquidity analysis and market maker activity, I believe that continued outflows could put more pressure on TRX. However, if large wallets step back in, this could quickly turn into a bullish opportunity.
The question is:
Do you think TRX is really under short-term pressure ?
Or is this just a shakeout before the next rally ?
✅ Write a comment with your favorite altcoin hit the like button, and I'll provide my analysis in the reply. Trading is simpler with the right coaching.
My analyses are personal opinions, not trade setups.
Thank you for your support, and I wish you successful trades 🌹
TRXUSDT | Technical Outlook & Market ContextTRON (TRX) is one of the leading blockchain-based operating systems designed to decentralize the internet by enabling efficient smart contracts and high-throughput transactions. Known for its scalability and low-cost transfers, TRON continues to attract developers and users in the DeFi and entertainment ecosystems.
In this chart, I highlight the key technical levels, trend structure, and market momentum that traders are currently watching. The focus is on potential support and resistance areas, as well as price behavior around critical zones that could define short- to mid-term direction.
⚠️ Disclaimer: This content is for educational and informational purposes only. It does not constitute financial advice. Always do your own research before making any investment or trading decision.
#TRX #TRON #Crypto #TechnicalAnalysis #Blockchain #Altcoins #CryptoCommunity #PriceAction #Charting #MarketOutlook

Tron (TRX): Liquidity Sweep Restarted The Chart | BullishCRYPTOCAP:TRX had a quick liquidity sweep, but buyers stepped in aggressively and regained control of the zone. For now, momentum remains with the bulls, and our current target sits at $0.37. Once that level is reached, we will monitor price action closely
If resistance holds, a pullback is possible, but if buyers manage to break through, the next target will be the upper resistance zone.
Swallow Academy

Troncoin long to $0.34376Just now opened a long position on troncoin
Aiming for $0.34376 area
Time sensitive
2-3RR

TRXUSDT-4h-LONGThe red cycle appears to have completed around the recent peak in July-August, indicating a potential reversal point.
The price has approached the lower boundary of the ascending Fibonacci channel, which coincides with the completion of the red cycle.
The interaction at this support could lead to a bounce if buying pressure increases, or a breakdown if selling continues, depending on subsequent candlestick patterns and volume.
This confluence marks a critical area to watch for confirmation of the next trend direction.

TRON Wave Analysis – 9 September 2025- TRON reversed from the round support level 0.3000
- Likely to rise to resistance level 0.3500
TRON cryptocurrency recently reversed up from the strong support zone between the round support level 0.3000 (which has been reversing the price from July, as can be seen below) and the 61.8% Fibonacci correction of the upward impulse from June.
The upward reversal from this support zone created the daily Japanese candlesticks reversal pattern Hammer.
Given the clear daily uptrend, TRON cryptocurrency can be expected to rise toward the next resistance level 0.3500 (former resistance from July).

Result of previous analysisPrice targets for ADA, Arbitrum and Tron have been touched. You can see my analysis in previous Publish.
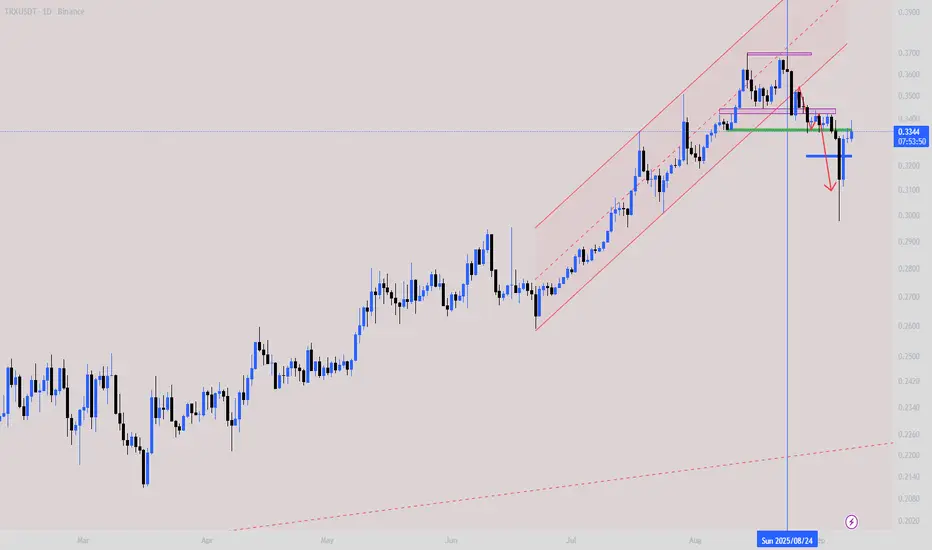
TrxusdtBecause the channel has been broken, you should enter on the pullback to fall. The less risky option is to enter after the support area is broken, or enter on the pullback and reduce volume on the support area. The price targets are the green and blue lines, respectively, and finally the end of the red arrow.
TRX: Justin Sun’s Play | September 08, 2025.Sergio Richi Premium ✅
CRYPTOCAP:TRX #Crypto #Tron 🪙 — TRX: Justin Sun’s Play | September 08, 2025.
Price (Sept 8, 2025) : $0.3323
Asset Overview:
Tron (TRX) is a high-throughput blockchain platform focused on decentralizing the internet through dApps, smart contracts, and content sharing. Founded in 2017, it supports fast, low-cost transactions (up to 2,000 TPS) and powers ecosystems like DeFi, NFTs, and stablecoins (e.g., $79B USDT supply).
TRX is used for fees, staking, and governance, positioning Tron as a scalable alternative to Ethereum.
Key News (Sep 1-7, 2025):
• Treasury Boost: Tron Inc added 312.5M TRX (~$110M) to holdings, doubling to $220M for grants, liquidity, and AI/DeFi growth—echoing MicroStrategy's BTC strategy.
• Ecosystem Hype: High engagement outpaces rivals; WLFI token unlock ties to Sun spark interest.
Institutional Accumulation:
• Tron Inc leads as a "MicroStrategy of TRX," filing for $1B securities to accumulate TRX (never sell) via Nasdaq listing/reverse merger with SRM Entertainment.
• XRP whales shifting to TRX pre-ETF hype; VanEck offers TRX ETP for exposure.
Market Maker Wintermute
💡 Entry & Exit:
Entry: $0.3323 (spot long)
🎯 Take Profit: $0.6646 (+100%)
My View:
After the correction, Tron is looking solid for continuing its uptrend.
Big players holding long positions on TRX/USDT are showing strong metrics, and market maker Wintermute doubled its investment in Tron over the past week, which boosts confidence for further growth.

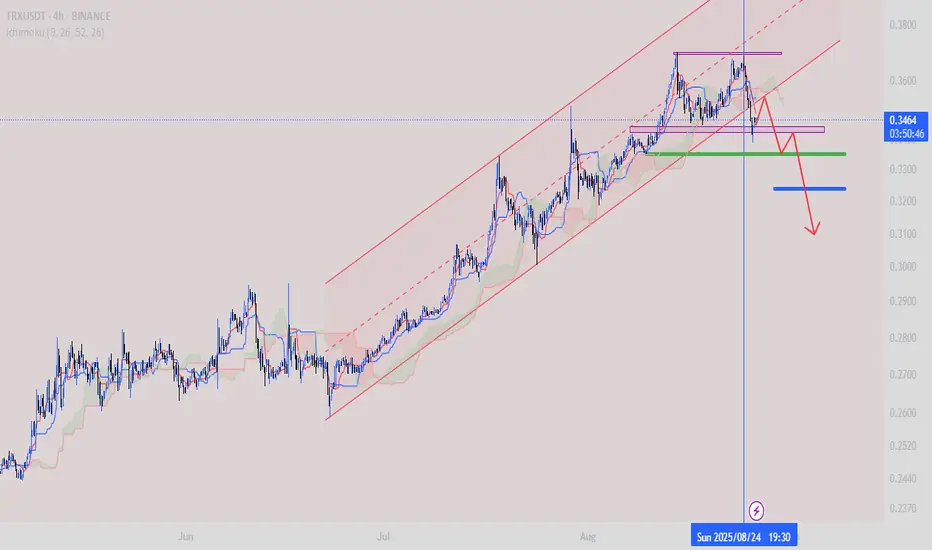
DeGRAM | TRXUSD fixed under the resistance line📊 Technical Analysis
● TRX/USD is moving lower inside a descending channel, with repeated rejections from the upper boundary around 0.3444 signaling persistent selling pressure.
● Price is now testing the mid-range near 0.3388; a breakdown would likely expose 0.3341 and extend the bearish momentum toward the channel base.
💡 Fundamental Analysis
● Despite TRON’s stablecoin activity growth, broader market risk-off sentiment and weaker altcoin flows are capping upside potential for TRX.
✨ Summary
Bearish below 0.3444; targets 0.3388 → 0.3341. Invalidation on a close above 0.3450.
-------------------
Share your opinion in the comments and support the idea with a like. Thanks for your support!

Trx Trade of the dayThis chart is a rising wedge pattern if close below the pattern it have 70% good probability to dump hard keep an eye on this chart for the candle to close below the pattern.

Tron Price Holds $0.31 Support, Eyes Rally Toward $0.43Tron price action recently corrected lower but quickly found its footing at $0.31, where the 0.618 Fibonacci retracement coincided with a key weekly support. The strong bounce has reinforced confidence in the ongoing bullish trend, suggesting that the corrective move was a healthy reset rather than a reversal.
Tron Key Technical Points
- Support Confirmation: Price held above $0.31, aligning with the 0.618 Fibonacci retracement.
- Upside Targets: Key resistance sits at $0.36, with further expansion possible toward $0.43.
- Market Structure: Consecutive higher lows continue to signal bullish momentum despite recent correction.
Analysis
The recent correction on Tron allowed price to retest crucial technical levels, and the defense of $0.31 has proven significant. This level acted as both Fibonacci support and a weekly structure base, and the strong close above it confirmed demand remains present. Such confluence makes this zone a cornerstone for the current bullish setup.
Looking ahead, the immediate upside target is $0.36, where prior resistance could again act as a hurdle. If buyers reclaim this level decisively, it would confirm continuation of the trend and unlock the next major target at $0.43. These objectives align with the broader Fibonacci extension framework, reinforcing the technical roadmap for higher prices.
From a structural perspective, Tron’s price action remains intact within a bullish framework. The formation of consecutive higher lows, even during corrective pullbacks, highlights the underlying strength of the trend. This pattern supports the idea that corrections are providing opportunities for accumulation, rather than signaling exhaustion.
What to Expect in the Coming Price Action
As long as $0.31 holds, Tron is positioned for continuation higher, with $0.36 as the next key level. A breakout above this zone could accelerate price toward $0.43, confirming bullish momentum.
